We use cookies and similar technologies. You can use the settings below to accept all cookies (which we recommend to give you the best experience) or to enable specific categories of cookies as explained below. Find out more by reading our Cookie Policy.
This page includes relevant broadband statistics for 2023, such as the average cost of UK broadband, the market share of broadband across the country, and mobile broadband statistics.
Share this guide
Since the birth of the World Wide Web in 1989 by Tim Berners Lee, the internet has become a vital tool for information, communication, and entertainment alike.
With streaming being a popular way to watch TV and listen to music, as well as working from home becoming the norm, reliable broadband is now a necessity for the majority of households across the UK.
But how accessible is broadband in the UK and beyond? We’ve collated the latest UK broadband statistics for 2023, covering broadband cost, market share, customer satisfaction, and more.
Compare broadband deals to ensure you get the best plan for your needs.
Quick overview of UK broadband statistics 2023
The average cost of broadband in the UK is £26.90 per month, as of 2023.
Wales had the cheapest average broadband of all countries in the UK (£26.87 per month), though this was only 3p less than the UK average
Those with fibre to the premises (FTTP) connections paid 12% more than those with other broadband connections, on average (£29.86 per month)
BT are the largest broadband provider in the UK, with approximately 9 million customers
England had the strongest 5G accessibility across the UK, with the service available for between 76% and 85% of UK premises
UK broadband market share statistics
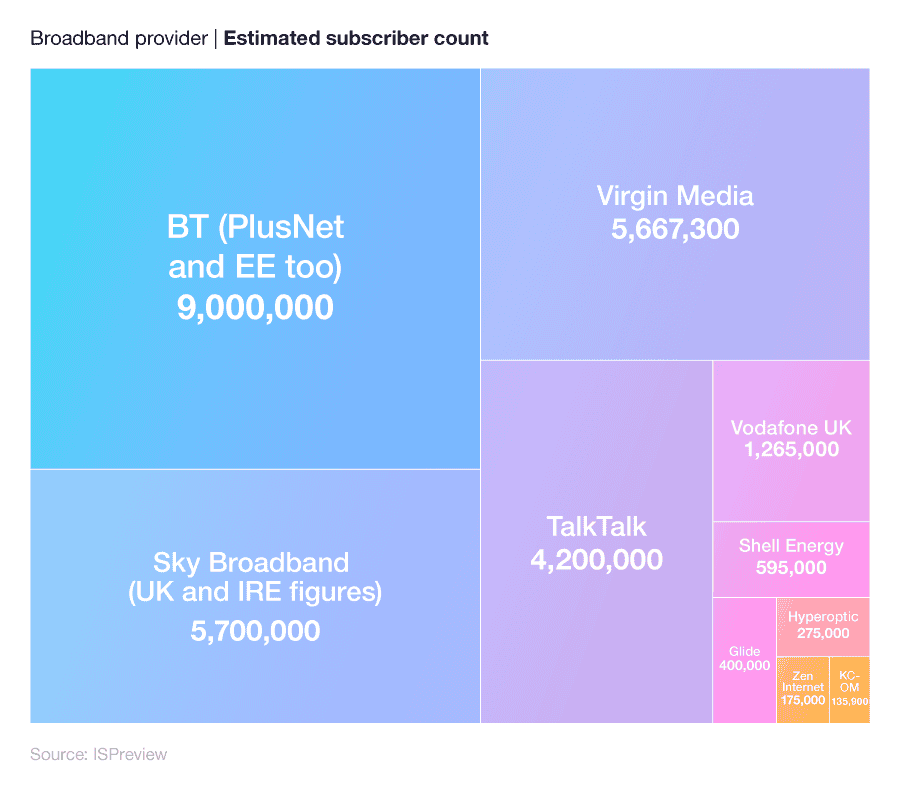
According to UK broadband market share statistics, BT Group, which includes providers BT, Plusnet and EE, have the largest number of UK customers, with 9 million subscribers using its broadband services.
Sky Broadband has a customer base of 5.7 million across the UK and Ireland, followed by Virgin Media O2, which has a broadband market share of around 5.7 million.
A breakdown of UK broadband market share statistics by broadband provider (ISP) and estimated subscriber count
Glide, a specialist business to business (B2B) Wi-Fi service with a focus on students and student accommodation, has a market share of 400,000, making it the seventh most popular broadband provider in the country.
Hull-based KCOM has a market share of less than 140,000, making it the smallest broadband provider on the list, with a subscriber count nearly 70 times less than BT.
What is the average cost of broadband in the UK?
Pricing for broadband services from the UK’s independent full fibre network operators can be lower than those from established providers—an important factor when it comes to potentially switching your broadband.
Though broadband providers usually offer their services at the same prices across the UK, there are some instances where companies offer different prices depending on where you live. Additionally, the average cost of broadband can vary across the UK, depending on the availability of certain packages, and the uptake of certain providers.
According to Uswitch’s global broadband index, the UK ranks as the fifth most affordable country in the world for broadband, as a percentage of income per capita. With an average of £26.39 per month, this equates to around 1.16% of the average citizen’s monthly earnings—a statistic only bettered by Israel (0.78%), Lithuania (0.97%), France (1.14%), and Luxembourg (1.15%). A recent Uswitch study found that the average cost of UK broadband has risen 1.9% since the global broadband index from £26.39 to £26.90.
Data from Ofcom shows full fibre broadband pricing for selected independent providers, as well as BT using the Openreach full fibre network and Virgin Media (which uses DOCSIS 3.1 cable and full fibre technology) to provide ultrafast services. New operators (such as Community Fibre, Hyperoptic, and G.Network) have also entered the broadband market in 2022, resulting in more choice for UK broadband customers.
On top of the monthly price, some broadband providers charge fees for activation, set-up, or installation, which is dependent on the provider and contract length. Broadband deals with no upfront costs are available on the market, but you will need to check this before committing to a package.
Want to try and avoid installation costs? Check out our guide on how to self-install your broadband as a potential method of saving some money.
Broadband installation cost also depends on whether the broadband provider is registered to the Government’s Gigabit Broadband Voucher Scheme (GBVS). The scheme, which has been running since 2021, can provide up to £210 million worth of funding to help homes and businesses cover the costs of installing gigabit broadband.
Households eligible for this can claim vouchers worth up to £1,500 through a registered broadband provider, and businesses can claim up to £3,500.
What is the average cost of broadband in different UK countries?
Our latest UK broadband study found that the average cost of broadband in the UK is £26.90. Of all UK countries, Wales typically had the cheapest broadband, with its monthly average cost of £26.87 around 0.1% less than the UK average.
A breakdown of the average cost of broadband across all UK countries
Country
Average monthly cost
England
£26.88
Scotland
£27.12
Wales
£26.87
Northern Ireland
£28.04
UK
£26.90
(Source: Uswitch)
England was narrowly more expensive than Wales, with its monthly average cost of £26.88 making it the only other UK nation with a typical broadband cost below the collective UK mean. Scotland’s average cost of £27.12 was around 0.9% more than England, while Northern Ireland had the highest average broadband cost at £28.04 per month.
This means that Northern Ireland residents pay around 4% more for broadband on average than those in living in Wales. This may be due to the higher rate of full-fibre coverage in Northern Ireland increasing the availability of more high-speed packages.
Which UK places pay the least for broadband?
The latest UK broadband statistics show that England dominates the list of the cheapest places for broadband in the UK. Nine of the top 10 are based in England, with the south London borough Sutton having the cheapest broadband on average.
With an average monthly cost of £24.83, residents of Sutton pay around 8% less than the UK average.
A breakdown of the UK towns and cities with the lowest average broadband prices
Country
Town/city
Average monthly cost
Difference compared to the UK average
England
Sutton
£24.83
-8%
England
Braintree
£25.16
-6%
Wales
Pontypool
£25.21
-6%
England
Wembley
£25.25
-6%
England
Sunderland
£25.44
-5
England
Tiverton
£25.45
-5%
England
Shepton Mallet
£25.48
-5%
England
Spalding
£25.52
-5%
England
Uttoxeter
£25.53
-5%
England
Barnstaple
£25.53
-5%
(Source: Uswitch)
Welsh town Pontypool was the only non-English place in the top 10, with its average monthly cost of £25.16 the third lowest overall and 6% less than the UK average. Sunderland has the cheapest broadband in the North of England, with the Tyneside city’s average cost of £25.44 per month around 5% lower than the UK average.
Despite having the cheapest broadband in Scotland, Grenock’s average monthly cost of £26.34 was only the 57th lowest in the country overall, and 2% less than the UK average. Similarly, though Coleraine’s average cost of £27.93 was the lowest in Northern Ireland, this was still 4% higher than the UK average, and more expensive than around 300 other UK towns and cities.
Which UK places pay the most for broadband?
England was responsible for nine of the 10 most expensive areas for broadband in the UK, with the Yorkshire town of Castleford having the highest costs overall. With an average broadband cost of £29.41 per month, residents of Castleford typically pay around 9% more than the rest of the UK, on average.
A breakdown of the UK towns and cities with the highest average broadband costs
Country
Metro
City
Avg monthly cost
Sales
Difference compared to the UK average
England
Yorkshire
Castleford
£29.41
92
9%
England
North West
Wallasey
£29.35
59
9%
England
North West
Leyland
£29.14
70
8%
England
London
East Grinstead
£28.85
57
7%
Scotland
Central Scotland
Hamilton
£28.78
88
7%
England
London
Walton-on-Thames
£28.71
51
7%
England
North West
Winsford
£28.66
90
7%
England
Midlands
Rugby
£28.59
169
6%
England
North West
Birkenhead
£28.34
359
5%
England
South West
Torquay
£28.29
102
5%
(Source: Uswitch)
Castleford was followed by the northern towns of Wallasey and Leyland, which were the only other places with average costs above £29 per month. Hamilton was the most expensive place for broadband in Scotland (£28,78), with an average monthly bill 7% higher than the UK average and the fifth most expensive overall.
Barry was the most expensive Welsh town for broadband, with its average monthly cost of £28.20 around 5% higher than the UK average and the joint-13th highest overall in the UK.
What is the average cost of UK broadband by speed?
The latest UK broadband statistics found that those with speeds between 0Mb and 30Mb typically pay the lowest for broadband, with average costs of just over £20 per month.
A breakdown of the average costs of UK broadband by download speed
Speed group
Avg monthly cost
Sales
0-30Mb
£20.01
2,114
30-60Mb
£25.62
11,821
60-99Mb
£25.66
84,906
100-149Mb
£27.58
31,814
150-249Mb
£21.60
13,294
249-999Mb
£33.65
23,592
1Gb+
£46.44
1,229
(Source: Uswitch)
There is a rise of around 28% between those on 0-30Mb packages and those with speeds between 30Mb and 60Mb (£25.62). This is followed by a much smaller rise of 0.1% between 30-60Mb customers and those on 60-99Mb (£25.66).
Despite a rise of around 7.5% between 60-99Mb customers (£25.66) and those on 100-149Mb (£27.58), this is followed by a drop of nearly 22% as we reach speeds 150-249Mb. This means that people on 150-249Mb plans are typically paying 7% less than those on the much slower 30-60Mb plan.
The biggest single increase occurs between 150-249Mb and 249-99Mb, with prices rising 55%, from £21.60 to £33.65.
Broadband speed statistics found those with speeds in excess of 1GB typically pay the most for broadband, with the average monthly cost of £46.44. This is around 38% higher than those on 249-999Mb plans, and 132% higher than those on 0-30Mb.
What is the average cost of UK broadband by broadband type?
Recent broadband connection statistics found those with fibre to the premises (FTTP) connections pay the most for their broadband, with an average monthly cost of £29.86 – around 12% more than any other connection. This is followed by fibre to the cable (FTTC) connections (£26.41), which are the only other connection type with average costs above £25 per month.
A breakdown of the average cost of UK broadband by the type of connection
Speed group
Average monthly cost
Sales
ADSL
£20.33
1,827
FTTC
£26.41
123,554
FTTP
£29.86
38,408
Mobile
Broadband
£18.70
4,980
(Source: Uswitch)
There is a substantial drop of almost a quarter (23%) between the cost of FTTC broadband and traditional ADSL connections, before a smaller decrease of 8% between ADSL broadband and mobile broadband. With an average monthly cost of £18.70 per month, mobile broadband is typically the cheapest connection type, and the only one with average monthly costs below £20.
UK broadband cost statistics by provider
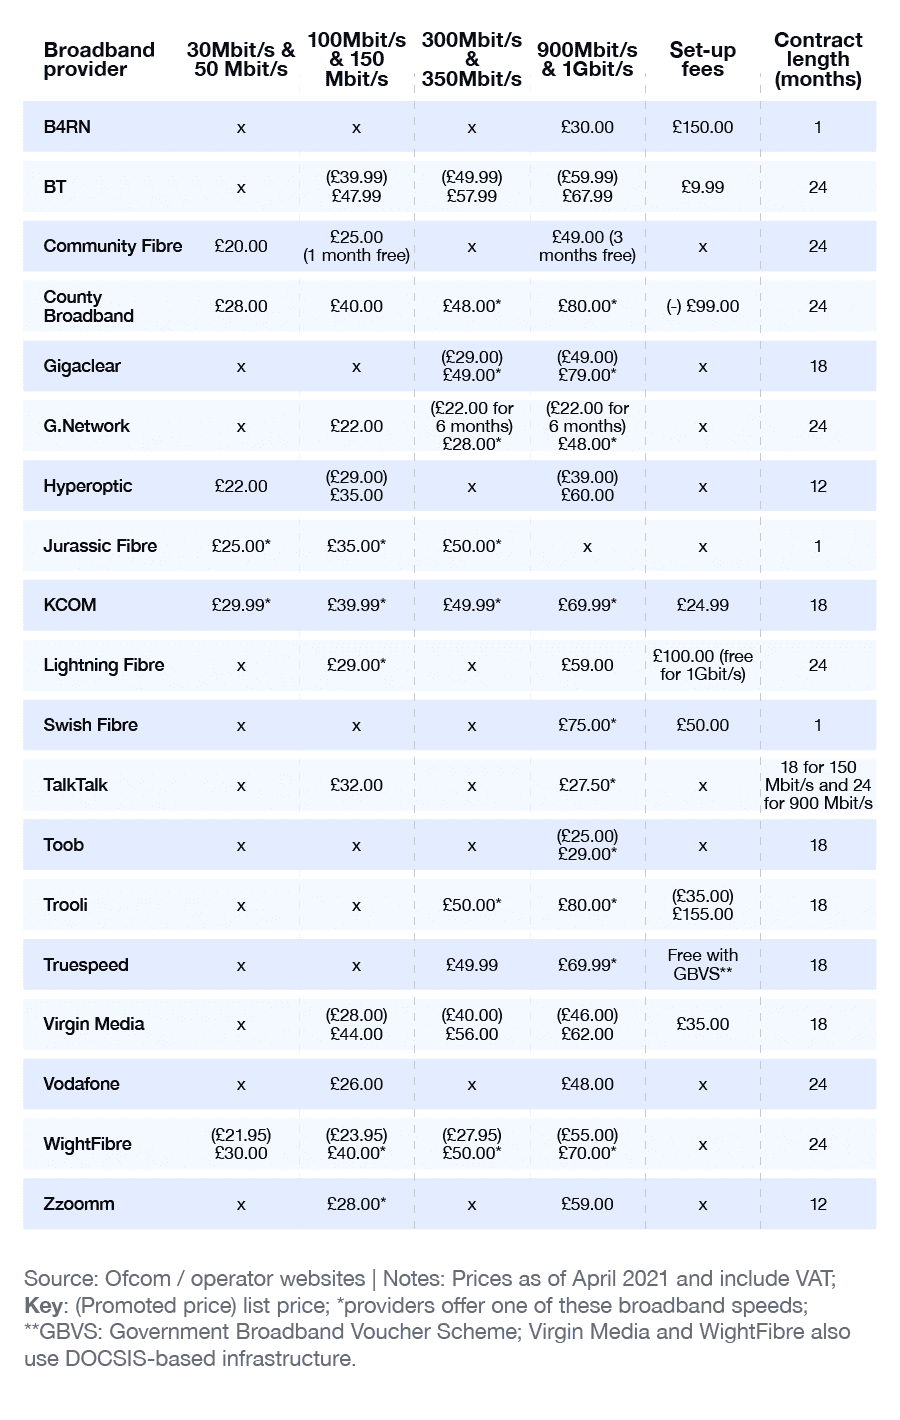
Knowing when to switch your broadband is no easy answer. Average UK broadband costs vary considerably between providers and the type of broadband you purchase. Some providers will offer promotional prices, as a way of enticing new customers to join, with the list price returning to similar prices offered by competitors after a given period of time.
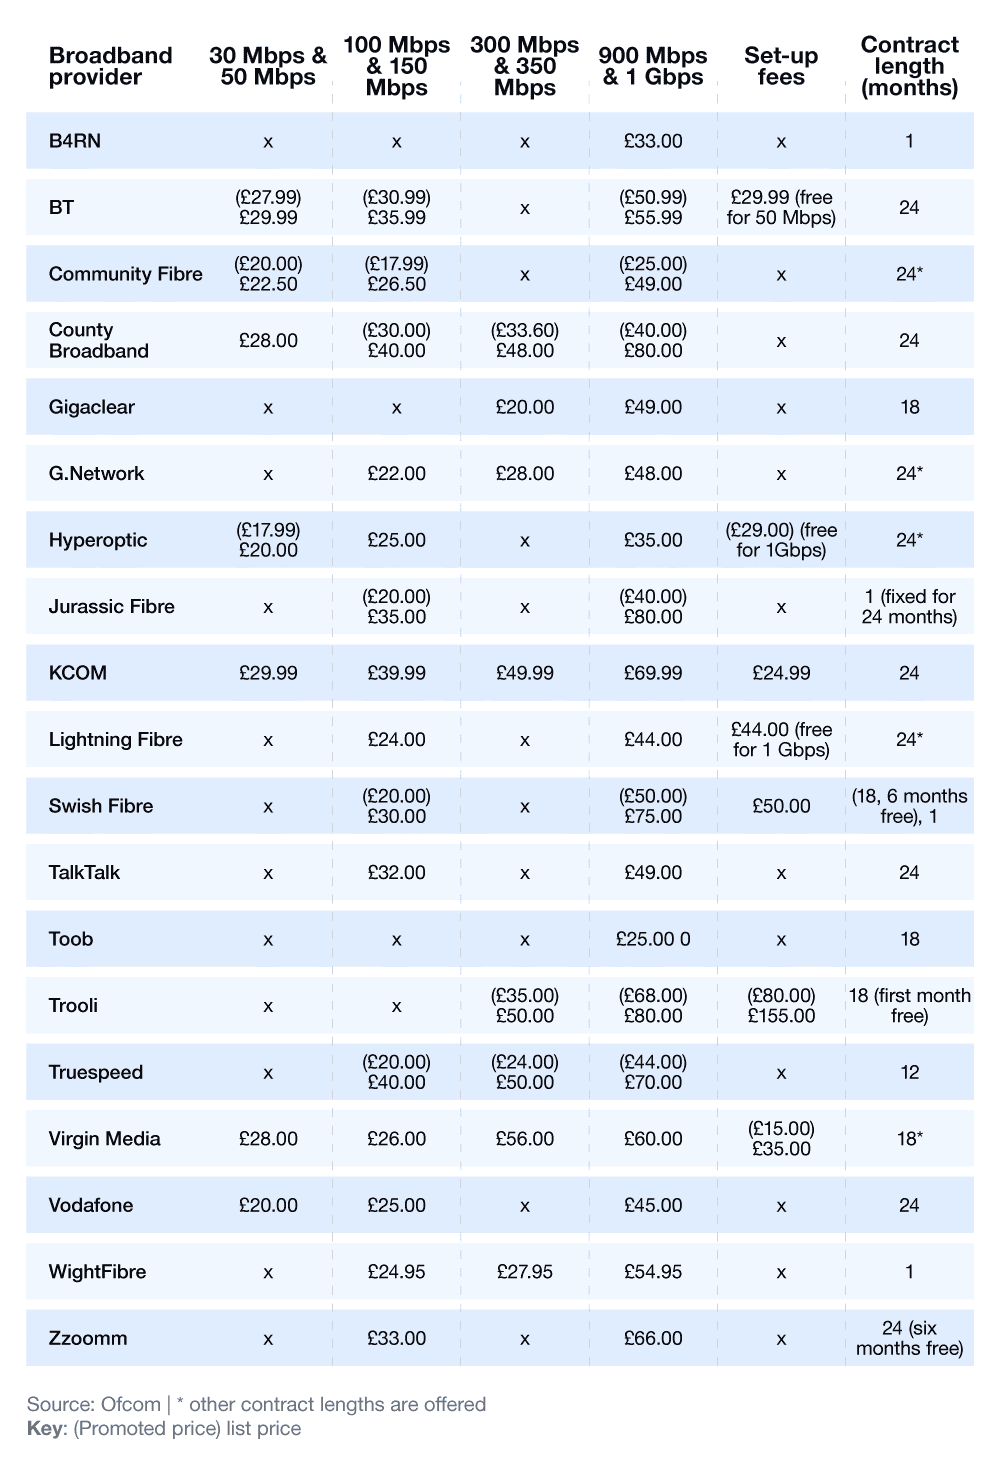
The average monthly broadband cost for 30Mbps and 50Mbps packages ranges between £20-£28, compared to £22-£40 for 100Mbps and 150Mbps deals.
A breakdown of UK broadband cost statistics by broadband provider and package
Those opting for 300Mbps and 350Mbps advertised download speeds can expect to pay anything between £20 a month with Gigaclear, up to £56 per month for Virgin Media. Should you desire some of the fastest broadband speeds on the market (900Mbps and 1Gbps), average monthly broadband costs will set you back somewhere between £25 (Toob) and £80 (Trooli, Jurassic Fibre, and County Broadband).
It’s also worth noting that some UK broadband providers will charge installation costs, have varying lengths of contract, and may incur mid-contract price increases in 2024. Therefore, it’s advisable to fully check the terms and conditions before committing to a broadband package.
Saving money on your broadband bill is a high priority for many UK households, particularly during the current cost of living crisis. There are also cheap broadband deals for low income families in the UK, such as Community Fibre, to help ensure all households across the country have the opportunity to access a decent domestic broadband service.
Recent UK broadband stats reveal that, as of February 2023, only 5.1% of UK households on Universal Credit decided to take advantage of social tariffs offered by broadband providers.
During this time, around 4.3 million UK households were receiving some form of Universal Credit, and yet only 220,000 households moved onto a social broadband tariff. This is an increase of 300% from February 2022, when the social tariff takeup figure stood at just 55,000 households.
Broadband providers and their social tariffs
ONS research suggests that as many as three in 10 households struggled to pay their communications bills in January 2023. Furthermore, over half (53%) of eligible customers aren’t aware that social tariffs exist.
Below is a list of current social broadband packages available in the UK in 2023, along with their associated monthly costs, average advertised speed, and eligibility criteria.
A breakdown of current social tariff broadband packages available in the UK 2023
Package
Price (per month)
Average speed
You could qualify if you receive...
4th Utility Social Tariff
£13.99
30Mbps
Open to all
Air Broadband Air Support
£20
100Mbps
Various benefits (in and out of work)*
BT Home Essentials
£15
Around 36Mbps
Various benefits (in and out of work)*
BT Home Essentials 2
£20
Around 67Mbps
Various benefits (in and out of work)*
Community Fibre Essential
£12.50
20Mbps
Open to all
Country Connect Social Tariff
£15
50Mbps
Various benefits (in and out of work)*
EE Basics
£12
Up to 25Mbps
Various benefits (in and out of work)*
G.Network Essential Fibre Broadband
£15
50Mbps
Various benefits (in and out of work)*
Grayshott Gigabit Connect
£19
100Mbps
Various benefits (in and out of work)*
Hyperoptic Fair Fibre 50
£15
50Mbps
Various benefits (in and out of work)*
Hyperoptic Fair Fibre 150
£20
150Mbps
Various benefits (in and out of work)*
KCOM Full Fibre Flex
£14.99
30Mbps
Various benefits (in and out of work)*
Lightning Fibre Social Tariff
£15
50Mbps
Various benefits (in and out of work)*
Lothian Broadband Social Tariff
£19.99
100Mbps
Open to all
NOW Broadband Basics
£20
36Mbps
Universal Credit or Pension Credit
Sky Broadband Basics
£20
36Mbps
Universal Credit or Pension Credit
SMARTY Social Tariff
£12
5G where available
Various benefits (in and out of work)*
Virgin Media Essential Broadband
£12.00
15Mbps
Universal Credit
Virgin Media Essential Broadband Plus
£20
54Mbps
Universal Credit
Vodafone Essentials Broadband
£12
38Mbps
Various benefits (in and out of work)*
VOXI For Now
£10
5G where available
Various benefits (in and out of work)*
Wildanet Helping Hand Social Tariff
£20
30-100Mbps
Universal Credit
WightFibre Essential Broadband
£16.50
100Mbps
Universal Credit or Pension Credit
(Source: Ofcom)
*Each company has its own list of eligible benefits, but all include Universal Credit. Other benefits may include Pension Credit, Job Seekers’ Allowance, Employment and Support Allowance, Income Support, Personal Independence Payment, Attendance Allowance, and Care Leavers’ Support.
Early Termination Charges (ETCs)
Ofcom noted that TalkTalk, Shell, EE, Plusnet, Vodafone, O2, and Three have all not committed to introducing a social tariff for home broadband.
Certain broadband providers may apply Early Termination Charges (ETCs) if the current broadband contract is ended prematurely by the customer. February 2022 data from Ofcom shows the potential value of social tariffs equates to £144 per year per customer. However, ETC’s are valued at between £10-£14 per month, so if your contract has 6 months left, then you are liable to pay between £60-£84 in order to terminate your social tariff broadband deal early.
UK mobile broadband statistics
With almost every major mobile phone manufacturer now producing 5G capable devices, UK mobile network operators are beginning to extend coverage from large cities to smaller towns and settlements.
A breakdown of 4G and 5G mobile broadband statistics across different countries of the UK
5G broadband coverage statistics across the UK
In terms of full 5G coverage across the UK, England has the strongest connections of all four UK nations. Outside of premises, 5G signal is available across 76-85% of the nation—the only country that exceeds the minimum UK average coverage figures of 39-58%.
UK broadband stats reveal that 5G coverage in Northern Ireland is significantly behind that of England, with only 48-55% of the nation covered near premises. Similarly, Wales also lags behind the UK average, with 5G coverage only extending to somewhere between 49%-61% of the country.
5G coverage statistics per operator
5G across the UK is covered by multiple MNOs, or Mobile Network Operators. BT and EE, Three, Virgin Media and O2, and Vodafone offer some of the UK’s fastest mobile coverage on the market.
A breakdown of 5G coverage statistics by operator and their percentage coverage for outside UK premises
5G network provider
% coverage outside UK premises
Three
58%
BT and EE
55%
Vodafone
42%
Virgin Media and O2
38%
(Source: Ofcom)
Of all MNOs, Three offers the widest 5G coverage, with 58% of UK outdoor premises covered by a 5G signal, as of September 2022. In a close second is BT and EE, working together for their 5G offering, covering over half (55%) of outdoor premises confidently—this represents just 3% less than that of Three. Virgin Media and O2’s coupling yields the least coverage across the UK, with 38% of outdoor premises having access to a consistent 5G signal.
4G broadband coverage statistics across the UK
Across all four nations in the UK, 4G coverage is far more widespread than that of its more modern counterpart, 5G. As of January 2023, the average outdoor 4G coverage for the UK stands above 99%.
4G coverage across England reflects that of the entire UK (99% and above). However, that applies to ‘outside premises’, meaning signal availability in areas such as villages, towns, and cities. 4G coverage geographically across the nation is somewhere between 92-94%, meaning that between 6-8% of the landmass is currently not covered by a consistent 4G signal. Only 2% of England has zero 4G signal, and that figure has remained stable from the 2% recorded in 2021.
In Scotland, 4G outside premises is between 97-99% coverage, almost rivalling that of the UK’s average. However, in terms of full-geographic coverage, they only have 57-75% of their landmass covered by 4G, meaning large swathes of the nation remain without consistent 4G broadband. The 4G signal figure has, however, improved somewhat since recording 57-74% 4G coverage in May 2022. 17% of the country has zero access to 4G, an improvement of 1% over data from 2021.
Corresponding UK broadband stats show that Wales offers similar 4G coverage to Scotland, in terms of 4G outside premises (96-99%). With regards to 4G coverage by geography, Wales has 74-85% of their landmass covered—almost 20% more compared to Scotland. However, 9% of Wales has zero access to 4G, 1% more than the UK’s average of 8%.
Northern Ireland’s 4G coverage is between 97-99% for outside premises, representing the second-best 4G coverage statistics in the UK. In terms of geographic coverage, the country recorded 88-92% in January 2023, a recorded figure that is higher than all other UK nations apart from England. Only 3% of NI’s landmass has zero access to 4G, markedly better than Wales and Scotland, and 5% better than the UK average.
A breakdown of 4G coverage statistics per operator (2022)
4G network provider
% coverage across geographical landmass (2022)
% improvement from 2021
BT and EE
87%
0.01
Virgin Media and O2
82%
0.02
Vodafone
82%
0%
Three
80%
0.01
(Source: Ofcom)
UK broadband statistics indicate BT and EE’s 4G coverage has the widest reach amongst network operators, with 87% of the UK’s entire landmass covered by their signal. This is a small improvement of 1% since 2021.
In joint-second is Virgin Media and O2, alongside Vodafone. They each have 82% of the UK’s landmass covered by 4G signal, although in the case of VMO2, the 82% figure is a 2% increase over 2021 figures, compared to 0% increase for Vodafone.
5G’s largest provider, Three, has the smallest amount of 4G signal coverage in the UK as of 2022, with 80% of the landmass covered. This represents a small improvement of 1% compared to 4G coverage statistics for 2021.
Rural vs urban 4G coverage statistics across the UK
BT and EE, Virgin Media and O2, Three, and Vodafone all claim 100% 4G coverage of UK urban areas, exactly the same as offered in 2021.
However, in rural parts of the UK, 4G coverage doesn’t exceed 84%. BT and EE claim that figure, covering the largest geographical area with signal—a 2% improvement on their 2021 figures.
Virgin Media and O2 also improved between 2021-22, raising their rural UK coverage figure to 80% (a 2% increase from 2021).
Neither Three nor Vodafone improved in 2022 on their 2021 rural coverage statistics, with Vodafone achieving 80% and Three achieving only 76%.
UK broadband customer satisfaction statistics
The latest UK broadband statistics found that Plusnet and EE had the highest average customer satisfaction ratings of all major broadband companies. Both achieved overall scores of 3.94 out of 5 based on nine metrics.
EE also scored highest when it came to customer service (3.93) and communication (3.94). At the other end of the scale, Virgin Media scores lowest when it came to customer service (3.40).
Visit our broadband awards page to find out which providers impressed with their services.
A breakdown of best broadband providers in the UK by customer feedback (2023)
Provider
Average score
Satisfaction with customer service
Satisfaction with value for money
Satisfaction with speed of service
Reliability
Satisfaction with home equipment
Satisfaction with installation/setup
Satisfaction with communication
Satisfaction with billing
Satisfaction of overall contract price
Plusnet
3.94
3.77
3.89
3.86
3.94
4.01
4.17
3.89
4.06
3.88
EE
3.94
3.93
3.93
3.86
3.92
3.97
4.04
3.94
4.05
3.81
BT
3.92
3.72
3.66
4.01
4.08
4.1
4.16
3.85
4.07
3.66
Now Broadband
3.92
3.58
4.05
3.76
3.89
3.94
4.18
3.83
4.03
4
Vodafone
3.9
3.62
3.91
3.94
3.82
4.02
4.06
3.75
4.05
3.93
Sky
3.89
3.78
3.7
3.91
3.99
3.99
4.13
3.84
4.02
3.65
TalkTalk
3.87
3.54
3.88
3.83
3.84
3.93
3.83
3.8
4.03
4.82
Virgin Media
3.72
3.4
3.49
3.99
3.8
3.88
3.96
3.65
3.9
3.43
(Source: Uswitch)
BT customers were most likely to be happy with their speeds (4.01), followed by Virgin Media (3.99) and Vodafone (3.91). Conversely, Now Broadband were the company that scored lowest when it came to speed, with an average score of 3.76.
Now Broadband performed much stronger when it came to value for money, however, with their overall score of 4.05 the highest of any company.
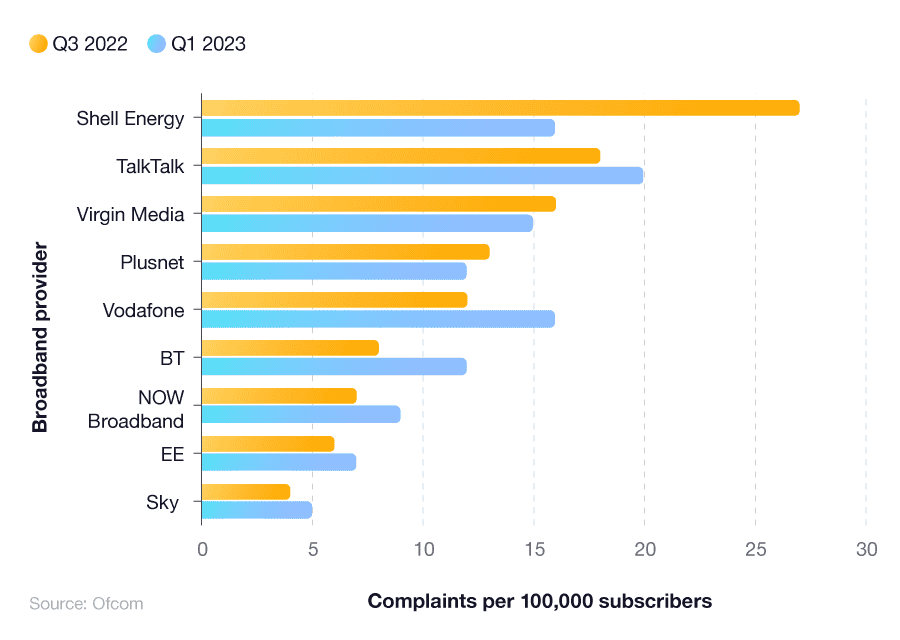
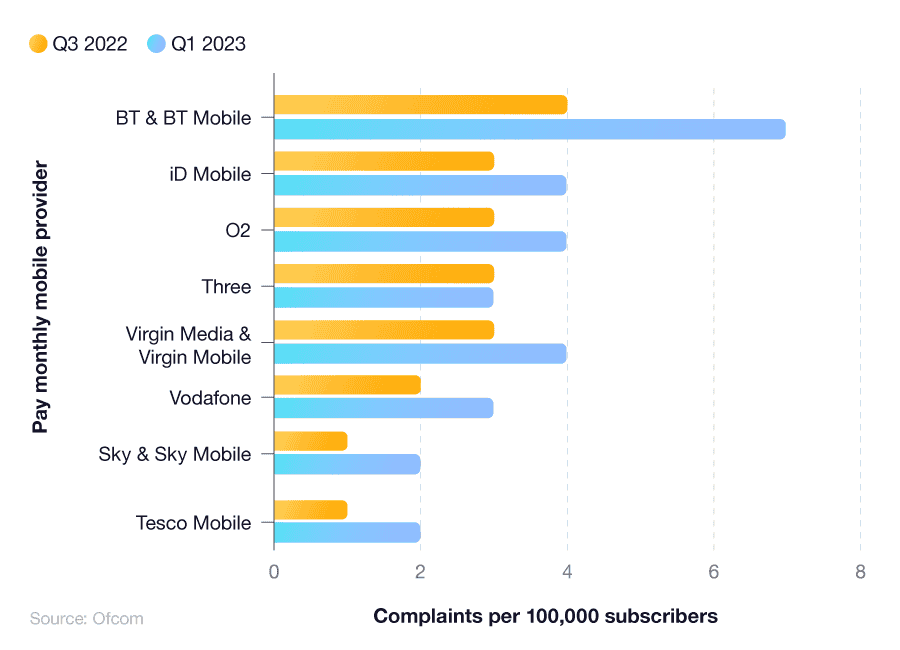
A breakdown of broadband complaints statistics per 100,000 subscribers in Q3 2022 and Q1 2023
On average, 12 out of 100,000 customers in Q1 2023 complained to Ofcom about their broadband provider – an increase of one compared to Q3 2022. This shows relative stability within the broadband market regarding quality of service from broadband providers.
Ofcom customer complaints statistics show that Talk Talk accrued the most complaints in Q1 2023. Out of 100,000 customers, 20 people registered an issue with Ofcom regarding Talk Talk’s broadband service, with the primary issue being ‘complaints handling’ and ‘faults, service, and provisioning’.
Shell Energy was the second most complained about broadband provider, receiving 16 Ofcom complaints per 100,000 customers in Q3 2022 – a substantial decrease from the 27 complaints seen in Q3 2022.
Meanwhile, EE had only seven complaints in Q3 2021 – up from six in Q3 2022.
Both providers remain far below the industry average of 12 complaints per 100,000 subscribers, with NOW Broadband (9) the only other company to receive less complaints than the industry average.
Most common broadband issues in the UK
In the UK, the main reason for Ofcom complaints regarding broadband is ‘faults, service and provisioning’. This can be attributed to outages and speed throttling, alongside customer service itself, and represents less than four in 10 (33%) of all broadband complaints made to Ofcom.
UK broadband statistics show that just under one in three (29%) Ofcom complaints in 2022 related specifically to ‘complaints handling’ (i.e. the way companies deal with issues raised by the customer).
Finally, less than a fifth (16%) of UK broadband customers complained to Ofcom about their provider’s ‘billing, pricing and charges’. Talk Talk, the company with the largest number of complaints relating to broadband, had nearly a fifth (19%) of its customer complaints relating to this very reason.
Mobile data customer satisfaction statistics
Mobile broadband data usage has increased exponentially across the UK in recent years, with 4G now covering almost the entire country, and the superfast 5G rollout happening in towns and cities nationwide.
According to UK broadband stats from Ofcom, the average monthly data consumption on mobile broadband alone was eight gigabytes in 2022 – a 43% increase on the 2021 figure. However, with increased subscriber counts and usage comes increased scrutiny. Below are the mobile broadband complaints statistics available for Q3 2021 and Q3 2022 per 100,000 subscribers.
A breakdown of mobile broadband data complaints statistics per 100,000 subscribers in Q3 2022 and Q1 2023
For mobile complaints in Q1 2023, the industry average is less than that of fixed broadband: just three complaints per 100,000 customers, as opposed to 12 complaints, respectively for the latter. This represents a small increase from Q3 2022, when there were only two complaints.
BT Mobile had the most complaints per mobile provider, with a total of seven in Q1 2023 alone. This is six more than the industry average, and three more than next-most complained about providers (O2, iD Mobile, and Virgin Mobile).
BT Mobile also had the largest increase in complaints, having received just four Ofcom complaints per 100,000 customers for Q3 2022. In the same period a year earlier, they accrued only two complaints per 100,000 customers – the industry average for that period.
Sky Mobile and Tesco Mobile were the two companies who had the least complaints made about them, with both receiving just two complaints each in this time period.
Most common mobile broadband issues in the UK
‘Complaints handling’ was the most complained about issue relating to mobile broadband in Q1 2023, featuring in just over a quarter (27%) of total Ofcom complaints. This highlights just how important customer service is to UK broadband consumers.
This was followed by ‘faults, service, and provisioning’, which featured in almost a quarter (23%) of total Ofcom complaints during this period, with ‘billing, pricing, and charges’ appearing in 18% of complaints.
Around three in 10 (30%) of BT’s issues were focused on ‘changing provider’ – the highest figure recorded for this complaint across all broadband providers.
Check out our broadband provider reviews for further information on different UK internet suppliers, or check out our broadband customer survey to see which companies have performed best for customer satisfaction.
UK broadband FAQs
In 2021, 94% of UK adults accessed the internet, equating to 63.2 million people.
The average UK resident spends around four hours per day accessing the internet, whether that be for work or content consumption, such as video gaming and streaming platforms.
According to Ofcom’s Connected Nations Report 2022, only 0.3% of UK homes and businesses still do not have access to decent broadband (around 10Mbps). This affects around 80,000 properties across the UK, both residential and business.
In September 2022, the median average download speed in the UK was 65.3Mbps—a marked improvement over the 59.4Mbps figure recorded in March 2022. The median upload speeds in 2022 also rose, with the average figure standing at 15.5Mbps (a 4.9Mbps improvement from March 2022).
In terms of fibre optic broadband, there are two options in order to connect your home to the internet. FTTC, or ‘fibre to the cabinet’, is a system wherein your home is connected to an exchange (a street-level cabinet) by modern copper cables. In turn, this is connected to the primary exchange through fibre optic cables and means the data is lightning-fast to the street exchange, but a bit slower to your home.
Meanwhile, FTTP, or ‘fibre to the property’, utilises fibre optic cabling at every stage of the above process, meaning that more data can be transmitted at much higher speeds.
90% of UK homes currently have access to FTTC, however it’s being phased out due to the rapid rise in demand for faster broadband, and the widening availability of FTTP deals across the UK.
There are over 150 broadband providers available in the UK, supplying a range of different speeds and services, depending on the type of broadband available in that area.
In the third quarter of 2022, the average person in the UK spent around five hours and 47 minutes accessing the internet via any service.
UK broadband glossary
4G
4G, or Fourth Generation, is a type of broadband typically used by mobile devices. Following on from 3G, 4G is between five and seven times faster than its predecessor, allowing for a maximum potential peak download speed of 300Mbps. Although realistically, 42Mbps is consistently achievable on standard 4G with the higher speeds usually recorded on 4G LTE (A type of 4G not readily available in the UK). These speeds are a huge improvement on 3G services, which were limited to an average speed of 6Mbps in real world tests.
5G
Following on from 4G, 5G is the latest in high-speed internet connectivity, again typically used on mobile devices. 5G is seen as five times faster than 4G, and with a decreased latency, means data signals should stay stronger and more reliable as the networks roll out full coverage.
Broadband
Broadband is the most prevalent way households connect to the internet in the UK. The name derives from ‘wide-bandwidth data transmission’, and unlike its predecessor ‘dial-up’, can remain online and connected at all times.
Fibre broadband
Fibre broadband is the backbone of high-speed internet access for the UK. Instead of using traditional copper cables to send data, fibre broadband uses optical cables, which are far more capable of sending large quantities of data reliably. Fibre broadband sends data via beams of light, meaning there’s no geographical slowdown. As a result, much higher download and upload speeds are available for broadband customers.
Fixed wireless broadband
Fixed wireless broadband is a variant of broadband that uses radio signals to transmit data instead of using copper or fibre optic cables. Quite often this is using 4G or 5G connectivity and is traditionally achieved by installing a satellite dish to the top of the property. In turn, this will communicate with another device in its line of sight, and so on all the way to the initial server. This system aims to connect rural properties that cannot access copper or fibre cables, and offers similar broadband speeds to that of fibre, although often at a higher cost.
Gigabit-capable broadband
Put simply, gigabit-capable broadband offers download speeds of 1,000Mbps, or 1Gbps. Films in high definition (HD) are typically between two and four gigabytes in size, meaning it could potentially take mere seconds to fully download using gigabit-capable broadband. While this won’t make the server you’re downloading from any faster, it has the added-benefit of increasing bandwidth for your entire home. This means large families with various devices won’t experience any slowdown from their broadband.
Internet Service Provider (ISP)
Internet service provider (ISP) is the phrase used to describe companies that provide internet access to customers. Examples of such companies are BT, Virgin Media, and PlusNet. In the UK, data shows there are over 100 registered ISPs, highlighting the competitive nature of the UK broadband market.
Mbps
Mbps stands for ‘megabits per second’, and is a unit of measurement in terms of data transfer and network speed. A megabit is 1/8th of a megabyte, meaning that if you have a broadband speed of 100Mbps, you can download 12.5 megabytes per second of data (MBps). When written, ‘Mb’ stands for megabit and ‘MB’ stands for megabyte.
Since the birth of the World Wide Web in 1989 by Tim Berners Lee, the internet has become a vital tool for information, communication, and entertainment alike.
With streaming being a popular way to watch TV and listen to music, as well as working from home becoming the norm, reliable broadband is now a necessity for the majority of households across the UK.
But how accessible is broadband in the UK and beyond? We’ve collated the latest UK broadband statistics for 2023, covering broadband access, usage, speed, cost, and more.
In the UK, there were 27.3 million fixed broadband lines fitted to homes in Q3 2022, an increase of 91,000 from the time in 2022.
During the same period, data shows that 99.7% of UK homes had access to decent internet (10Mbps or above).
Over three-quarters (76%) of UK properties have access to gigabit internet, with theoretical download speeds of 1Gbps.
Nottingham suffered the longest combined outage time in the UK in 2022, with over 70 hours spent disconnected to the web.
Virgin Media offered the closest average download speeds to what they advertised (97.58%) which was 7% more than their nearest rival, Zen.
BT is the best-reviewed broadband provider, with 83% of customers satisfied with the service they receive.
UK broadband market share statistics
UK broadband market share statistics by provider
According to UK broadband market share statistics, BT, in conjunction with Plusnet and EE, have the largest number of UK customers, with 9.3 million subscribers using their broadband services.
Sky Broadband has a customer base of 6.7 million across the UK and Ireland, followed by Virgin Media (combined with O2), which has a market share of around 5.6 million.
A breakdown of UK broadband market share statistics by broadband provider (ISP) and estimated subscriber count
Glide, a specialist business to business (B2B) Wi-Fi service with a focus on students and student accommodation, has a market share of 400,000, making it the seventh most popular broadband provider in the country.
Hull-based KCOM has a market share of less than 140,000, making it the smallest broadband provider on the list with a subscriber count nearly 70 times less than BT.
UK broadband access statistics
UK broadband statistics show that there were 27.8 million fixed broadband lines in the UK at the end of Q3 2022—an increase of 91,000 (0.3%) year-on-year. Of these, around 70% (19.4 million) were predominantly FFTC or full fibre variants
The number of ADSL lines fell by 209,000 (6.6%) during the quarter. These figures are likely to have been influenced by Openreach’s ongoing ‘copper switch-off’ resulting in more people moving onto full-fibre connection.
Conversely, cable line numbers increased by 13,000 (0.2%), and the number of ‘other including FTTx’ lines increased by 154,000 (0.8%).
Between Q3 2021 and Q3 2022, the number of dedicated mobile broadband subscriptions also increased by 100,000 (1.2%) to 5.3 million nationwide.
How many people access the internet in the UK?
Over the years, the share of households with access to a “decent” broadband connection has grown steadily.
What is decent broadband?
Decent broadband is described as having a download speed of at least 10Mbps and an upload speed of at least 1Mbps.
UK broadband statistics from Ofcom’s latest Connected Nations Report discovered that 99.7% of households in the UK had access to a decent broadband connection as of September 2022. This was up by more than one percent from the last report in September 2021.
A breakdown of UK households with access to at least 10Mbps broadband services (2021-2022)
Country
May 2021
September 2021
January 2022
September 2022
UK
98%
98%
99%
99.70%
England
99%
99%
99%
99.80%
Northern Ireland
95%
95%
96%
99%
Scotland
97%
97%
97%
99%
Wales
97%
97%
98%
99%
(Source: Ofcom)
UK broadband access statistics reveal the number of properties (both residential and commercial) that cannot receive a decent broadband service from a fixed line stands at around 80,000 (or 0.3%) as of September 2022. This is a significant decrease from 650,000 in December 2021. Half of these (40,000) are located in England, with 21,000 in Scotland, 10,000 in Wales, and 9,000 in Northern Ireland.
A breakdown of UK homes and businesses unable to access decent broadband services (2021-2022)
Country
May 2021
September 2021
January 2022
September 2022
UK
0.40%
0.40%
0.30%
0.30%
England
0.30%
0.20%
0.20%
0.20%
Northern Ireland
2%
2%
2%
1%
Scotland
1%
1%
1%
1%
Wales
1%
1%
0.70%
1%
(Source: Ofcom)
What percentage of the UK has gigabit broadband?
The number of homes able to get gigabit-capable broadband continues to increase, with nearly 20.8 million (70% of all UK homes) now able to access these faster services—up from 13.7 million (47%) in December 2021.
This has, in part, been driven by the rollout of full-fibre broadband and Virgin Media O2 making its network entirely gigabit-capable.
A breakdown of UK premises with access to gigabit-capable broadband services (2021-2022)
Access to full fibre
May 2021
September 2021
January 2022
September 2022
UK
40%
47%
66%
70%
England
38%
46%
67%
71%
Northern Ireland
73%
76%
82%
87%
Scotland
47%
51%
60%
64%
Wales
30%
36%
46%
52%
(Source: Ofcom)
UK broadband access statistics indicate that gigabit-capable broadband is now available to 87% of Northern Ireland’s premises—the most of any UK nation and accounts for 0.7 million locations across the country. This is followed by England, with more than seven in every 10 locations (71%) now able to access gigabit-capable broadband (or 17.6 million premises).
Ofcom’s broadband report shows that Wales has the smallest percentage, with just over half (52%) of its homes and businesses connected to gigabit-capable broadband. However, as a total, this equates to 0.8 million—approximately 100,000 more than Northern Ireland.
Over time, the percentage of UK premises connected by gigabit-capable broadband has almost doubled, from just 40% in May 2021. England has seen the biggest increase (33%) of all four UK nations, followed by Wales (22%) within the previous 18 months.
What percentage of the UK has full fibre broadband?
UK fibre broadband statistics indicate that full fibre coverage across the country continues to increase with more than four in 10 (42% of) UK homes having access to full fibre services in September 2022. As a result, full fibre coverage sits at just under 12.4 million—an increase from 8.2 million (28%) homes in December 2021 and a seven-fold increase since 2018.
This has been bolstered through deployments by larger fibre infrastructure operators, and supported by smaller providers up and down the UK that serve individual regions.
A breakdown of UK premises with access to full fibre broadband (2021-2022)
Country
May 2021
September 2021
January 2022
September 2022
UK
24%
28%
33%
42%
England
23%
27%
31%
41%
Northern Ireland
67%
71%
79%
85%
Scotland
23%
27%
32%
41%
Wales
24%
27%
32%
40%
(Source: Ofcom)
In terms of UK broadband access statistics for full fibre internet, Northern Ireland is leading the way across all four UK nations, with 85% of its premises now served by this type of broadband. This equates to around 0.7 million properties. By contrast, Wales has managed to connect around 0.6 million homes and businesses with full fibre broadband, yet this represents only 40% of its total property numbers.
Unsure of which broadband product to get? Check out our business vs home broadband guide to help select a product that is right for you.
A broadband report by Ofcom indicates England and Scotland have both managed to connect 41% of their premises with a full fibre broadband connection. However, in terms of numbers, this accounts for approximately 10.1 million and 1.1 million homes and businesses, respectively.
What percentage of the UK has superfast broadband?
Superfast broadband coverage continues to slowly grow—albeit at a reduced pace compared to gigabit and full fibre—with coverage now reaching 97% of all UK homes. This slow progress is likely due to the increased rollout of full fibre and gigabit-capable connections UK-wide.
A breakdown of access to superfast broadband services (2021-2022)
Country
May 2021
September 2021
January 2022
September 2022
UK
96%
96%
96%
97%
England
96%
96%
97%
97%
Northern Ireland
90%
91%
92%
94%
Scotland
94%
94%
94%
94%
Wales
94%
94%
95%
95%
(Source: Ofcom)
According to recent UK broadband access statistics from Ofcom, England continues to lead the way in terms of superfast broadband coverage, at 97%, followed by Wales (95%), and then Northern Ireland and Scotland (both 94%).
What about fixed wireless access (FWA) networks and wireless internet service providers (WISPs)?
Aside from gigabit, full fibre, and superfast, broadband services are also available from Fixed Wireless Access (FWA) networks provided via mobile networks, or through Wireless Internet Service Providers (WISPs).
Latest Ofcom data shows that FWA coverage from mobile networks is available to 95% of premises in the UK, and around 7% can receive a decent broadband service from a WISP.
A breakdown of UK premises with access to fixed wireless networks (2021-2022)
Type of network connection
May 2021
September 2021
January 2022
September 2022
UK Mobile Network Operators
(MNO)
93%
94%
94%
95%
UK Wireless Internet Service
Providers (WISPs)
6%
7%
7%
7%
(Source: Ofcom)
Wireless broadband statistics show that since May 2021, the percentage of UK premises has increased by 2%, whereas the corresponding figures for UK WISPs has risen by just 1%.
As of September 2022, UK broadband stats for MNOs indicate that 96% of England’s homes and businesses could connect to such a network, compared to just 85% for Northern Ireland. Comparative broadband figures for WISP FWA network connections in these two countries were 7% and 0%, respectively. Incidentally, almost one in three (32%) of premises in Wales could connect to a WISP FWA—the highest percentage across all four UK nations.
Bearing in mind the broadband coverage estimates provided by FWA providers, it is estimated that there are still around 80,000 UK premises that do not have access to a decent broadband service from a fixed network or an FWA network at the beginning of 2022.
UK broadband connection statistics
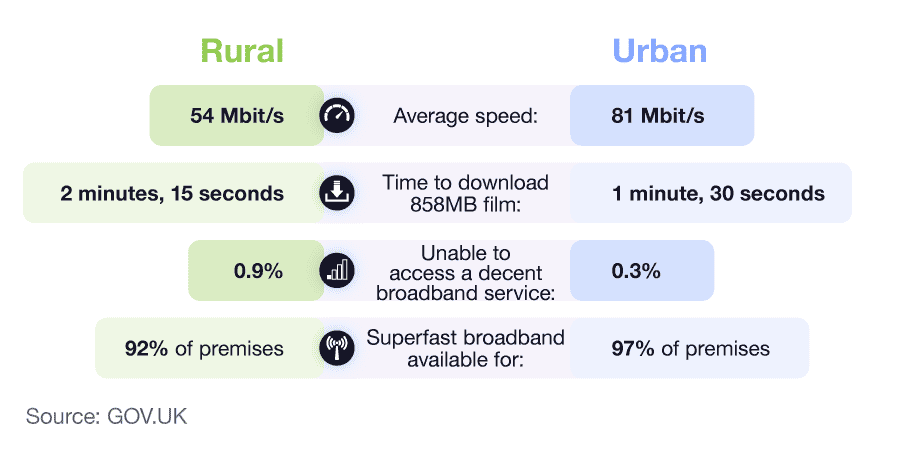
UK urban vs rural broadband statistics
According to UK broadband connection statistics, there is a notable difference between urban and rural connectivity across the country. Average UK broadband speeds in UK rural areas tend to be considerably slower than in urban areas.
As of March 2022, this gap has subsequently widened, with median peak-time download speeds of 39.4Mbps in rural areas and 62.1Mbps in urban areas of the UK—a 58% difference. In 2021, this figure was just 42%.
A breakdown of UK broadband connection statistics for urban and rural areas
Despite UK rural broadband speeds increasing since 2021, this rate was lower compared to urban areas, where growth in broadband availability and take-up of full fibre, superfast, ultrafast, and gigabit services are considerably greater.
According to UK broadband connection statistics, as of March 2022, 86% of UK urban broadband lines had an average peak-time download speed of at least 30Mbps, compared to just over two-thirds (67%) of rural areas.
Likewise, for those with speeds of less than 10Mbps, the corresponding figures were 14% for rural areas and just 1% for UK urban regions.
A breakdown of UK broadband connection statistics for rural and urban areas by speed and type of broadband connection
UK broadband connection statistics reveal that ADSL2+ connections constitute over 95% of all ADSL lines in the UK. As of March 2022, the median average 24-hour download speed in UK urban areas was 16.2Mbps—more than double the average for rural areas (6.0Mbps).
For FTTC broadband connections statistics, the difference between urban and rural download speeds is much smaller (50.5Mbps vs 50.0Mbps respectively). This is because there is less variation in the length of copper lines for the street cabinet to a user’s premises in urban vs rural areas.
Use our broadband postcode checker to explore broadband deals in your local area and compare the range of packages available to help find a product that is right for you.
UK broadband figures from Ofcom indicate a 22.7Mbps difference between median average peak-time download speeds for urban and rural areas in March 2022. The corresponding figure for March 2021 was just 15.6Mbps, when speeds were 52.7Mbps and 37.1Mbps for UK urban and rural areas, respectively.
March 2022 also revealed a 19% difference between urban and rural areas in terms of average evening peak-time speeds of 30Mbps or higher (86% vs 67% in favour of urban areas). This was 5% greater than the difference recorded in March 2021.
Conversely, the broadband report from Ofcom also highlights a 13% difference between March 2022 figures for broadband lines: the average peak-time download speed (of less than 10Mbps) was 3% lower than March 2021 stats, when respective urban and rural figures stood at 5% and 21%.
A breakdown of UK urban vs rural statistics by type of broadband connection 2022
As of 2022, more than two-thirds (76%) of UK urban premises were connected by a gigabit-capable broadband connection, compared to less than 40% for rural areas. By contrast, just 35% of rural areas had full fibre broadband connectivity, compared to 43% of respective urban areas.
UK broadband connection statistics reveal that superfast broadband was the most common type of high-speed broadband connection as of 2022. Nearly all (98%) of UK urban premises, and 86% of UK rural homes and businesses, were connected with this type of internet.
Great Britain broadband connection statistics by council 2023 (exclusive data)
Our exclusive data looked at broadband connectivity in councils across Great Britain. We looked at the percentage of premises with superfast and full fibre access in each council, as well as the median download and upload speeds, to give each council a connectivity score out of 10.
A breakdown of the best British councils for broadband connectivity
Council
Superfast broadband (% premises over 30 Mbps)
Full fibre broadband (% premises FTTP)
Median download speed (Mbps)
Median upload speed (Mbps)
Connectivity score
Kingston Upon Hull, City of
99.70%
99.70%
121.8
47.1
9.95
Worthing
99.80%
86.80%
90.5
20.2
9.88
Derby
99.60%
75.00%
72.8
18.7
9.52
Watford
99.70%
65.70%
90
19.8
9.48
Broxtowe
99.50%
76.40%
90.3
17.1
9.34
Milton Keynes
99.30%
92.60%
69.7
20.1
9.34
Epsom and Ewell
99.90%
79.40%
68.4
17.8
9.33
Slough
99.10%
70.80%
93.3
18.8
9.17
Coventry
98.90%
93.10%
73.4
18.6
9.05
Barking and Dagenham
99.20%
66.70%
77
18.3
9.03
(Source: money.co.uk via Thinkbroadband, ONS, and Norris Web)
Our data found that England far exceeded Scotland and Wales for broadband connectivity, with each of the top 10 councils based in England. This dominance becomes even more evident further down our list, with 21st-placed Edinburgh the highest-ranking non-English council.
Kingston Upon Hull was found to be the best council for broadband connectivity, with a median download speed of around 122Mbps and a median upload speed of 47.1Mbps—the best recorded figures in our study. Though the East Yorkshire council topped our list, the rest of the top 10 is made up entirely of councils based in Southern England and the Midlands.
The West-Sussex town of Worthing provided the highest score of any southern council, with third-placed Derby finishing the highest of any Midland areas. Though Worthing’s average upload speed of 20.2Mbps was the second-highest in the top 10, its upload speed was around 3Mbps lower than eighth-placed Slough.
Though every council in the top 10 achieved superfast broadband access rates of over 99%, the scores for full fibre access were more modest. Only three councils in our list were found to have full fibre access rates above 90%, with Watford’s score of 65.5% providing the lowest figure in the top 10.
A breakdown of the lowest-ranked British councils for broadband connectivity
Council
Superfast broadband (% premises over 30 Mbps)
Full fibre broadband (% premises FTTP)
Median download speed (Mbps)
Median upload speed (Mbps)
Connectivity score
Orkney Islands
66.30%
2.70%
15.3
1.3
0
Shetland Islands
75.70%
4.40%
21.8
5.2
0.05
Na h-Eileanan Siar
80.10%
5.90%
23.5
4.8
0.11
Argyll and Bute
85.70%
5.80%
26.7
5.8
0.2
Angus
89.00%
15.10%
21.8
4
0.4
Perth and Kinross
88.10%
12.60%
31.5
5.8
0.52
Copeland
95.80%
3.40%
27.8
5.4
0.6
Aberdeenshire
86.50%
24.40%
27.6
5.6
0.71
Allerdale
92.50%
6.90%
34.8
6.5
0.72
Richmondshire
87.20%
15.00%
32.9
7.2
0.72
(Source: money.co.uk via Thinkbroadband, ONS, and Norris Web)
In direct contrast to our top 10, 70% of our lowest ranking councils for broadband connectivity came from Scotland. With a full fibre access score of 2.7% and a median upload speed of just 1.3Mbps, the Orkney Islands were found to be the worst place for broadband connectivity in the UK.
The Orkney Islands’ median upload speeds were 75% lower than the Shetland Islands, which finished second-last, with a full-fibre access percentage of 4.4%.
Cumbria was responsible for two of the three non-Scottish councils in our bottom 10, with Copeland and Allerdale both recording median upload speeds below 6Mbps. The only other English council in our study was Richmond, which recorded a median download speed that was 73% slower than Kingston Upon Hull.
Though none of the councils in the bottom 10 had full fibre accessibility above 25%, the results for superfast broadband were more promising. Despite scoring low overall, all 10 councils in the bottom 10 had superfast accessibility percentages above 60%, with Copeland and Allerdale each recording scores above 90%.
Great Britain’s digital divide by council 2023 (exclusive data)
Our exclusive data looked at the extent of a digital divide among councils across Great Britain. This study looked at the percentage of premises with superfast and full fibre access in each council, as well as the median download and upload speeds, to give each place a broadband connectivity score out of 10.
Coupled with this was the percentage of employees working in a technological-based industry to generate an index score for economic and employment within each council.
These two index scores were combined to create an overall digital divide score out of 10. A value closer to 10 indicates a greater extent of digital divide within the council, while a score closer to zero suggests a lesser gap between residents of that local authority.
A breakdown of the largest and smallest digital divides by councils across Great Britain 2023 in terms of broadband accessibility, economy, and employment
Council
Superfast broadband (% premises over 30 Mbps)
Full fibre broadband (% premises FTTP)
Median download speed (Mbps)
Median upload speed (Mbps)
Percentage of people who work from home* (%)
Broadband score (/10)
Economic and employment score (/10)
Digital divide score (/10)
Argyll and Bute
85.70%
5.80%
26.7
5.8
18.80%
0.17
0.36
9.79
Highland
83.80%
31.90%
29.7
5.3
23.49%
0.96
1.06
9.29
Copeland
95.80%
3.40%
27.8
5.4
24.34%
0.58
1.34
9.26
Dumfries and Galloway
88.90%
24.40%
30.1
5.7
24.22%
0.79
1.31
9.21
Allerdale
92.50%
6.90%
34.8
6.5
25.03%
0.69
1.48
9.17
West Lindsey
89.60%
31.40%
37.7
7.7
23.76%
1.72
1.14
8.99
Moray
88.80%
47.30%
35.8
7.4
22.04%
2.17
0.81
8.96
Stirling
92.80%
55.40%
26.7
5.6
22.19%
2.15
0.86
8.95
Rochdale
98.80%
17.30%
37.1
9.1
19.99%
3.02
0.5
8.72
Neath Port Talbot
98.30%
17.60%
38
8.3
22.31%
2.5
0.95
8.72
(Source: money.co.uk via Thinkbroadband, ONS, and Norris Web)
*This percentage reflects anyone who works from home as part of their job.
According to broadband connection statistics from our study, Argyll and Bute ranks as the British council with the biggest digital divide. Generating a broadband index score of just 0.17 out of 10, just 5.8% of Argyll and Bute residents have access to full fibre broadband.
Coupled with this, less than a fifth (18.8%) of its population work from home, giving them an economic and employment score of 0.36, and thus making it the lowest scoring British council for this type of factor. Both these factors combined led to Argyll and Bute receiving an overall digital divide score of 9.79 out of 10.
Based on our broadband study, five of the top 10 most digitally divided councils in Great Britain are located in Scotland. Highland is placed second on the list with a score of 9.29 out of 10, with fourth-placed Dumfries and Gallway (9.21) the third Scottish council in the top five.
The West Cumbrian council of Copeland was found to be the most digitally divided council outside of Scotland. With a median upload speed of 5.4Mbps, and just 3.4% percent of the population with full fibre broadband access, Copeland finished third with a digital divide score of 9.26.
Copeland was joined in our top 10 by three more English entries, with Allerdale (9.17), West Lindsey (8.99), and Rochdale (8.72) finishing fifth, sixth, and ninth, respectively. Though Rochdale was found to score high for superfast broadband connectivity (98.8%), the Greater Manchester council had its score compromised due to its relatively low percentage of residents working from home (20%).
The most digitally divided council in Wales is Neath Port Talbot, which ranks as the tenth worst scoring British council overall. Just under a quarter of its population (22.21%) work from home and less than a fifth (17.6%) have access to full fibre broadband.
A breakdown of the smallest digital divide by councils in Great Britain 2023 in terms of broadband accessibility, economy, and employment
(Source: money.co.uk via Thinkbroadband, ONS, and Norris Web)
*This percentage reflects anyone who works from home at least partly for their job.
Broadband connection statistics from our Great Britain digital divide study reveal that Lambeth is the least digitally divided council in the country.
An impressive score of 0.66 out of 10 is attributed to:
Extremely high level of superfast broadband connectivity (98.9%).
Moderately fast download and upload speeds (58.6Mbps and 17.5Mbps, respectively).
Relatively high percentage of employees who work from home (53.8%) compared to other British councils.
Lambeth is followed in second place by fellow London boroughs Hackney and Wandsworth, which both received digital divide scores of 0.67. Nine of the top 10 least digitally divided cities are all based in the south of England, suggesting councils in northern England and the other parts of Britain are disproportionately affected by the digital divide.
Rugby is the only non-southern council in our top 10, with the West Midlands town finishing tenth thanks to its high scores for superfast connectivity (98.5%) and people working from home (52.5%).
Outside of England, the City of Edinburgh was found to be the least digitally divided Scottish council. With an impressive full fibre coverage rate of nearly 75%, and median upload speeds of 71Mbps, the Scottish capital finished 16th overall with a digital divide score of 1.56.
The Vale of Glamorgan was the best performing Welsh council, finishing joint-21st with a digital divide score of 1.73.
UK broadband outage statistics
Broadband outage statistics across the UK
According to research by Uswitch, 11 million customers experienced broadband outages of three hours or more between 2021 and 2022. With more than 50% of the UK’s workforce still working from home in some capacity, this means significant disruption for UK employees and businesses.
The financial implications of this are estimated to be around £1.3 billion, highlighting the ever-growing importance of having a stable broadband connection in your home.
A breakdown of broadband outage statistics in the UK by major city
According to Uswitch broadband outage statistics, Nottingham was the UK city with the highest average downtime between the summers of 2021 and 2022.
Broadband customers here experienced on average more than 70 hours of downtime within the 12-month period. This is followed by Southampton, with almost 46 hours, then Manchester and Bristol—both with more than 38 hours of broadband connection problems across the year.
The impact of storms on UK broadband outages
Between 2021 and 2022, the UK was hit by a number of severe storms, which had a significant impact on communication services. In November 2021, the gale force winds of Storm Arwen reached 100mph, causing complete power outages for almost one million customers across the UK. 40,000 were without supply for more than three days, and nearly 4,000 were cut off for over a week.
Storm Eunice in February 2022, also caused record power outages over a 24-hour period, affecting over 1.4 million UK households.
These storms caused considerable damage to Openreach’s overground network, destroying more than 650 poles across the country, with South Wales, the South of England, and East Anglia affected the most.
The loss of power lines created the majority of disruption for UK broadband customers, impacting large providers as well as small-scale fibre networks. The impact was mostly felt in rural areas, due to the prevalence of overhead power lines as opposed to urban areas which are routinely buried underground.
During Storm Arwen in late 2021, over 1,500 of Openreach’s exchange sites were running on back-up generators, and fibre street cabinets were also running on reserve batteries. These can typically last for four hours, yet due to the prolonged power outages in some areas, this also resulted in many fibre street cabinets losing power supply.
A breakdown of monthly reported incidents of mobile and fixed broadband outages across the UK
UK mobile phone statistics relating to outages indicate over 1,200 incidents were logged with Ofcom throughout 2022—an increase of 761 since 2021.
The number of fixed-network incidents rose from 426 in 2021 to 545 in 2022, and was broadly in line with the previous year-on-year variability. However, the number of mobile network incidents more than doubled, from 335 to 736 between 2021-22.
The average number of monthly reported incidents in 2022 stood at 95, compared to just 62 in 2021. The winter storms of 2021-22 had a significant impact on this, particularly during December-March when reported incidents peaked at 147 incidents.
Conversely, this was followed by a significant drop of reported outages in April 2022, when figures almost halved from the previous month to just 61.
UK broadband usage statistics by age
Age of internet users in the UK vs the world
In the UK in 2020, 92.1% of the population aged 16 and over used the internet. As expected, this number has continued to grow over time, increasing from 79.4% a decade earlier—a rise of 16%. By 2021, this figure had risen to 94% of UK households.
A breakdown of UK broadband usage statistics by age group
As of 2021, 6% of UK adults do not have access to the internet at home, and this figure increases with age. A fifth (20%) of those aged 65+ do not have domestic internet access, compared to just 1% of 18-34-year-olds.
Those aged 65+ are also most likely to have internet access but not use it (7%), compared to a UK average of 2%. Less than three-quarters (73%) of those aged 65+ have internet access at home and use it—the only age group in Ofcom’s study to not record a figure of 96% or above for this category.
A breakdown of internet users in the UK by age group over time (2011-20)
Over the last 10 years, 16-to-24-year-olds used the internet the most, except for 2019 when 25-to-34-year-olds finished highest with 0.2% more users. This was short-lived, though, as 16-to-24-year-olds regained the top spot. As of 2020, the largest proportion of internet users came from the 16-24 and 25-35 age groups, with a share of 99.5% each.
Internet connections in households with one adult aged 65 years and over have increased since 2019 to 80%, however, these households still have the lowest proportion of internet connections overall.
UK internet user statistics by socio-economic group
AB
C1
C2
DE
No internet access at home
2%
3%
5%
14%
Have access at home and go online
97%
96%
91%
82%
Have access at home, but do not use it
1%
1%
4%
3%
(Source: Ofcom)
UK broadband usage statistics indicate that those in higher socio-economic groups (such as AB and C1) tend to have a higher percentage of access to the internet at home, compared to those in the lower socio-economic groups (such as C2 and DE).
Around one in seven (14%) of those in the lowest group (DE) have no internet access at home, compared to just 2% and 3% for AB and C1, respectively. By contrast, 82% of those in the DE group have access at home and go online, compared to 97% for those in the wealthiest group (AB).
UK internet user statistics by different parts of the UK
England
Scotland
Wales
Northern Ireland
No internet access at home
6%
7%
9%
1%
Have access at home and go online
92%
81%
90%
95%
Have access at home, but do not use it
2%
1%
1%
3%
(Source: Ofcom)
The spread of internet users across the UK is unevenly distributed. UK broadband usage statistics from Ofcom indicate that, as of June 2022, 9% of people in Wales still have no internet access at home, compared to just 1% of those in Northern Ireland. Comparable broadband statistics for England and Scotland stand at 6% and 7%, respectively.
Northern Ireland is very much leading the way with 95% of people connected to the internet and regularly using the internet. By contrast, only 81% of Scottish inhabitants can boast the same fact.
Average UK daily internet usage statistics by age
According to UK broadband usage statistics from Ofcom’s Online Nations report (2022), the average UK adult spends just under four hours a day online. This figure is highest among the younger age groups, with those between 15 and 24 years old spending more than five hours a day (on average) using the internet.
Incidentally, those aged 55+ spend the least amount of time online per day, at just under three hours on average.
A breakdown of average UK daily internet usage statistics by age group
Average UK daily internet usage statistics by nation
Across all four nations of the UK, residents in Scotland spent the longest time each day online, averaging four hours 18 minutes. This is followed by England (at just under four hours per person) and Wales (three hours, 43 minutes) for the average resident.
A breakdown of UK daily internet usage statistics by country
England
Scotland
Wales
Northern Ireland
Average daily time spent online (hours: mins)
03:59
04:18
03:43
03:25
(Source: Ofcom)
Those living in Northern Ireland spend the least amount of time online each day on average, at three hours, 25 minutes per person.
Global internet user statistics
In 2021, just over a third of internet users were aged between 25 and 34 years old, making up the largest share of online users around the globe. Those aged between 18 and 24 years old contribute just under a quarter of online users worldwide, and 35 to 44-year-olds take up almost 19%.
The global digital population aged 65 or older represented approximately 5.5% of all internet users worldwide.
A breakdown of internet users worldwide by age group (2021)
On a global scale, almost two-thirds (63%) of the world’s population had access to the internet in April 2022.
Advancements in technology, along with the fast-paced development of telecommunication networks and infrastructure around the globe, have directly impacted internet penetration globally.
As a result, the number of internet users has increased since 2005, from 1.02 billion to an estimated 4.9 billion in 2021 – up three million from the year before (4.6 billion).
A breakdown of internet users by country (2023)
According to an internet user statistics report, there were around five billion people on the internet, as of January 2023.
China ranked as the country with the most internet users worldwide. With more than a billion internet users, this was more than triple the amount of third-placed USA with 307 million, and almost double that of India in second (692 million).
Despite China having by far the most internet users, its overall percentage of users (72%) was considerably lower than the United States and United Kingdom, who recorded percentages of 91% and 96%, respectively. Similarly, though India had the fourth highest number of internet users (around 692 million), this represented less than half of their overall population (43%).
With approximately 66 million internet users, the UK has the sixteenth highest number of internet users—six million more than France in 18th.
A breakdown of global internet penetration rate by region (April 2022)
Broadband penetration statistics reveal that, as of April 2022, Northern Europe had the highest internet penetration rate, with 98% of the population having access to the internet. Western Europe followed closely behind, with 94%.
Asia has the largest internet user base, with an estimated 2.7 billion internet users hailing from the region (this can be explained by its global population share). East Asia contributed the majority with an online penetration rate of close to 73% as of April 2022—just above the global average of 63%. Despite this, Asia is far from being a leader in regard to online penetration.
Fixed broadband internet subscriptions around the world (2021)
Global broadband penetration statistics show that almost one in three households have access to the internet via a fixed broadband connection. When broken down by region, however, Europe leads the way. Over 86% of European households have a fixed Internet connection, followed in second place by The Americas, with almost 80%.
The Commonwealth of Independent States (CIS) represents those countries formed through the dissolution of the Soviet Union. Just over three-quarters of these households have a fixed Internet connection, compared to almost 72% of those located in Asia and the Pacific.
The Arab States refer to the 22 Arab nations, who are members of the Arab League, and span across North Africa and the Middle East. Just over half of these households (56%) have access to the internet via fixed broadband, which is below the global average of 65.79%.
Less than 3% of African households have access to a fixed broadband internet connection, which highlights the infrastructural chasm between the developed and the developing parts of our world.
Despite this, it's worth noting that the number of households with a fixed broadband connection in the Arab States and Africa could be significantly lower than in other regions because they rely on other types of broadband to access the internet, such as mobile broadband or satellite.
UK broadband speed statistics
Choosing a broadband package that is right for you will largely depend on your budget, what you intend to use your internet for, and the broadband speed you require to complete those activities.
Uswitch classifies* broadband speeds into the following four main categories:
Standard broadband: Uses ADSL technology to provide average download speeds of around 10-11Mbps.
Superfast broadband: Uses fibre-optic cables to deliver a range of speeds, from 30-100Mbps.
Ultrafast broadband: Delivers speeds between 100-1,000Mbps.
Gigabit broadband: Providing internet speeds of 1,000Mbps (1Gbps) and above.
The UK Government criteria for a “decent” broadband service is generally described as having a download speed of at least 10 Mbps and an upload speed of at least 1Mbps. This is what you usually get with a standard broadband package, and enables you to carry out tasks like browsing the internet, online shopping, and sending emails.
*This is based on what broadband providers refer to in their products.
Compare 100Mbps broadband deals
Find broadband deals with 100Mbps speeds and faster in your area.
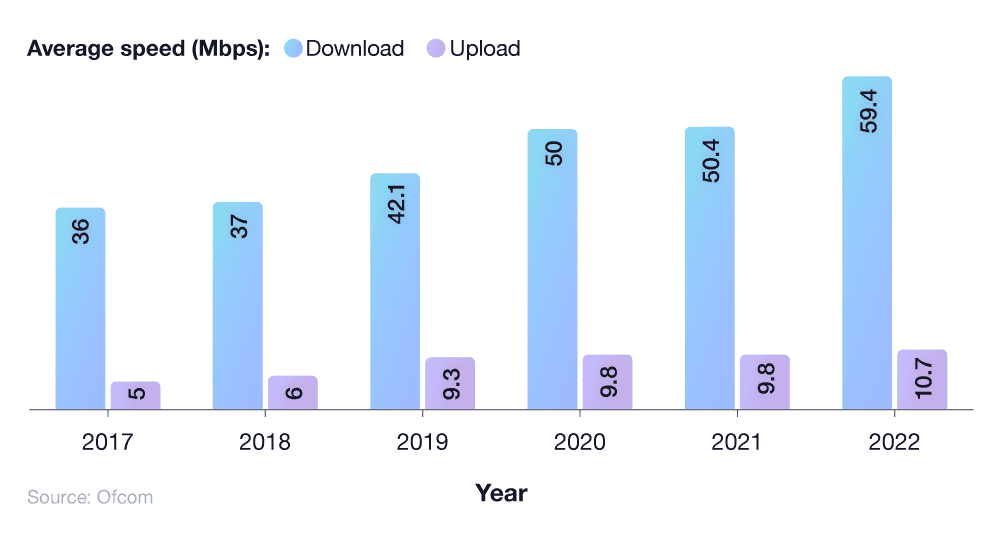
As of March 2021, the median average internet speed in the UK was 50.4Mbps. This is a sharp increase of 40% from five years earlier, when the average was just 36Mbps. By March 2022, this had risen to 59.4Mbps—a 9Mbps (18%) increase on the previous year, as people upgraded to faster broadband services across the UK.
UK broadband speed statistics reveal that more than nine out of every 10 UK households with internet now opt for a superfast package, with advertised download speeds of 30Mbps or higher. As of March 2022, this figure stood at 91%, with 8% choosing ultrafast broadband packages (average advertised speeds of at least 300Mbps).
A breakdown of average UK broadband speeds over time (2017-2022)
UK average download speeds by time of day
UK average download speeds tend to slow during busy periods when broadband networks suffer the effects of—what’s known as—contention. In plain terms, this means competition for resources.
Across all connections in March 2022, the average UK daily minimum speed (52.9Mbps) was around 86% of the average maximum speed (61.0Mbps). This was a 6.7Mbps rise in the average minimum speed, and a 9.9Mbps increase for the average maximum speed, in the UK compared to March 2021.
A breakdown of median average UK broadband speeds by time of day
UK broadband speed statistics reveal that, as of March 2022, the average 24-hour speed stood at 59.4Mbps for all connections, yet only 12.8Mbps for those between 10-30Mbps advertised speed. This was contrasted by average 24-hour speeds of almost 64Mbps for connection types with 30Mbps or higher.
Ofcom research shows that across all connections, the average 8-10pm peak-time speed (57.3Mbps) was 94% of the average maximum speed, compared to 88% for fibre and cable lines with advertised speeds of 30Mbps or more, and 83% for lines between 10-30Mbps.
Fixed broadband speeds vs reported internet speeds
Interested in finding out the difference between fixed broadband package speeds and the reported internet speeds, Uswitch analysed Ofcom fixed broadband performance data from homes across the UK.
We obtained data on the region, internet service provider (ISP), broadband connection, and peak recorded download speeds from over 3,300 homes with fixed broadband. From this, we found the listed average download speeds for broadband connections in each home using each ISP website.
The percentage difference between the listed ISP broadband download speeds versus the connection’s reported peak download speed was then calculated for each ISP, broadband package, and UK region.
A breakdown of fixed broadband speeds vs reported internet speed statistics across various UK internet service providers (ISPs)
Internet service provider
Average download speed (%)
Virgin
97.58
Zen
90.67
BT
88.74
Plusnet
87.72
EE
86.09
Sky
83.98
Vodafone
83.74
TalkTalk
81.39
(Source:Uswitch)
Virgin had the highest average download speed of all internet service providers (ISPs) analysed, with a difference of 97.58%. The only other ISP with an average download speed of 90% or more is Zen, with 90.67%. Comparatively, TalkTalk’s average download speed is just 81.39%.
Fixed broadband package download speeds vs reported internet speeds across various ISP broadband packages (2022)
ISP broadband connections
Package download speed (Mbps)
Reported download speed average (Mbps)
BT 160 FTTP
150
145.83
BT 38 FTTC
36
26.82
BT 52 FTTC
50
43.18
BT 76 FTTC
74
62.95
BT 76 FTTP
74
73.8
EE 38 FTTC
36
32.2
EE 76 FTTC
74
61.72
Plusnet 38 FTTC
36
29.42
Plusnet 76 FTTC
66
60.61
Sky 38 FTTC
36
29.74
TalkTalk 38 FTTC
38
32.23
TalkTalk 76 FTTC
80
62.26
Virgin 100 Cable
108
109.47
Virgin 1000 Cable
1130
953.4
Virgin 200 Cable
213
208.58
Virgin 350 Cable
362
374.69
Virgin 500 Cable
516
540.35
Vodafone 76 FTTC
73
60.17
(Source: Uswitch)
We found that three out of five broadband connections from Virgin Media had a higher average download speed than stated in their package. Virgin’s M500 cable connection lists its package speed as 516Mbps, but the average download speed reported via Ookla reaches 540.35Mbps.
A similar story can be said for BT, with its broadband download speeds close to those listed in its package details. However, the BT 38 Superfast connection is reportedly 10 Mbps less than stated in the package (36Mbps vs 26.82Mbps).
On the other end of the spectrum, TalkTalk has the worst package speed vs reported internet speed, with their 38 FTTC and 76 FTTC packages both failing to reach the download speeds consumers pay for.
A breakdown of UK average download speed of fixed broadband packages (2021
According to UK average download speed statistics from our study, Virgin 100, 350, and 500 cable broadband packages each outperformed their advertised download speeds when it came to reported download speed figures. Virgin’s 500 cable broambpsedband advertises speeds of 516Mbps, yet reported download speed stats in 2021 indicate customers were receiving nearer 540 Mbps on average.
Our findings indicate that the vast majority of UK broadband providers were delivering somewhere between 80-90% of advertised broadband speeds to customers in 2021. BT’s 160 and 76 FTTP services both achieved scores in the high 90s for their reported download speeds as a percentage of their advertised speeds (145.83Mbps and 73.9Mbps, respectively).
At the other end of the scale, BT’s 38 FTTC package was the joint-lowest package in our study for advertised download speeds at 36Mbps, yet achieved less than 75% of this when it came to reported download speed figures. This was followed closely by Talk Talk’s 76 FTTC service, reporting almost 78% of its advertised 80Mbps package.
A breakdown of UK average download speed by region
Region
Average download speed (%)
London
93.6
Yorkshire & Humberside
90.81
North East
90.39
South West
90.17
South East
89.4
Northern Ireland
88.88
East Midlands
88.33
West Midlands
88.2
Wales
88.02
East
86.1
North West
86.08
Scotland
85.11
(Source: Uswitch)
England’s capital, London, has the fastest average download speed of all regions in the UK, with an average download speed of 93.6%. Yorkshire and the Humber, the North East and South West follow behind with average download speeds in the 90% range.
Scotland, on the other hand, fares the worst of all, with an average download speed of 85.11%—a difference of 8% from London at the top of the table.
Internet download speed statistics by UK local authority
Which local authority has the fastest and slowest download speeds in the UK?
To find out, we utilised iOS and Android Speedtest data from Q2 2022 via Ookla. We then applied this to local authority boundaries, as per the Office of National Statistics, to highlight the average download, upload and latency performance speeds for each local authority.
A breakdown of the UK local authorities with the fastest and slowest download speeds
Southampton has the fastest average download speed, clocking in at 166.677Mbps. This was closely followed by Stockon-on-Tees, with a download speed of 166.356Mbps.
Third place goes to Newham with a download speed of 157.795Mbps, fourth to Coventry (157.652Mbps), and fifth to Peterborough (157.509Mbps).
On the other end of the scale, the local authority with the slowest download speed is the Isles of Scilly, with an average download speed of 24.536Mbps—142.141Mbps slower than first place Southampton.
A breakdown of the UK local authorities with the fastest and slowest upload speeds
The London Borough of Tower Hamlets takes the crown for the fastest average upload speed, measuring an impressive 107.851Mbps. Tower Hamlets is followed closely behind by Milton Keynes, with an average speed of 105.531 Mbps.
Southampton, which has the fastest average download speed, also has the third-fastest upload speed, clocking in at an average of 102.859 Mbps.
On the other end of the scale, as well as having the slowest download speed in the UK, the Isles of Scilly has the slowest upload speed too. The local authority racks up an average upload speed of just 6.555 Mbps, which is almost 16 times slower than Tower Hamlets in first place.
Are you suffering from slow broadband speeds? Check out our guide to find out why your internet is so slow and how to fix the issue.
A breakdown of the UK local authorities with the fastest and slowest latency speeds
Online gaming statistics reveal that the best broadband for online gaming will provide a response time of less than 100 milliseconds (ms) in order to provide a good experience, (although some online gaming apps require 50ms).
Our research identified that the London Borough of Tower Hamlets has the best average latency speed, measuring just 9.554 ms. Second place goes to Newham, another London Borough, with an equally impressive latency speed of 9.846 ms.
Latency definition: Latency refers to the delay before a transfer of data begins. A connection with low latency often feels more responsive for simple tasks like internet browsing.
Residents in the Outer Hebrides in Scotland don’t have it quite so good, clocking an average latency speed of 58.874 ms. This is still reasonable and would allow residents to carry out simple tasks online, however, there is a considerable difference of 49.32 ms from Tower Hamlets in first place.
Which UK street has the fastest and slowest broadband speed?
A breakdown of the UK streets with the slowest and fastest broadband (2021)
As of December 2021, the street with the slowest broadband speed was Wistaston Road in Crewe, where residents have an average broadband speed of just 0.25Mbps. At this speed, according to our download time calculator, it would take residents over two-and-a-half days to download a two-hour HD film and almost 24 hours to download a 45-minute HD TV show.
Check out our latest TV and broadband deals to help find a product that is right for you.
By contrast, residents living on Britain’s fastest street for broadband, Haul Fryn in Birchgrove, Swansea, experience an average speed of 882.03Mbps. This means Wistaston Road is a staggering 3,567 times slower than Haul Fryn, and residents would only have to wait about a minute to download the same film or a mere 24 seconds to download the same show.
UK mobile broadband statistics
With over 20% of new mobile devices capable of accessing the 5G broadband network, mobile network operators are beginning to extend coverage from large cities to smaller towns and urbanisations, whilst also improving 4G connectivity across the UK.
A breakdown of 4G and 5G mobile broadband statistics across different countries of the UK
5G broadband coverage statistics across the UK
In terms of full 5G coverage across the UK, England has the strongest connections of all four UK nations. Outside of premises, 5G signal is available across 42-61% of the nation—the only country within the UK that exceeds the minimum average coverage figures for the UK of 39-58%.
UK broadband stats reveal that 5G coverage in Northern Ireland is significantly behind that of England, with only 14-26% of the nation covered near premises. Similarly, Wales also lags behind the UK average, with 5G coverage only extending to somewhere between 10-46% of the country.
5G coverage statistics per operator
5G across the UK is covered by multiple MNOs, or Mobile Network Operators. BT and EE, Three, Virgin Media and O2, and Vodafone offer some of the UK’s fastest mobile coverage on the market.
A breakdown of 5G coverage statistics by operator and their percentage coverage for outside UK premises
5G network provider
% coverage outside UK premises
Three
58%
BT and EE
55%
Vodafone
42%
Virgin Media and O2
38%
(Source: Ofcom)
Of all MNOs, Three offers the widest 5G coverage, with 58% of UK outdoor premises covered by a 5G signal. In a close second is BT and EE, working together for their 5G offering, covering over half (55%) of outdoor premises confidently—this represents just 3% less than that of Three. Virgin Media and O2’s coupling yields the least coverage across the UK, with 38% of outdoor premises having access to a consistent 5G signal.
In terms of the UK’s four nations, England has 42-61% 5G coverage outside premises, whereas Scotland has only 29-51%. Comparatively, Wales and Northern Ireland lag behind the other two nations, with 10-46% and 14-26% 5G coverage, respectively.
4G broadband coverage statistics across the UK
Across all four nations in the UK, 4G coverage is far more widespread than that of its more modern counterpart, 5G. The average 4G coverage for the UK is above 99%, equal to the highest ever recorded across the UK in 2021.
4G coverage across England reflects that of the entire UK (99% and above). However, that applies to ‘outside premises’, meaning signal availability in areas such as villages, towns, and cities. 4G coverage geographically across the nation is somewhere between 92-94%, meaning that between 6-8% of the landmass is currently not covered by a consistent 4G signal. Only 2% of England has zero 4G signal, and that figure has remained stable from the 2% recorded in 2021.
In Scotland, 4G outside premises is between 97-99% coverage, almost rivalling that of the UK’s average. However, in terms of full-geographic coverage, they only have 57-75% of their landmass covered by 4G, meaning large swathes of the nation remain without consistent 4G broadband. The 4G signal figure has, however, improved somewhat since recording 57-73% 4G coverage in 2021. 17% of the country has zero access to 4G, an improvement of 1% over data from 2021.
Corresponding UK broadband stats show that Wales offers similar 4G coverage to Scotland, in terms of 4G outside premises (96-99%). With regards to 4G coverage by geography, Wales has 73-85% of their landmass covered—almost 20% more compared to Scotland. However, 10% of Wales has zero access to 4G, 2% more than the UK’s average of 8%.
Northern Ireland’s 4G coverage is 98-99% for outside premises, representing the second-best 4G coverage statistics in the UK. In terms of geographic coverage, the country recorded 88-92% in 2022–-again, a recorded figure that is higher than all other UK nations apart from England. Only 3% of NI’s landmass has zero access to 4G, markedly better than Wales and Scotland, and 5% better than the UK average.
A breakdown of 4G coverage statistics per operator (2022)
4G network provider
% coverage across geographical landmass (2022)
% improvement from 2021
BT and EE
87%
0.01
Virgin Media and O2
82%
0.02
Vodafone
82%
0%
Three
80%
0.01
(Source: Ofcom)
UK broadband statistics indicate BT and EE’s 4G coverage has the widest reach amongst network operators, with 87% of the UK’s entire landmass covered by their signal. This is a small improvement of 1% since 2021.
In joint-second is Virgin Media and O2, alongside Vodafone. They each have 82% of the UK’s landmass covered by 4G signal, although in the case of VMO2, the 82% figure is a 2% increase over 2021 figures, compared to 0% increase for Vodafone.
5G’s largest provider, Three, has the smallest amount of 4G signal coverage in the UK as of 2022, with 80% of the landmass covered. This represents a small improvement of 1% compared to 4G coverage statistics for 2021.
Rural vs urban 4G coverage statistics across the UK
BT and EE, Virgin Media and O2, Three, and Vodafone all claim 100% 4G coverage of UK urban areas, exactly the same as offered in 2021.
However, in rural parts of the UK, 4G coverage doesn’t exceed 84%. BT and EE claim that figure, covering the largest geographical area with signal—a 2% improvement on their 2021 figures.
Virgin Media and O2 also improved between 2021-22, raising their rural UK coverage figure to 80% (a 2% increase from 2021).
Neither Three nor Vodafone improved in 2022 on their 2021 rural coverage statistics, with Vodafone achieving 80% and Three achieving only 76%.
The average cost of broadband UK
Pricing for broadband services from the UK’s independent full-fibre network operators can be lower than those from established providers—an important factor when it comes to potentially switching your broadband.
According to Uswitch’s global broadband index, the UK ranks as the fifth most affordable country in the world for broadband, as a percentage of income per capita. With an average of £26.39 per month, this equates to around 1.16% of the average citizen’s monthly earnings—a statistic only bettered by Israel (0.78%), Lithuania (0.97%), France (1.14%), and Luxembourg (1.15%).
Data from Ofcom shows full-fibre broadband pricing for selected independent providers, as well as BT using the Openreach full-fibre network and Virgin Media (which uses DOCSIS 3.1 cable and full-fibre technology) to provide ultrafast services. New operators (such as Community Fibre, Hyperoptic, and G.Network) have also entered the broadband market in 2022, resulting in more choice for UK broadband customers.
On top of the monthly price, some broadband providers charge fees for activation, set-up, or installation, which is dependent on the provider and contract length. Broadband deals with no upfront costs are available on the market, but you will need to check this before committing to a package.
Want to try and avoid installation costs? Check out our guide on how to self-install your broadband as a potential method of saving some money.
Broadband installation cost also depends on whether the broadband provider is registered to the Government’s Gigabit Broadband Voucher Scheme (GBVS). The scheme, which has been running since 2021, can provide up to £210 million worth of funding to help homes and businesses cover the costs of installing gigabit broadband.
Households eligible for this can claim vouchers worth up to £1,500 through a registered broadband provider, and businesses can claim up to £3,500.
A breakdown of UK broadband cost statistics by broadband provider and package
Knowing when to switch your broadband is no easy answer. Average UK broadband costs vary considerably between providers and the type of broadband you purchase. Some providers will offer promotional prices, as a way of enticing new customers to join, with the list price returning to similar prices offered by competitors after a given period of time.
The average monthly broadband cost for 30Mbps and 50Mbps packages ranges between £20-£28, compared to £22-£40 for 100Mbps and 150Mbps deals.
It’s also worth noting that some UK broadband providers will charge installation costs, have varying lengths of contract, and are liable to mid-contract price increases in 2023. Therefore, it’s advisable to fully check the terms and conditions before committing to a broadband package.
Those opting for 300Mbps and 350Mbps advertised download speeds can expect to pay anything between £20 a month with Gigaclear up to £56 per month for Virgin Media. Should you desire some of the fastest broadband speeds on the market (900Mbps and 1Gbps), average monthly broadband costs will set you back somewhere between £25 (Toob) and £80 (Trooli, Jurassic Fibre, and County Broadband).
Saving money on your broadband bill is a high priority for many UK households, particularly during the current cost of living crisis. There are also cheap broadband deals for low income families in the UK, such as Community Fibre, to help ensure all households across the country have the opportunity to access a decent domestic broadband service.
Recent UK broadband stats reveal that, as of August 2022, only 3.2% of UK households on Universal Credit decided to take advantage of social tariffs offered by broadband providers. During this time, around 4.2 million UK households were receiving some form of Universal Credit, and yet only 136,000 households moved onto a social broadband tariff. This is an increase of almost 150% from February 2022, when the social tariff takeup figure stood at just 55,000 households.
Broadband providers and their social tariffs
ONS research suggests that as many as three in 10 households struggled to pay for their communications bills in July 2022. Furthermore, up to seven in 10 eligible customers aren’t aware that social tariffs exist.
Below is a list of current social broadband packages available in the UK in 2023, along with their associated monthly costs, average advertised speed, and eligibility criteria.
A breakdown of current social tariff broadband packages available in the UK 2023
Package
Price (per month)
Average speed
You could qualify if you receive...
4th Utility Social Tariff
£13.99
30Mbps
Open to all
Air Broadband Air Support
£20
100Mbps
Various benefits (in and out of work)*
BT Home Essentials
£15
Around 36Mbps
Various benefits (in and out of work)*
BT Home Essentials 2
£20
Around 67Mbps
Various benefits (in and out of work)*
Community Fibre Essential
£12.50
20Mbps
Open to all
Country Connect Social Tariff
£15
50Mbps
Various benefits (in and out of work)*
EE Basics
£12
Up to 25Mbps
Various benefits (in and out of work)*
G.Network Essential Fibre Broadband
£15
50Mbps
Various benefits (in and out of work)*
Grayshott Gigabit Connect
£20
100Mbps
Various benefits (in and out of work)*
Hyperoptic Fair Fibre 50
£15
50Mbps
Various benefits (in and out of work)*
Hyperoptic Fair Fibre 150
£20
150Mbps
Various benefits (in and out of work)*
KCOM Full Fibre Flex
£14.99
30Mbps
Various benefits (in and out of work)*
Lightning Fibre Social Tariff
£15
50Mbps
Various benefits (in and out of work)*
Lothian Broadband Social Tariff
£19.99
100Mbps
Open to all
NOW Broadband Basics
£20
36Mbps
Universal Credit or Pension Credit
Sky Broadband Basics
£20
36Mbps
Universal Credit or Pension Credit
SMARTY Social Tariff
£12
5G where available
Various benefits (in and out of work)*
Virgin Media Essential Broadband
£12.50
15Mbps
Universal Credit
Virgin Media Essential Broadband Plus
£20
54Mbps
Universal Credit
Vodafone Essentials Broadband
£12
38Mbps
Various benefits (in and out of work)*
VOXI For Now
£10
5G where available
Various benefits (in and out of work)*
Wildanet Helping Hand Social Tariff
£20
30-100Mbps
Universal Credit
WightFibre Essential Broadband
£16.50
100Mbps
Universal Credit or Pension Credit
(Source: Ofcom)
*Each company has its own list of eligible benefits, but all include Universal Credit. Other benefits may include Pension Credit, Job Seekers’ Allowance, Employment and Support Allowance, Income Support, Personal Independence Payment, Attendance Allowance, and Care Leavers’ Support.
Early Termination Charges (ETCs)
Ofcom noted that TalkTalk, Shell, EE, Plusnet, Vodafone, O2, and Three have all not committed to introducing a social tariff for home broadband.
Certain broadband providers may apply Early Termination Charges (ETCs) if the current broadband contract is ended prematurely by the customer. February 2022 data from Ofcom shows the potential value of social tariffs equate to £144 per year per customer. However, ETC’s are valued at between £10-£14 per month, so if your contract has 6 months left, then you are liable to pay between £60-£84 in order to terminate your social tariff broadband deal early.
If you fit the criteria for a social tariff and therefore decide to change provider, be aware that your current supplier may charge an ETC penalty for breaking the contract early. Always consider the terms and conditions of your broadband contract before making the move.
UK broadband customer satisfaction statistics
As well as having the most customers across the nation, UK broadband customer satisfaction statistics also suggest that BT also has the highest overall customer satisfaction rate in the broadband industry.
Almost nine in every 10 (88%) of broadband subscribers approved of BT’s services, far better than the industry average of 83%.
With a score of 83%, BT also exceeds the industry average speed satisfaction rate of 80%. More than half (55%) of customers were happy with the way BT dealt with complaints, beating Sky Broadband by 1%.
Visit our broadband awards page to find out which providers impressed with their services.
A breakdown of best broadband providers in the UK by customer feedback (2022)
Provider
Satisfaction with speed of service (average 80%)
Customers with a reason to complain (average 20%)
Overall satisfaction with complaint handling (average 50%)
Satisfaction with service overall (average 83%)
BT
83%
18%
55%
88%
EE
79%
17%
49%
85%
Sky
82%
16%
54%
84%
Plusnet
78%
20%
43%
79%
TalkTalk
73%
21%
43%
78%
Virgin Media
79%
23%
45%
78%
Vodafone
81%***
26%
45%
77%***
With streaming being a popular way to watch TV and listen to music, as well as working from home becoming the norm, reliable broadband is now a necessity for the majority of households across the UK.
But how accessible is broadband in the UK and beyond? We’ve collated the latest UK broadband statistics for 2023, covering broadband access, usage, speed, cost, and more.
Compare broadband deals to ensure you get the best broadband for your needs.
Broadband connection statistics
How many people access the internet in the UK?
Over the years, the share of households with access to a “decent” broadband connection has grown steadily.
Data from Ofcom’s latest Connected Nations Report discovered that 99.7% of households in the UK had access to a decent connection as of January 2022, up one per cent from the last report in September 2021.
What is decent broadband?
Decent broadband is described as having a download speed of at least 10 Mbit/s and an upload speed of at least 1 Mbit/s.
A breakdown of access to at least 10 Mbit/s services (2021-2022)
Access to at least 10Mbps services
May 2021
September 2021
January 2022
UK
98%
98%
99%
England
99%
99%
99%
Northern Ireland
95%
95%
96%
Scotland
97%
97%
97%
Wales
97%
97%
98%
Source: Ofcom
The number of properties (both residential and commercial) that cannot receive a decent broadband service from a fixed line stands at around 506,000 (2%), dropping from 650,000 in December 2021.
A breakdown of homes and businesses unable to access decent broadband services (2021-2022)
Unable to access 10Mbps
May 2021
September 2021
January 2022
UK
0.40%
0.40%
0.30%
England
0.30%
0.20%
0.20%
Northern Ireland
2%
2%
2%
Scotland
1%
1%
1%
Wales
1%
1%
0.70%
Source: Ofcom
What percentage of the UK has gigabit broadband?
The number of homes able to get gigabit-capable broadband continues to increase, with nearly 19.3 million homes (66% of all UK homes) now able to access these faster services — up from 13.7 million (47%) in December 2021.
This has, in part, been driven by the rollout of full-fibre broadband and Virgin Media O2 making its network entirely gigabit-capable.
A breakdown of access to gigabit-capable broadband services (2021-2022)
Access to gigabit-capable services
September 2022
January 2023
May 2023
UK
70%
73%
75%
England
71%
75%
76%
Northern Ireland
87%
90%
91%
Scotland
64%
68%
69%
Wales
52%
57%
60%
Source: Ofcom
What percentage of the UK has full fibre broadband?
Full fibre coverage continues to increase, with a third (33%) of homes having access to full fibre services at the beginning of 2022. As a result, full fibre coverage sits at just under 9.6 million, an increase from 8.2 million (28%) homes in December 2021.
This has been bolstered through deployments by larger fibre infrastructure operators, and supported by smaller providers up and down the UK that serve individual regions.
A breakdown of access to full fibre broadband (2021-2022)
Access to full fibre
May 2021
September 2021
January 2022
UK
24%
28%
33%
England
23%
27%
31%
Northern Ireland
67%
71%
79%
Scotland
23%
27%
32%
Wales
24%
27%
32%
Source: Ofcom
What percentage of the UK has superfast broadband?
Superfast broadband coverage continues to slowly grow — albeit at a reduced pace compared to gigabit and full fibre — with coverage remaining at 96% of all UK homes. This slow progress is likely due to the increased rollout of full fibre and gigabit-capable connections UK-wide.
A breakdown of access to superfast broadband services (2021-2022)
Access to superfast fibre
May 2021
September 2021
January 2022
UK
96%
96%
96%
England
96%
96%
97%
Northern Ireland
90%
91%
92%
Scotland
94%
94%
94%
Wales
94%
94%
95%
Source: Ofcom
What about fixed wireless access networks and wireless internet service providers?
Aside from gigabit, full fibre, and superfast, broadband services are also available from Fixed Wireless Access (FWA) networks provided via mobile networks, or through Wireless Internet Service Providers (WISPs).
Latest Ofcom data shows that FWA coverage from mobile networks is available to 94% of premises in the UK, and around 7% can receive a decent broadband service from a WISP.
A breakdown of access to fixed wireless (2021-2022)
Access to fixed WANs
May 2021
September 2021
January 2022
UK Mobile Network Operators
(MNO)
93%
94%
94%
UK Wireless Internet Service
Providers (WISP)
6%
7%
7%
Source: Ofcom
Bearing in mind the broadband coverage estimates provided by FWA providers, it is estimated that there are still around 99,500 premises that do not have access to a decent broadband service from a fixed network or an FWA network at the beginning of 2022.
Rural broadband statistics
Understandably, average UK broadband speeds in rural areas tend to be considerably slower than those in urban areas. In 2020, the average speed in rural areas was 54 Mbit/s compared to 81 Mbit/s in urban areas.
This is because superfast broadband is less available in the countryside, and buildings are typically further away from cabinets, where long copper line connections cause slower performance.
Based on these speeds, a household with an average broadband speed in rural areas downloading a typical 858MB film (via On Demand) would take around 2 minutes and 15 seconds, compared to 1 minute and 30 seconds for those in urban areas. For a household with a decent download speed (10 Mbit/s average download speed), the download time jumps to 12 minutes.
In 2020, 0.9% of premises in rural areas could not access a decent broadband service (delivering an average download speed of 10 Mbit/s), compared with just 0.3 per cent of premises in urban areas
Urban vs rural broadband statistics
Broadband access statistics, by age
Age of internet users in the UK vs the world
UK
In the UK in 2020, 92.1% of the population aged 16 and over used the internet. As expected, this number has continued to grow over time, increasing from 79.4% a decade earlier—a rise of 16%.
Over the last 10 years, 16-to-24-year-olds used the internet the most, except for 2019 when 25-to-34-year-olds finished highest with 0.2% more users. This was short-lived, though, as 16-to-24-year-olds regained the top spot. As of 2020, the largest proportion of internet users came from the 16-24 and 25-35 age groups, with a share of 99.5% each.
Internet connections in households with one adult aged 65 years and over have increased since 2019 to 80%, however, these households still have the lowest proportion of internet connections overall.
A breakdown of internet users in the UK by age group (2020)
Worldwide
In 2021, just over a third of internet users were aged between 25 and 34 years old, making up the largest share of online users around the globe. 18 to 24-year-olds contribute just under a quarter of online users worldwide, and 35 to 44-year-olds take up almost 19%.
The global digital population aged 65 or older represented approximately 5.5% of all internet users worldwide.
A breakdown of internet users worldwide by age group (2021)
As of April 2022, Northern Europe had the highest internet penetration rate, with 98% of the population having access to the internet. Western Europe followed closely behind, with 94%.
Asia has the largest internet user base, with an estimated 2.7 billion internet users hailing from the region (this can be explained by its global population share). East Asia contributed the majority with an online penetration rate of close to 73% as of April 2022 — just above the global average of 63%. Despite this, Asia is far from being a leader in regard to online penetration.
Fixed broadband internet subscriptions around the world (2021)
Globally, almost one in three households have access to the internet via a fixed broadband connection. When broken down by region, however, Europe leads the way. Over 86% of European households have a fixed Internet connection, followed in second place by The Americas, with almost 80%.
The Commonwealth of Independent States (CIS) represent those countries formed through the dissolution of the Soviet Union. Just over three-quarters of these households have a fixed Internet connection, compared to almost 72% of those located in Asia and the Pacific.
The Arab States refer to the 22 Arab nations, who are members of the Arab League, and span across North Africa and the Middle East. Just over half of these households (56%) have access to the internet via fixed broadband, which is below the global average of 65.79%.
Less than 3% of African households have access to a fixed broadband Internet connection, which highlights the infrastructural chasm between the developed and the developing parts of our world.
Despite this, it's worth noting that the number of households with a fixed broadband connection in the Arab States and Africa could be significantly lower than in other regions because they rely on other types of broadband to access the internet, such as mobile broadband or satellite.
Broadband speed statistics
Uswitch classifies* broadband speeds into the following four main categories:
Standard broadband: Uses ADSL technology to provide average download speeds of around 10-11 Mbps.
Superfast broadband: Uses fibre-optic cables to deliver a range of speeds, from 30-100 Mbps.
Ultrafast broadband: Delivers speeds between 100-1000 Mbps.
Gigabit broadband: Providing internet speeds of 1000Mbps (1Gbps) and above.
The criteria for a “decent” broadband service is generally described as having a download speed of at least 10 Mbit/s and an upload speed of at least 1 Mbit/s. This is what you usually get with a standard broadband package, and enables you to carry out tasks like browsing the internet, online shopping, and sending emails.
*This is based on what broadband providers refer to in their products.
Average broadband connection speeds
As of 2021, the median average internet speed in the UK was 50.4 Mbps. This is a sharp increase of 40% from five years earlier, when the average was just 36 Mbps.
The increase has largely been driven by the increased rollout of ultrafast broadband and full fibre across the country, which delivers internet speeds of 100 Mbps and higher. A third (33%) of the UK can now access these connections, which explains why the average is faster than what most properties can actually get.
A breakdown of average broadband speed over the last five years (2017-2021)
Average download speeds by time of day
Average download speeds tend to slow during busy periods when broadband networks suffer the effects of—what’s known as—contention. In plain terms, this means competition for resources.
Across all connections, the average daily minimum speed (46.2 Mbit/s) was 90% of the average maximum speed (51.1 Mbit/s), while the average 8-10 pm peak-time speed (49.9 Mbit/s) was 98% of the average maximum.
Median average UK broadband speeds by time of day (Mbit/s, 2021)
Fixed broadband speeds vs reported internet speeds
Interested in finding out the difference between fixed broadband package speeds and the reported internet speeds, Uswitch analysed Ofcom fixed broadband performance data from homes across the UK. We obtained data on the region, internet service provider (ISP), broadband connection, and peak recorded download speeds from over 3,300 homes with fixed broadband. From this, we found the listed average download speeds for broadband connections in each home using each ISP website.
The percentage difference between the listed ISP broadband download speeds versus the connection’s reported peak download speed was then calculated for each ISP, broadband package, and UK region*.
Internet service providers
Virgin had the highest average download speed of all internet service providers analysed, with a difference of 97.58%. The only other ISP with an average download speed of 90% or more is Zen, with 90.67%. Comparatively, TalkTalk’s average download speed is just 81.39%.
Internet service provider
Average download speed (%)
Virgin
97.58
Zen
90.67
BT
88.74
Plusnet
87.72
EE
86.09
Sky
83.98
Vodafone
83.74
TalkTalk
81.39
Source: Uswitch
ISP broadband packages
We found that three out of five broadband connections from Virgin Media had a higher average download speed than stated in their package. Virgin’s M500 cable connection lists its package speed as 516 Mbit/s, but the average download speed reported via Ookla reaches 540.35 Mbit/s.
A similar story can be said for BT, with its broadband download speeds close to those listed in its package details. However, the BT 38 Superfast connection is reportedly 10 Mbit/s less than stated in the package (36 Mbit/s vs 26.82 Mbit/s).
On the other end of the spectrum, TalkTalk has the worst package speed vs reported internet speed, with their 38 FTTC and 76 FTTC packages both failing to reach the download speeds consumers pay for.
Fixed broadband package download speeds vs reported internet speeds (2022)
ISP broadband connections
Package download speed (Mbits/s)
Reported download speed average (Mbits/s)
BT
-
-
BT 160 FTTP
150
145.83
BT 38 FTTC
36
26.82
BT 52 FTTC
50
43.18
BT 76 FTTC
74
62.95
BT 76 FTTP
74
73.8
EE
-
-
EE 38 FTTC
36
32.2
EE 76 FTTC
74
61.72
Plusnet
-
-
Plusnet 38 FTTC
36
29.42
Plusnet 76 FTTC
66
60.61
Sky
-
-
Sky 38 FTTC
36
29.74
Talk Talk
-
-
TalkTalk 38 FTTC
38
32.23
TalkTalk 76 FTTC
80
62.26
Virgin
-
-
Virgin 100 Cable
108
109.47
Virgin 1000 Cable
1130
953.4
Virgin 200 Cable
213
208.58
Virgin 350 Cable
362
374.69
Virgin 500 Cable
516
540.35
Vodafone
-
-
Vodafone 76 FTTC
73
60.17
Source: Uswitch
Average download speed of fixed broadband packages (2021)
Regional breakdown
England’s capital, London, has the fastest average download speed of all regions in the UK, with an average download speed of 93.6%. Yorkshire and the Humber, the North East and South West follow behind with average download speeds in the 90% range.
Scotland, on the other hand, fares the worst of all, with an average download speed of 85.11% – a difference of 8% from London at the top of the table.
Region
Average download speed (%)
London
93.6
Yorkshire & Humberside
90.81
North East
90.39
South West
90.17
South East
89.4
Northern Ireland
88.88
East Midlands
88.33
West Midlands
88.2
Wales
88.02
East
86.1
North West
86.08
Scotland
85.11
Source: Uswitch
Internet speeds by local authority
Which local authority has the fastest and slowest download speeds in the UK? To find out, we utilised iOS and Android Speedtest data from Q2 2022 via Ookla. We then applied this to local authority boundaries, as per the Office of National Statistics, to highlight the average download, upload and latency performance speeds for each local authority**.
The local authorities with the fastest and slowest download speeds
Southampton has the fastest average download speed, clocking in at 166.677 Mbit/s. This was closely followed by Stockon-on-Tees, with a download speed of 166.356 Mbit/s.
Third place goes to Newham with a download speed of 157.795 Mbit/s, fourth to Coventry (157.652 Mbit/s), and fifth to Peterborough (157.509 Mbit/s).
On the other end of the scale, the local authority with the slowest download speed is the Isles of Scilly, with an average download speed of 24.536 Mbit/s—142.141 Mbit/s slower than first place Southampton.
The local authorities with the fastest and slowest average upload speeds
The London Borough of Tower Hamlets takes the crown for the fastest average upload speed, measuring an impressive 107.851 Mbit/s. Tower Hamlets is followed closely behind by Milton Keynes, with an average speed of 105.531 Mbit/s.
Southampton, which has the fastest average download speed, also has the third-fastest upload speed, clocking in at an average of 102.859 Mbit/s.
On the other end of the scale, as well as having the slowest download speed in the UK, the Isles of Scilly has the slowest upload speed too. The local authority racks up an average upload speed of just 6.555 Mbit/s, which is almost 16 times slower than Tower Hamlets in first place.
The local authorities with the fastest and slowest average latency
Latency definition: Latency refers to the delay before a transfer of data begins. A connection with low latency often feels more responsive for simple tasks like internet browsing.
Most online activities require a response time of less than 100 milliseconds (ms) to provide a good experience, although some online gaming apps require 50 ms.
Our research identified that the London Borough of Tower Hamlets has the best average latency speed, measuring just 9.554 ms. Second place goes to Newham, another London Borough, with an equally impressive latency speed of 9.846 ms.
Residents in the Outer Hebrides in Scotland don’t have it quite so good, clocking an average latency speed of 58.874 ms. This is still reasonable and would allow residents to carry out simple tasks online, however, there is a considerable difference of 49.32 ms from Tower Hamlets in first place.
Which UK street has the fastest and slowest broadband speed?
As of December 2021, the street with the slowest broadband speed was Wistaston Road in Crewe, where residents have an average broadband speed of just 0.25 Mbps. At this speed, it would take residents over two-and-a-half days to download a two-hour HD film and almost 24 hours to download a 45-minute HD TV show.
By contrast, residents living on Britain’s fastest street for broadband, Haul Fryn in Birchgrove, Swansea, experience an average speed of 882.03 Mbps. This means Wistaston Road is a staggering 3,567 times slower than Haul Fryn, and residents would only have to wait about a minute to download the same film or a mere 24 seconds to download the same show.
A breakdown of the UK streets with the slowest and fastest broadband (2021)
Internet speeds by country
The top 10 countries with the fastest fixed broadband internet speeds
In 2021, Monaco topped the list of countries with the fastest fixed broadband internet speed around the globe, reaching an impressive 270.25 Mbps on average. Hong Kong and Singapore rank second and third, respectively, with average speeds of more than 250 Mbps.
A breakdown of the countries with the fastest average fixed broadband internet speeds (October 2021)
The top 10 countries with the fastest mobile internet speeds
The United Arab Emirates (UAE) boasted the fastest mobile internet speed of all countries worldwide in 2021, racking up an average speed of 273.87 Mbps. South Korea was the only other country to reach internet speeds of more than 200 Mbps.
A breakdown of the countries with the fastest average mobile internet speeds (October 2021)
Mobile connection speeds
4G mobile broadband
Coverage of 4G mobile networks across the UK has not seen significant changes in recent years, however, the Shared Rural Network (SRN) agreement between the UK Government and industry in 2020 should fast-forward coverage over the coming years.
At the start of 2022, 92% of the UK landmass was estimated to have good 4G coverage from at least one operator, which includes nearly all premises in the UK.
4G coverage in Scotland and Wales is slower than elsewhere in the UK, however, individual mobile network operators (MNOs) aim to achieve between 85% and 88% coverage in Wales by 2027 (under the government’s SRN investment) and between 82% and 85% in Scotland.
Premises (outdoor) – coverage range across mobile network operators
Premises (outdoor) – coverage range across mobile network operators
May 2021
September 2021
January 2022
UK
99%
99-c.100%
98-c.100
England
99-c.100%
99-c.100%
99-c.100%
Northern Ireland
96-99%
97-99%
97-99%
Scotland
97-99%
97-99%
97-99%
Wales
96-99%
96-99%
95-99%
Source: Ofcom
Geographic area – coverage range across MNOs
Geographic area – coverage range across MNOs
May 2021
September 2021
January 2022
UK
79-85%
79-86%
79-86%
England
92-93%
92-94%
92-94%
Northern Ireland
86-92%
87-92%
87-92%
Scotland
57-72%
57-73%
57-74%
Wales
72-83%
72-84%
72-85%
Source: Ofcom
5G UK coverage
5G coverage from at least one operator ranges from 47% to 62% of premises outdoors in the UK, up from 42% and 57% in December 2021.
Premises (outdoor) covered by at least one operator
Premises (outdoor) covered by at least one operator
January 2022
UK
47-62%
England
49-65%
Northern Ireland
24-34%
Scotland
40-54%
Wales
27-38%
Source: Ofcom
Premises (outdoor) covered by all operators
Premises (outdoor) covered by all operators
January 2022
UK
4-12%
England
5-13%
Northern Ireland
2-6%
Scotland
2-8%
Wales
2-5%
The average cost of broadband
Pricing for broadband services from the UK’s independent full-fibre network operators can be lower than those from established providers.
Data from Ofcom shows full-fibre broadband pricing for selected independent providers, as well as BT using the Openreach full-fibre network and Virgin Media (which uses DOCSIS 3.1 cable and full-fibre technology) to provide ultrafast services. Operators such as Community Fibre, Hyperoptic, and G.Network are entering the broadband market thanks to a clever pricing strategy.
On top of the monthly price, some broadband providers charge fees for activation, set-up, or installation, which is dependent on the provider and contract length.
Broadband installation cost also depends on whether the broadband provider is registered to the Government’s Gigabit Broadband Voucher Scheme (GBVS). The scheme, which has been running since 2021, can provide up to £210 million worth of funding to help homes and businesses cover the costs of installing gigabit broadband. Households eligible for this can claim vouchers worth up to £1,500 through a registered broadband provider, and businesses can claim up to £3,500.
The average cost of a broadband and phone deal
According to Ofcom, 80% of UK households bought bundle deals (two or more services from the same provider) at the start of 2021. The most common combination was broadband and home phone deals, with just over a third (36%) of households opting for one of these packages.
When combining internet and a home phone, households in the UK pay an average of £28.33 a month for a standard, basic broadband package. If households were to upgrade to a superfast fibre connection (30 Mbps+), it would cost £39.75, and for ultrafast connections (300 Mbps+), it would cost £61.90.
The average cost of a broadband, phone and TV bundle
Almost a quarter (23%) of UK households are on triple-bundled deals, which include broadband, a home phone, and TV services. These deals are more expensive, however, they can save you all-important pennies compared to purchasing each separately.
In 2021, UK households paid £44.21 a month, on average, for standard broadband options, which increased to £56.99 a month for superfast broadband, and £79.40 for ultrafast.
Broadband customer complaint statistics
Uswitch’s analysis*** of quarterly complaints across eight leading internet service providers (ISP) per 100,000 customers between Q4 2010 and Q1 2022 can reveal that Vodafone receives the most complaints per 100,000 customers per quarter, with an average of 1.77. Following closely behind are TalkTalk and Plusnet, with an average of 1.59 and 1.45 complaints per 100,000 customers per quarter, respectively.
Sky, on the other hand, receives the least number of complaints per 100,000 customers per quarter. Since Q4 2010 and Q1 2022, the internet service provider has received an average of 0.41 complaints. Virgin Media also fares well on the complaints front, with an average of 0.76 complaints per 100,000 customers each quarter.
A breakdown of the average number of complaints per 100,000 customers (Q1 2019-Q1 2022)
The industry as a whole received an average of 19 complaints per 100,000 customers in Q1 2021—the highest number of complaints since Q4 2017, when 19 complaints were also made.
This sudden jump in complaints could be explained by the increased use of the internet at home during the Covid-19 pandemic, where enforced Government restrictions meant the vast majority of the population had to use their fixed broadband whilst working from home.
A breakdown of the average number of industry complaints per 100,000 customers for fixed broadband (2012-2022)
Most common reasons for broadband complaints (Q1 2022)
In Q1 2022, the majority of broadband complaints made to Ofcom were due to faults, service, and provisioning with the service, with just over a third (37%) of complaints encompassing this. Of these complaints, 40% were filed by customers of Shell Energy.
The handling of complaints proved to be an issue with customers across the industry, with Ofcom receiving a third (31%) of complaints about this. A further 14% of complaints related to billing, pricing, and charges.
Mobile internet statistics
Mobile devices have become an essential part of everyday life. Research shows that the number of unique mobile internet users stood at 4.32 billion in 2021, meaning that over 90% of the global internet population uses a mobile device to go online.
Mobile internet penetration rate worldwide (2022)
In 2022, it was found that 93.6% of the population in Canada were mobile internet users. Bahrain ranked first with a mobile internet penetration of approximately 98%, followed by the United Arab Emirates with 95.8%.
Kuwait was ranked third with 95% mobile internet usage penetration. The UAE and Kuwait also rank among the countries with the fastest average mobile internet speed worldwide.
Time spent on the internet via mobile
According to the latest mobile phone statistics available, the average person spends approximately 3.34 hours a day on their phone to access the internet.
Internet users in the Philippines spent more than five hours and 40 minutes using the Internet on their mobile phones per day, compared to Japan which registered the lowest number of daily hours spent online on mobile phones (one hour and 39 minutes per day).
Common usages of mobile data
Video apps make up two-thirds (66.2%) of mobile data usage globally each month, followed by social networking sites (10.1%). Although, these two categories overlap with each other, as users often watch videos via social networking apps, such as TikTok.
A breakdown of the distribution of global monthly mobile data by category (2021)
Uswitch.com broadband survey (August 2022)
We polled 2,003 adults around the UK aged 18 and over to find out how people feel about their broadband, their average spend per month, the most common broadband issues they have, and more.
48% said they’d change broadband providers due to rising costs
Six in 10 (64%) broadband users have changed their broadband provider at least once.
When asked what the main reason would be if they were to change their broadband provider, just under half (48%) said it would be due to cost.
On top of this, 20% said it was due to connectivity, orwanting a faster, more reliable broadband internet connection. However, 6% claimed they wouldn’t change broadband providers.
The reasons people are most likely to change broadband provider
Reason
Percentage
Cost (became too expensive/looking for a cheaper deal)
48%
Connectivity (looking for faster/more reliable Internet)
20%
Contract came to an end
10%
Customer service (poor customer service/looking for more reliable customer service)
8%
To consolidate broadband with other services as part of a bundle (i.e. TV, mobile, and/or phone)
6%
I wouldn’t change provider
6%
Other
1%
Source: Uswitch survey, August 2022
Spending on broadband has increased by a monthly average of £3.58 over the last 12 months
Despite 54% of those polled claiming their monthly spending on broadband has stayed the same over the last 12 months, 30% said that their monthly broadband spend had increased between £5 and £9.99 – a maximum increase of £119.88 per year. On average, broadband spending has increased by £3.58 per month or £42.96 per year.
The rise in broadband spending appears to be most common in Greater London and the North East of England, with 54% and 53% respectively spending more on broadband in the last 12 months. Those based in Yorkshire and the Humber are spending the most amongst all UK regions, with 2% of Yorkshire residents surveyed increasing their broadband outlay by more than £15. Comparatively, those based in the West Midlands have fared the best, with 12% of residents having only spent £4.99 or less on average.
How much monthly broadband spending have increased by over the last 12 months, per UK region
Region
Spend has stayed the same
Spend up to £4.99
Spend between £5 - £9.99
Spend between £10 - £14.99
Spend more than £15
East of England
56%
10%
25%
9%
0%
Greater London
46%
4%
36%
13%
1%
East Midlands
70%
5%
18%
6%
1%
West Midlands
47%
12%
36%
4%
1%
North East
53%
7%
33%
6%
0%
North West
53%
11%
29%
7%
1%
Northern Ireland
53%
6%
34%
6%
0%
Scotland
53%
11%
30%
6%
0%
South East
53%
10%
29%
7%
1%
South West
59%
6%
30%
4%
1%
Wales
54%
10%
32%
4%
0%
Yorkshire and the Humber
50%
8%
33%
7%
2%
Source: Uswitch survey, August 2022
Students’ monthly broadband spending have increased the most in the last 12 months
When broken down by housing arrangement, students were more likely to see an increase in their broadband spending over the last 12 months. With just 20% saying it stayed the same, a further 20% experienced a spending increase between £10 and £14.99, and 60% saw an increase between £5 and £9.99. This equates to an average increase of around £7 per month (or £84 a year), which is almost double the UK average increase of £3.58.
How much monthly broadband spending have increased by over the last 12 months, by housing arrangement
Housing arrangement
Spend has stayed the same
Spend has stayed the same
Increased by up to £4.99
Increased by £5 - £9.99
Increased by £10 - £14.99
Student housing
20%
0%
60%
20%
0%
Sheltered housing
30%
9%
43%
17%
0%
Other
43%
0%
43%
14%
0%
I/We live with my family
54%
5%
31%
9%
1%
Social housing such as council house
51%
8%
32%
9%
0%
A home that I/we own with a mortgage
52%
8%
33%
6%
0%
Private rental accommodation
56%
8%
29%
7%
1%
A home that I/we own outright
56%
11%
27%
6%
1%
£41 = what most people are paying for broadband each month
Of those polled, the average payment for broadband per month (including broadband bundles) is £40.97. Despite this, most people pay between £20 and £29.99 for their broadband each month, including bundle services like TV or mobile. This is followed by almost a quarter who pay between £30 and £39.99 for their broadband internet per month. 6% of respondents pay £70 or more.
Particular deals that include an installation charge are more common in some areas compared to others. On average, more than a quarter (26%) of respondents in our survey chose broadband deals with no installation fees included. In fact, 15% of respondents paid between £20 and £29.99, and a further 9% paid between £30 and £39.99.
Regionally, 44% of those in Greater London have paid a fee to have their broadband fitted, marginally more than residents in Northern Ireland (42%). By contrast, 80% of those in Wales and the South West opted to have no additional spending when it came to installing their broadband.
A breakdown of customers' broadband installation spending by region in the UK
Region
No installation fees
Up to £19.99
£20 - £29.99
£30 - £39.99
£40 or more
UK
74%
1%
15%
9%
1%
East Midlands
78%
1%
16%
6%
0%
South West
80%
2%
13%
6%
0%
North East
76%
1%
16%
7%
0%
Greater London
56%
1%
29%
12%
1%
Scotland
78%
1%
15%
6%
1%
Northern Ireland
58%
3%
21%
18%
0%
East of England
75%
1%
14%
9%
1%
South East
79%
2%
11%
7%
1%
West Midlands
68%
1%
15%
15%
0%
Yorkshire and the Humber
76%
1%
12%
11%
1%
Wales
80%
0%
16%
1%
3%
North West
78%
1%
11%
9%
1%
Source: Uswitch survey, August 2022
Outages the most common broadband connection issue in the UK
Despite paying for a broadband internet service each month, many people still experience issues with their broadband regularly.
In our survey, we found the most common connection issue people have faced since their broadband was installed is dropouts and outages, with a quarter experiencing this (26%). This was followed by poor home Wi-Fi coverage and slow speed (22% each), and router issues (15%). Despite this, 47% stated they had had no issues with their broadband since it was installed.
A breakdown of the most common broadband issues in the UK
Broadband issues
Percentage share of those experiencing this issue with broadband internet in the UK (%)
Dropouts/outages
26%
Slow speed
22%
Poor Wi-Fi coverage around the house
22%
Router issues
15%
Other
< 1%
No issues experienced
47%
Source: Uswitch survey, August 2022
(Source: Ofcom)
Note: NOW and KCOM were excluded due to lack of relevant data regarding customer satisfaction. ***Vodafone has no comparative data due to new entrance to the broadband market)
EE received a customer satisfaction rating of 85% (3% less than that of BT, but 2% more than the industry average). However, less than eight in every 10 customers (79%) were happy with their broadband speeds—4% below the industry average.
While EE had a lower quantity of customers with reason to complain (17%), their overall rating for satisfaction regarding customer complaints handling was less than half (only 49%). This represented 1% less than the industry average and 6% less than BT.
Vodafone, a new entrant into the broadband market, received the worst rating of all broadband providers listed. With an overall customer satisfaction rate of just 77%, this represented a score that was 6% below the industry average.
While more than eight out of every 10 customers (81%) were happy with the speeds Vodafone provided, more than one in four (26%) had a reason to complain about one aspect of the service. In addition, just under half (45%) approved of Vodafone’s customer complaints handling. However, this was 5% below the industry average.
A breakdown of broadband complaints statistics per 100,000 subscribers in Q3 2022
On average, 11 out of 100,000 customers in Q3 2022 complained to Ofcom about their broadband provider—an increase of one compared to a year earlier in Q3 2021. This shows relative stability within the broadband market regarding quality of service from broadband providers.
Ofcom customer complaints statistics show that Shell Energy accrued the most complaints in Q3 2022. Out of 100,000 customers, 27 people registered an issue with Ofcom regarding Shell Energy’s broadband service, with the primary issue being ‘complaints handling’. In Q3 2021, 17 customers complained about the services Shell Energy provided, showing a 58% increase from the previous year.
TalkTalk remained the second most complained about broadband provider, earning 18 Ofcom complaints per 100,000 customers in Q3 2022—a small increase from the 17 complaints seen in Q3 2021.
Sky overtook EE to become the best broadband provider for customer service based on having the fewest Ofcom complaints (going from five in Q3 2021 to four in Q3 2022). Meanwhile, EE had only four complaints in Q3 2021, but unfortunately received six just 12 months later. Both providers remain far below the industry average of 11 complaints per 100,000 subscribers, with BT and NOW Broadband joining them as the UK’s least complained about broadband providers.
Most common broadband issues in the UK
In the UK, the main reason for Ofcom complaints regarding broadband is ‘faults, service and provisioning’. This can be attributed to outages and speed throttling, alongside customer service itself, and represents less than four in 10 (38%) of all broadband complaints made to Ofcom.
UK broadband statistics show that just under a third (31%) of Ofcom complaints in 2022 related specifically to ‘complaints handling’ (i.e. the way companies deal with issues raised by the customer).
Finally, less than a fifth (18%) of UK broadband customers complained to Ofcom about their provider’s ‘billing, pricing and charges’. Shell Energy, the company with the largest number of complaints relating to broadband, had more than a quarter (26%) of its customer complaints relating to this very reason. Of the 27 people who raised issues in Q3 2022 regarding Shell’s broadband, seven customers (around a quarter) stated that ‘billing, pricing and charges’ was the primary reason for their Ofcom complaint.
Mobile broadband customer satisfaction statistics
Mobile broadband usage has increased exponentially across the UK in recent years, with 4G now covering almost the entire country, and the superfast 5G rollout happening in towns and cities nationwide.
According to UK broadband stats from Ofcom, the average monthly data consumption on mobile broadband alone was 5.6 gigabytes in 2021—a 24% increase on the 2020 figure. However, with increased subscriber counts and usage comes increased scrutiny. Below are the mobile broadband complaints statistics available for Q3 2021 and Q3 2022 per 100,000 subscribers.
A breakdown of mobile broadband complaints statistics per 100,000 subscribers in Q3 2022
For mobile complaints in Q3 2022, the industry average is less than that of fixed broadband: just two complaints per 100,000 customers, as opposed to 11 complaints, respectively. This represents the same as Q3 2021, showing 100% stability in terms of mobile customer complaints.
Talk Mobile had the most complaints per mobile provider, with a total of nine in Q3 2022 alone. This is seven more than the industry average, and four more than second-most complained about provider, TalkTalk.
BT Mobile saw the largest increase in complaints, with four Ofcom issues raised per 100,000 customers for Q3 2022. In the same period a year earlier, they accrued only two complaints per 100,000 customers—the industry average for that period.
EE and Tesco Mobile were the two companies who had the least complaints made about them across the two years studied. In Q3 2021 and Q3 2022, both companies received only one Ofcom complaint per 100,000 customers.
Both ‘complaints handling’ and ‘faults, services and provisioning’ received just over a quarter (26%) in the Ofcom complaints review, highlighting just how important customer service is to consumers.
Around four in 10 (42%) of BT’s issues were focused on ‘complaints handling’, far higher than any comparable service provider with available data.
A fifth (20%) of all complainants felt their primary reason for raising an issue with Ofcom was ‘changing provider’, with BT again having the most complaints in that field (25%).
UK broadband glossary
4G
4G, or Fourth Generation, is a type of broadband typically used by mobile devices. Following on from 3G, 4G is between five and seven times faster than its predecessor, allowing for a maximum potential peak download speed of 300Mbps. Although realistically, 42Mbps is consistently achievable on standard 4G with the higher speeds usually recorded on 4G LTE (A type of 4G not readily available in the UK). These speeds are a huge improvement on 3G services, which were limited to an average speed of 6Mbps in real world tests.
5G
Following on from 4G, 5G is the latest in high-speed internet connectivity, again typically used on mobile devices. 5G is seen as five times faster than 4G, and with a decreased latency, means data signals should stay stronger and more reliable as the networks roll out full coverage.
ADSL technology
ADSL broadband, or asymmetric digital subscriber line, uses copper cables otherwise utilised by phone lines. ADSL is the one of the slowest broadband variants in the UK, with speeds averaging only 10-11Mbps. The cables, attached to the vast majority of UK homes, suffer from geographical slowdown, meaning ADSL internet speeds are worse the further away the property is from the telephone exchange (the system used to send and deliver your data). By comparison, fibre (the more modern alternative) operates at light speed, and so offers zero slowdown with no geographical limitations.
Broadband
Broadband is the most prevalent way households connect to the internet in the UK. The name derives from ‘wide-bandwidth data transmission’, and unlike its predecessor ‘dial-up’, can remain online and connected at all times.
Fibre broadband
Fibre broadband is the backbone of high-speed internet access for the UK. Instead of using traditional copper cables to send data, fibre broadband uses optical cables, which are far more capable of sending large quantities of data reliably. Fibre broadband sends data via beams of light, meaning there’s no geographical slowdown. As a result, much higher download and upload speeds are available for broadband customers.
Fixed wireless broadband
Fixed wireless broadband is a variant of broadband that uses radio signals to transmit data instead of using copper or fibre optic cables. Quite often this is using 4G or 5G connectivity and is traditionally achieved by installing a satellite dish to the top of the property. In turn, this will communicate with another device in its line of sight, and so on all the way to the initial server. This system aims to connect rural properties that cannot access copper or fibre cables, and offers similar broadband speeds to that of fibre, although often at a higher cost.
Gigabit-capable broadband
Put simply, gigabit-capable broadband offers download speeds of 1,000Mbps, or 1Gbps. Films in high definition (HD) are typically between two and four gigabytes in size, meaning it could potentially take mere seconds to fully download using gigabit-capable broadband. While this won’t make the server you’re downloading from any faster, it has the added-benefit of increasing bandwidth for your entire home. This means large families with various devices won’t experience any slowdown from their broadband.
Internet Service Provider (ISP)
Internet service provider (ISP) is the phrase used to describe companies that provide internet access to customers. Examples of such companies are BT, Virgin Media, and PlusNet. In the UK, data shows there are over 100 registered ISPs, highlighting the competitive nature of the UK broadband market.
Latency
Latency, otherwise known as a ‘ping rate’, measures the time it takes for a quantity of data (called a ‘packet’) to go from your internet-enabled device, to your router, then to the street cabinet, the server, and all the way back again. Latency is most important for live-video calls and online gaming, where reactions are required quickly. Actions, such as comparing wireless routers and upgrading to the newest models, reducing the amount of connected devices, and changing to a better service provider can all potentially reduce your broadband latency.
Mbps
Mbps stands for ‘megabits per second’, and is a unit of measurement in terms of data transfer and network speed. A megabit is 1/8th of a megabyte, meaning that if you have a broadband speed of 100Mbps, you can download 12.5 megabytes per second of data (MBps). When written, ‘Mb’ stands for megabit and ‘MB’ stands for megabyte.
UK broadband FAQs
In 2021, 94% of UK adults accessed the internet, equating to 63.2 million people.
The average UK resident spends around four hours per day accessing the internet, whether that be for work or content consumption, such as video gaming and streaming platforms.
According to Ofcom’s Connected Nations Report 2022, only 0.3% of UK homes and businesses still do not have access to decent broadband (around 10Mbps). This affects around 80,000 properties across the UK, both residential and business.
In September 2022, the median average download speed in the UK was 65.3Mbps—a marked improvement over the 59.4Mbps figure recorded in March 2022. The median upload speeds in 2022 also rose, with the average figure standing at 15.5Mbps (a 4.9Mbps improvement from March 2022).
In terms of fibre optic broadband, there are two options in order to connect your home to the internet. FTTC, or ‘fibre to the cabinet’, is a system wherein your home is connected to an exchange (a street-level cabinet) by modern copper cables. In turn, this is connected to the primary exchange through fibre optic cables and means the data is lightning-fast to the street exchange, but a bit slower to your home.
Meanwhile, FTTP, or ‘fibre to the property’, utilises fibre optic cabling at every stage of the above process, meaning that more data can be transmitted at much higher speeds.
90% of UK homes currently have access to FTTC, however it’s being phased out due to the rapid rise in demand for faster broadband, and the widening availability of FTTP deals across the UK.
There are over 150 broadband providers available in the UK, supplying a range of different speeds and services, depending on the type of broadband available in that area.
In the third quarter of 2022, the average person in the UK spent around five hours and 47 minutes accessing the internet via any service.
With streaming being a popular way to watch TV and listen to music, as well as working from home becoming the norm, reliable broadband is now a necessity for the majority of households across the UK.
But how accessible is broadband in the UK and beyond? We’ve collated the latest UK broadband statistics for 2023, covering broadband access, usage, speed, cost, and more.
Compare broadband deals to ensure you get the best broadband for your needs.
Broadband connection statistics
How many people access the internet in the UK?
Over the years, the share of households with access to a “decent” broadband connection has grown steadily.
Data from Ofcom’s latest Connected Nations Report discovered that 99.7% of households in the UK had access to a decent connection as of January 2022, up one per cent from the last report in September 2021.
What is decent broadband?
Decent broadband is described as having a download speed of at least 10 Mbit/s and an upload speed of at least 1 Mbit/s.
A breakdown of access to at least 10 Mbit/s services (2021-2022)
Access to at least 10Mbps services
May 2021
September 2021
January 2022
UK
98%
98%
99%
England
99%
99%
99%
Northern Ireland
95%
95%
96%
Scotland
97%
97%
97%
Wales
97%
97%
98%
Source: Ofcom
The number of properties (both residential and commercial) that cannot receive a decent broadband service from a fixed line stands at around 506,000 (2%), dropping from 650,000 in December 2021.
A breakdown of homes and businesses unable to access decent broadband services (2021-2022)
Unable to access 10Mbps
May 2021
September 2021
January 2022
UK
0.40%
0.40%
0.30%
England
0.30%
0.20%
0.20%
Northern Ireland
2%
2%
2%
Scotland
1%
1%
1%
Wales
1%
1%
0.70%
Source: Ofcom
What percentage of the UK has gigabit broadband?
The number of homes able to get gigabit-capable broadband continues to increase, with nearly 19.3 million homes (66% of all UK homes) now able to access these faster services — up from 13.7 million (47%) in December 2021.
This has, in part, been driven by the rollout of full-fibre broadband and Virgin Media O2 making its network entirely gigabit-capable.
A breakdown of access to gigabit-capable broadband services (2021-2022)
Access to gigabit-capable services
September 2022
January 2023
May 2023
UK
70%
73%
75%
England
71%
75%
76%
Northern Ireland
87%
90%
91%
Scotland
64%
68%
69%
Wales
52%
57%
60%
Source: Ofcom
What percentage of the UK has full fibre broadband?
Full fibre coverage continues to increase, with a third (33%) of homes having access to full fibre services at the beginning of 2022. As a result, full fibre coverage sits at just under 9.6 million, an increase from 8.2 million (28%) homes in December 2021.
This has been bolstered through deployments by larger fibre infrastructure operators, and supported by smaller providers up and down the UK that serve individual regions.
A breakdown of access to full fibre broadband (2021-2022)
Access to full fibre
May 2021
September 2021
January 2022
UK
24%
28%
33%
England
23%
27%
31%
Northern Ireland
67%
71%
79%
Scotland
23%
27%
32%
Wales
24%
27%
32%
Source: Ofcom
What percentage of the UK has superfast broadband?
Superfast broadband coverage continues to slowly grow — albeit at a reduced pace compared to gigabit and full fibre — with coverage remaining at 96% of all UK homes. This slow progress is likely due to the increased rollout of full fibre and gigabit-capable connections UK-wide.
A breakdown of access to superfast broadband services (2021-2022)
Access to superfast fibre
May 2021
September 2021
January 2022
UK
96%
96%
96%
England
96%
96%
97%
Northern Ireland
90%
91%
92%
Scotland
94%
94%
94%
Wales
94%
94%
95%
Source: Ofcom
What about fixed wireless access networks and wireless internet service providers?
Aside from gigabit, full fibre, and superfast, broadband services are also available from Fixed Wireless Access (FWA) networks provided via mobile networks, or through Wireless Internet Service Providers (WISPs).
Latest Ofcom data shows that FWA coverage from mobile networks is available to 94% of premises in the UK, and around 7% can receive a decent broadband service from a WISP.
A breakdown of access to fixed wireless (2021-2022)
Access to fixed WANs
May 2021
September 2021
January 2022
UK Mobile Network Operators
(MNO)
93%
94%
94%
UK Wireless Internet Service
Providers (WISP)
6%
7%
7%
Source: Ofcom
Bearing in mind the broadband coverage estimates provided by FWA providers, it is estimated that there are still around 99,500 premises that do not have access to a decent broadband service from a fixed network or an FWA network at the beginning of 2022.
Rural broadband statistics
Understandably, average UK broadband speeds in rural areas tend to be considerably slower than those in urban areas. In 2020, the average speed in rural areas was 54 Mbit/s compared to 81 Mbit/s in urban areas.
This is because superfast broadband is less available in the countryside, and buildings are typically further away from cabinets, where long copper line connections cause slower performance.
Based on these speeds, a household with an average broadband speed in rural areas downloading a typical 858MB film (via On Demand) would take around 2 minutes and 15 seconds, compared to 1 minute and 30 seconds for those in urban areas. For a household with a decent download speed (10 Mbit/s average download speed), the download time jumps to 12 minutes.
In 2020, 0.9% of premises in rural areas could not access a decent broadband service (delivering an average download speed of 10 Mbit/s), compared with just 0.3 per cent of premises in urban areas
Urban vs rural broadband statistics
Broadband access statistics, by age
Age of internet users in the UK vs the world
UK
In the UK in 2020, 92.1% of the population aged 16 and over used the internet. As expected, this number has continued to grow over time, increasing from 79.4% a decade earlier—a rise of 16%.
Over the last 10 years, 16-to-24-year-olds used the internet the most, except for 2019 when 25-to-34-year-olds finished highest with 0.2% more users. This was short-lived, though, as 16-to-24-year-olds regained the top spot. As of 2020, the largest proportion of internet users came from the 16-24 and 25-35 age groups, with a share of 99.5% each.
Internet connections in households with one adult aged 65 years and over have increased since 2019 to 80%, however, these households still have the lowest proportion of internet connections overall.
A breakdown of internet users in the UK by age group (2020)
Worldwide
In 2021, just over a third of internet users were aged between 25 and 34 years old, making up the largest share of online users around the globe. 18 to 24-year-olds contribute just under a quarter of online users worldwide, and 35 to 44-year-olds take up almost 19%.
The global digital population aged 65 or older represented approximately 5.5% of all internet users worldwide.
A breakdown of internet users worldwide by age group (2021)
As of April 2022, Northern Europe had the highest internet penetration rate, with 98% of the population having access to the internet. Western Europe followed closely behind, with 94%.
Asia has the largest internet user base, with an estimated 2.7 billion internet users hailing from the region (this can be explained by its global population share). East Asia contributed the majority with an online penetration rate of close to 73% as of April 2022 — just above the global average of 63%. Despite this, Asia is far from being a leader in regard to online penetration.
Fixed broadband internet subscriptions around the world (2021)
Globally, almost one in three households have access to the internet via a fixed broadband connection. When broken down by region, however, Europe leads the way. Over 86% of European households have a fixed Internet connection, followed in second place by The Americas, with almost 80%.
The Commonwealth of Independent States (CIS) represent those countries formed through the dissolution of the Soviet Union. Just over three-quarters of these households have a fixed Internet connection, compared to almost 72% of those located in Asia and the Pacific.
The Arab States refer to the 22 Arab nations, who are members of the Arab League, and span across North Africa and the Middle East. Just over half of these households (56%) have access to the internet via fixed broadband, which is below the global average of 65.79%.
Less than 3% of African households have access to a fixed broadband Internet connection, which highlights the infrastructural chasm between the developed and the developing parts of our world.
Despite this, it's worth noting that the number of households with a fixed broadband connection in the Arab States and Africa could be significantly lower than in other regions because they rely on other types of broadband to access the internet, such as mobile broadband or satellite.
Broadband speed statistics
Uswitch classifies* broadband speeds into the following four main categories:
Standard broadband: Uses ADSL technology to provide average download speeds of around 10-11 Mbps.
Superfast broadband: Uses fibre-optic cables to deliver a range of speeds, from 30-100 Mbps.
Ultrafast broadband: Delivers speeds between 100-1000 Mbps.
Gigabit broadband: Providing internet speeds of 1000Mbps (1Gbps) and above.
The criteria for a “decent” broadband service is generally described as having a download speed of at least 10 Mbit/s and an upload speed of at least 1 Mbit/s. This is what you usually get with a standard broadband package, and enables you to carry out tasks like browsing the internet, online shopping, and sending emails.
*This is based on what broadband providers refer to in their products.
Average broadband connection speeds
As of 2021, the median average internet speed in the UK was 50.4 Mbps. This is a sharp increase of 40% from five years earlier, when the average was just 36 Mbps.
The increase has largely been driven by the increased rollout of ultrafast broadband and full fibre across the country, which delivers internet speeds of 100 Mbps and higher. A third (33%) of the UK can now access these connections, which explains why the average is faster than what most properties can actually get.
A breakdown of average broadband speed over the last five years (2017-2021)
Average download speeds by time of day
Average download speeds tend to slow during busy periods when broadband networks suffer the effects of—what’s known as—contention. In plain terms, this means competition for resources.
Across all connections, the average daily minimum speed (46.2 Mbit/s) was 90% of the average maximum speed (51.1 Mbit/s), while the average 8-10 pm peak-time speed (49.9 Mbit/s) was 98% of the average maximum.
Median average UK broadband speeds by time of day (Mbit/s, 2021)
Fixed broadband speeds vs reported internet speeds
Interested in finding out the difference between fixed broadband package speeds and the reported internet speeds, Uswitch analysed Ofcom fixed broadband performance data from homes across the UK. We obtained data on the region, internet service provider (ISP), broadband connection, and peak recorded download speeds from over 3,300 homes with fixed broadband. From this, we found the listed average download speeds for broadband connections in each home using each ISP website.
The percentage difference between the listed ISP broadband download speeds versus the connection’s reported peak download speed was then calculated for each ISP, broadband package, and UK region*.
Internet service providers
Virgin had the highest average download speed of all internet service providers analysed, with a difference of 97.58%. The only other ISP with an average download speed of 90% or more is Zen, with 90.67%. Comparatively, TalkTalk’s average download speed is just 81.39%.
Internet service provider
Average download speed (%)
Virgin
97.58
Zen
90.67
BT
88.74
Plusnet
87.72
EE
86.09
Sky
83.98
Vodafone
83.74
TalkTalk
81.39
Source: Uswitch
ISP broadband packages
We found that three out of five broadband connections from Virgin Media had a higher average download speed than stated in their package. Virgin’s M500 cable connection lists its package speed as 516 Mbit/s, but the average download speed reported via Ookla reaches 540.35 Mbit/s.
A similar story can be said for BT, with its broadband download speeds close to those listed in its package details. However, the BT 38 Superfast connection is reportedly 10 Mbit/s less than stated in the package (36 Mbit/s vs 26.82 Mbit/s).
On the other end of the spectrum, TalkTalk has the worst package speed vs reported internet speed, with their 38 FTTC and 76 FTTC packages both failing to reach the download speeds consumers pay for.
Fixed broadband package download speeds vs reported internet speeds (2022)
ISP broadband connections
Package download speed (Mbits/s)
Reported download speed average (Mbits/s)
BT
-
-
BT 160 FTTP
150
145.83
BT 38 FTTC
36
26.82
BT 52 FTTC
50
43.18
BT 76 FTTC
74
62.95
BT 76 FTTP
74
73.8
EE
-
-
EE 38 FTTC
36
32.2
EE 76 FTTC
74
61.72
Plusnet
-
-
Plusnet 38 FTTC
36
29.42
Plusnet 76 FTTC
66
60.61
Sky
-
-
Sky 38 FTTC
36
29.74
Talk Talk
-
-
TalkTalk 38 FTTC
38
32.23
TalkTalk 76 FTTC
80
62.26
Virgin
-
-
Virgin 100 Cable
108
109.47
Virgin 1000 Cable
1130
953.4
Virgin 200 Cable
213
208.58
Virgin 350 Cable
362
374.69
Virgin 500 Cable
516
540.35
Vodafone
-
-
Vodafone 76 FTTC
73
60.17
Source: Uswitch
Average download speed of fixed broadband packages (2021)
Regional breakdown
England’s capital, London, has the fastest average download speed of all regions in the UK, with an average download speed of 93.6%. Yorkshire and the Humber, the North East and South West follow behind with average download speeds in the 90% range.
Scotland, on the other hand, fares the worst of all, with an average download speed of 85.11% – a difference of 8% from London at the top of the table.
Region
Average download speed (%)
London
93.6
Yorkshire & Humberside
90.81
North East
90.39
South West
90.17
South East
89.4
Northern Ireland
88.88
East Midlands
88.33
West Midlands
88.2
Wales
88.02
East
86.1
North West
86.08
Scotland
85.11
Source: Uswitch
Internet speeds by local authority
Which local authority has the fastest and slowest download speeds in the UK? To find out, we utilised iOS and Android Speedtest data from Q2 2022 via Ookla. We then applied this to local authority boundaries, as per the Office of National Statistics, to highlight the average download, upload and latency performance speeds for each local authority**.
The local authorities with the fastest and slowest download speeds
Southampton has the fastest average download speed, clocking in at 166.677 Mbit/s. This was closely followed by Stockon-on-Tees, with a download speed of 166.356 Mbit/s.
Third place goes to Newham with a download speed of 157.795 Mbit/s, fourth to Coventry (157.652 Mbit/s), and fifth to Peterborough (157.509 Mbit/s).
On the other end of the scale, the local authority with the slowest download speed is the Isles of Scilly, with an average download speed of 24.536 Mbit/s—142.141 Mbit/s slower than first place Southampton.
The local authorities with the fastest and slowest average upload speeds
The London Borough of Tower Hamlets takes the crown for the fastest average upload speed, measuring an impressive 107.851 Mbit/s. Tower Hamlets is followed closely behind by Milton Keynes, with an average speed of 105.531 Mbit/s.
Southampton, which has the fastest average download speed, also has the third-fastest upload speed, clocking in at an average of 102.859 Mbit/s.
On the other end of the scale, as well as having the slowest download speed in the UK, the Isles of Scilly has the slowest upload speed too. The local authority racks up an average upload speed of just 6.555 Mbit/s, which is almost 16 times slower than Tower Hamlets in first place.
The local authorities with the fastest and slowest average latency
Latency definition: Latency refers to the delay before a transfer of data begins. A connection with low latency often feels more responsive for simple tasks like internet browsing.
Most online activities require a response time of less than 100 milliseconds (ms) to provide a good experience, although some online gaming apps require 50 ms.
Our research identified that the London Borough of Tower Hamlets has the best average latency speed, measuring just 9.554 ms. Second place goes to Newham, another London Borough, with an equally impressive latency speed of 9.846 ms.
Residents in the Outer Hebrides in Scotland don’t have it quite so good, clocking an average latency speed of 58.874 ms. This is still reasonable and would allow residents to carry out simple tasks online, however, there is a considerable difference of 49.32 ms from Tower Hamlets in first place.
Which UK street has the fastest and slowest broadband speed?
As of December 2021, the street with the slowest broadband speed was Wistaston Road in Crewe, where residents have an average broadband speed of just 0.25 Mbps. At this speed, it would take residents over two-and-a-half days to download a two-hour HD film and almost 24 hours to download a 45-minute HD TV show.
By contrast, residents living on Britain’s fastest street for broadband, Haul Fryn in Birchgrove, Swansea, experience an average speed of 882.03 Mbps. This means Wistaston Road is a staggering 3,567 times slower than Haul Fryn, and residents would only have to wait about a minute to download the same film or a mere 24 seconds to download the same show.
A breakdown of the UK streets with the slowest and fastest broadband (2021)
Internet speeds by country
The top 10 countries with the fastest fixed broadband internet speeds
In 2021, Monaco topped the list of countries with the fastest fixed broadband internet speed around the globe, reaching an impressive 270.25 Mbps on average. Hong Kong and Singapore rank second and third, respectively, with average speeds of more than 250 Mbps.
A breakdown of the countries with the fastest average fixed broadband internet speeds (October 2021)
The top 10 countries with the fastest mobile internet speeds
The United Arab Emirates (UAE) boasted the fastest mobile internet speed of all countries worldwide in 2021, racking up an average speed of 273.87 Mbps. South Korea was the only other country to reach internet speeds of more than 200 Mbps.
A breakdown of the countries with the fastest average mobile internet speeds (October 2021)
Mobile connection speeds
4G mobile broadband
Coverage of 4G mobile networks across the UK has not seen significant changes in recent years, however, the Shared Rural Network (SRN) agreement between the UK Government and industry in 2020 should fast-forward coverage over the coming years.
At the start of 2022, 92% of the UK landmass was estimated to have good 4G coverage from at least one operator, which includes nearly all premises in the UK.
4G coverage in Scotland and Wales is slower than elsewhere in the UK, however, individual mobile network operators (MNOs) aim to achieve between 85% and 88% coverage in Wales by 2027 (under the government’s SRN investment) and between 82% and 85% in Scotland.
Premises (outdoor) – coverage range across mobile network operators
Premises (outdoor) – coverage range across mobile network operators
May 2021
September 2021
January 2022
UK
99%
99-c.100%
98-c.100
England
99-c.100%
99-c.100%
99-c.100%
Northern Ireland
96-99%
97-99%
97-99%
Scotland
97-99%
97-99%
97-99%
Wales
96-99%
96-99%
95-99%
Source: Ofcom
Geographic area – coverage range across MNOs
Geographic area – coverage range across MNOs
May 2021
September 2021
January 2022
UK
79-85%
79-86%
79-86%
England
92-93%
92-94%
92-94%
Northern Ireland
86-92%
87-92%
87-92%
Scotland
57-72%
57-73%
57-74%
Wales
72-83%
72-84%
72-85%
Source: Ofcom
5G UK coverage
5G coverage from at least one operator ranges from 47% to 62% of premises outdoors in the UK, up from 42% and 57% in December 2021.
Premises (outdoor) covered by at least one operator
Premises (outdoor) covered by at least one operator
January 2022
UK
47-62%
England
49-65%
Northern Ireland
24-34%
Scotland
40-54%
Wales
27-38%
Source: Ofcom
Premises (outdoor) covered by all operators
Premises (outdoor) covered by all operators
January 2022
UK
4-12%
England
5-13%
Northern Ireland
2-6%
Scotland
2-8%
Wales
2-5%
The average cost of broadband
Pricing for broadband services from the UK’s independent full-fibre network operators can be lower than those from established providers.
Data from Ofcom shows full-fibre broadband pricing for selected independent providers, as well as BT using the Openreach full-fibre network and Virgin Media (which uses DOCSIS 3.1 cable and full-fibre technology) to provide ultrafast services. Operators such as Community Fibre, Hyperoptic, and G.Network are entering the broadband market thanks to a clever pricing strategy.
On top of the monthly price, some broadband providers charge fees for activation, set-up, or installation, which is dependent on the provider and contract length.
Broadband installation cost also depends on whether the broadband provider is registered to the Government’s Gigabit Broadband Voucher Scheme (GBVS). The scheme, which has been running since 2021, can provide up to £210 million worth of funding to help homes and businesses cover the costs of installing gigabit broadband. Households eligible for this can claim vouchers worth up to £1,500 through a registered broadband provider, and businesses can claim up to £3,500.
The average cost of a broadband and phone deal
According to Ofcom, 80% of UK households bought bundle deals (two or more services from the same provider) at the start of 2021. The most common combination was broadband and home phone deals, with just over a third (36%) of households opting for one of these packages.
When combining internet and a home phone, households in the UK pay an average of £28.33 a month for a standard, basic broadband package. If households were to upgrade to a superfast fibre connection (30 Mbps+), it would cost £39.75, and for ultrafast connections (300 Mbps+), it would cost £61.90.
The average cost of a broadband, phone and TV bundle
Almost a quarter (23%) of UK households are on triple-bundled deals, which include broadband, a home phone, and TV services. These deals are more expensive, however, they can save you all-important pennies compared to purchasing each separately.
In 2021, UK households paid £44.21 a month, on average, for standard broadband options, which increased to £56.99 a month for superfast broadband, and £79.40 for ultrafast.
Broadband customer complaint statistics
Uswitch’s analysis*** of quarterly complaints across eight leading internet service providers (ISP) per 100,000 customers between Q4 2010 and Q1 2022 can reveal that Vodafone receives the most complaints per 100,000 customers per quarter, with an average of 1.77. Following closely behind are TalkTalk and Plusnet, with an average of 1.59 and 1.45 complaints per 100,000 customers per quarter, respectively.
Sky, on the other hand, receives the least number of complaints per 100,000 customers per quarter. Since Q4 2010 and Q1 2022, the internet service provider has received an average of 0.41 complaints. Virgin Media also fares well on the complaints front, with an average of 0.76 complaints per 100,000 customers each quarter.
A breakdown of the average number of complaints per 100,000 customers (Q1 2019-Q1 2022)
The industry as a whole received an average of 19 complaints per 100,000 customers in Q1 2021—the highest number of complaints since Q4 2017, when 19 complaints were also made.
This sudden jump in complaints could be explained by the increased use of the internet at home during the Covid-19 pandemic, where enforced Government restrictions meant the vast majority of the population had to use their fixed broadband whilst working from home.
A breakdown of the average number of industry complaints per 100,000 customers for fixed broadband (2012-2022)
Most common reasons for broadband complaints (Q1 2022)
In Q1 2022, the majority of broadband complaints made to Ofcom were due to faults, service, and provisioning with the service, with just over a third (37%) of complaints encompassing this. Of these complaints, 40% were filed by customers of Shell Energy.
The handling of complaints proved to be an issue with customers across the industry, with Ofcom receiving a third (31%) of complaints about this. A further 14% of complaints related to billing, pricing, and charges.
Mobile internet statistics
Mobile devices have become an essential part of everyday life. Research shows that the number of unique mobile internet users stood at 4.32 billion in 2021, meaning that over 90% of the global internet population uses a mobile device to go online.
Mobile internet penetration rate worldwide (2022)
In 2022, it was found that 93.6% of the population in Canada were mobile internet users. Bahrain ranked first with a mobile internet penetration of approximately 98%, followed by the United Arab Emirates with 95.8%.
Kuwait was ranked third with 95% mobile internet usage penetration. The UAE and Kuwait also rank among the countries with the fastest average mobile internet speed worldwide.
Time spent on the internet via mobile
According to the latest mobile phone statistics available, the average person spends approximately 3.34 hours a day on their phone to access the internet.
Internet users in the Philippines spent more than five hours and 40 minutes using the Internet on their mobile phones per day, compared to Japan which registered the lowest number of daily hours spent online on mobile phones (one hour and 39 minutes per day).
Common usages of mobile data
Video apps make up two-thirds (66.2%) of mobile data usage globally each month, followed by social networking sites (10.1%). Although, these two categories overlap with each other, as users often watch videos via social networking apps, such as TikTok.
A breakdown of the distribution of global monthly mobile data by category (2021)
Uswitch.com broadband survey (August 2022)
We polled 2,003 adults around the UK aged 18 and over to find out how people feel about their broadband, their average spend per month, the most common broadband issues they have, and more.
48% said they’d change broadband providers due to rising costs
Six in 10 (64%) broadband users have changed their broadband provider at least once.
When asked what the main reason would be if they were to change their broadband provider, just under half (48%) said it would be due to cost.
On top of this, 20% said it was due to connectivity, orwanting a faster, more reliable broadband internet connection. However, 6% claimed they wouldn’t change broadband providers.
The reasons people are most likely to change broadband provider
Reason
Percentage
Cost (became too expensive/looking for a cheaper deal)
48%
Connectivity (looking for faster/more reliable Internet)
20%
Contract came to an end
10%
Customer service (poor customer service/looking for more reliable customer service)
8%
To consolidate broadband with other services as part of a bundle (i.e. TV, mobile, and/or phone)
6%
I wouldn’t change provider
6%
Other
1%
Source: Uswitch survey, August 2022
Spending on broadband has increased by a monthly average of £3.58 over the last 12 months
Despite 54% of those polled claiming their monthly spending on broadband has stayed the same over the last 12 months, 30% said that their monthly broadband spend had increased between £5 and £9.99 – a maximum increase of £119.88 per year. On average, broadband spending has increased by £3.58 per month or £42.96 per year.
The rise in broadband spending appears to be most common in Greater London and the North East of England, with 54% and 53% respectively spending more on broadband in the last 12 months. Those based in Yorkshire and the Humber are spending the most amongst all UK regions, with 2% of Yorkshire residents surveyed increasing their broadband outlay by more than £15. Comparatively, those based in the West Midlands have fared the best, with 12% of residents having only spent £4.99 or less on average.
How much monthly broadband spending have increased by over the last 12 months, per UK region
Region
Spend has stayed the same
Spend up to £4.99
Spend between £5 - £9.99
Spend between £10 - £14.99
Spend more than £15
East of England
56%
10%
25%
9%
0%
Greater London
46%
4%
36%
13%
1%
East Midlands
70%
5%
18%
6%
1%
West Midlands
47%
12%
36%
4%
1%
North East
53%
7%
33%
6%
0%
North West
53%
11%
29%
7%
1%
Northern Ireland
53%
6%
34%
6%
0%
Scotland
53%
11%
30%
6%
0%
South East
53%
10%
29%
7%
1%
South West
59%
6%
30%
4%
1%
Wales
54%
10%
32%
4%
0%
Yorkshire and the Humber
50%
8%
33%
7%
2%
Source: Uswitch survey, August 2022
Students’ monthly broadband spending have increased the most in the last 12 months
When broken down by housing arrangement, students were more likely to see an increase in their broadband spending over the last 12 months. With just 20% saying it stayed the same, a further 20% experienced a spending increase between £10 and £14.99, and 60% saw an increase between £5 and £9.99. This equates to an average increase of around £7 per month (or £84 a year), which is almost double the UK average increase of £3.58.
How much monthly broadband spending have increased by over the last 12 months, by housing arrangement
Housing arrangement
Spend has stayed the same
Spend has stayed the same
Increased by up to £4.99
Increased by £5 - £9.99
Increased by £10 - £14.99
Student housing
20%
0%
60%
20%
0%
Sheltered housing
30%
9%
43%
17%
0%
Other
43%
0%
43%
14%
0%
I/We live with my family
54%
5%
31%
9%
1%
Social housing such as council house
51%
8%
32%
9%
0%
A home that I/we own with a mortgage
52%
8%
33%
6%
0%
Private rental accommodation
56%
8%
29%
7%
1%
A home that I/we own outright
56%
11%
27%
6%
1%
£41 = what most people are paying for broadband each month
Of those polled, the average payment for broadband per month (including broadband bundles) is £40.97. Despite this, most people pay between £20 and £29.99 for their broadband each month, including bundle services like TV or mobile. This is followed by almost a quarter who pay between £30 and £39.99 for their broadband internet per month. 6% of respondents pay £70 or more.
Particular deals that include an installation charge are more common in some areas compared to others. On average, more than a quarter (26%) of respondents in our survey chose broadband deals with no installation fees included. In fact, 15% of respondents paid between £20 and £29.99, and a further 9% paid between £30 and £39.99.
Regionally, 44% of those in Greater London have paid a fee to have their broadband fitted, marginally more than residents in Northern Ireland (42%). By contrast, 80% of those in Wales and the South West opted to have no additional spending when it came to installing their broadband.
A breakdown of customers' broadband installation spending by region in the UK
Region
No installation fees
Up to £19.99
£20 - £29.99
£30 - £39.99
£40 or more
UK
74%
1%
15%
9%
1%
East Midlands
78%
1%
16%
6%
0%
South West
80%
2%
13%
6%
0%
North East
76%
1%
16%
7%
0%
Greater London
56%
1%
29%
12%
1%
Scotland
78%
1%
15%
6%
1%
Northern Ireland
58%
3%
21%
18%
0%
East of England
75%
1%
14%
9%
1%
South East
79%
2%
11%
7%
1%
West Midlands
68%
1%
15%
15%
0%
Yorkshire and the Humber
76%
1%
12%
11%
1%
Wales
80%
0%
16%
1%
3%
North West
78%
1%
11%
9%
1%
Source: Uswitch survey, August 2022
Outages the most common broadband connection issue in the UK
Despite paying for a broadband internet service each month, many people still experience issues with their broadband regularly.
In our survey, we found the most common connection issue people have faced since their broadband was installed is dropouts and outages, with a quarter experiencing this (26%). This was followed by poor home Wi-Fi coverage and slow speed (22% each), and router issues (15%). Despite this, 47% stated they had had no issues with their broadband since it was installed.
A breakdown of the most common broadband issues in the UK
Broadband issues
Percentage share of those experiencing this issue with broadband internet in the UK (%)
This page includes relevant broadband speed statistics for 2023, such as UK broadband download speeds, which region has the fastest internet, and the national average broadband speed.
Which UK region is the best for full fibre broadband? We’ve compiled over 200 fibre broadband statistics covering fibre availability, download speeds, and more.
Click here to find the latest UK broadband access statistics for 2023, covering fibre broadband access, usage reports, urban vs. rural broadband, and more.
Looking for a broadband deal that doesn't require a credit check? Take a look at our guide to finding a broadband package if you have a poor credit history.