
It wasn’t too long ago that sustainability was only a hobby for a few people. Not everyone had a recycling bin, most people weren’t composting, and no-one thought twice before picking up plastic packaging in a supermarket.
Times, thankfully, have changed. Sustainability is now something everyone knows about, with global governments making efforts to ensure they’re doing their bit in the fight against climate change.
We look at who’s winning that fight, comparing energy suppliers, transport links and pollution levels to see which is the most sustainable city in the world.

Wellington, New Zealand, has less pollution than anywhere else
Pollution is one of the most common contributors to climate change, with the fumes emitted from our homes and cars leading to environmental and health problems across the globe. However, in Wellington, that problem seems to be well under control.
The city scores 13.66 on the pollution index, meaning out of every 100 particles of air, only 13.66 are polluted.
New Zealand’s air is so clean for a number of reasons. For a start, it has a relatively sparse human population compared to other countries, while its main industries are agriculture, horticulture, fishing and tourism, unlike the large factories dominating much of Europe. Canberra, next door in Australia, also scores well for pollution, with an index total of only 13.89, while Zurich in Switzerland comes in third with 17.31.
Most of Switzerland’s energy comes from renewable sources such as hydropower and biomass, substantially reducing the amount of pollutants it produces.
Over 90% of Nairobi, Kenya’s energy is sustainable

Image: Nairobi, Kenya
Sustainable energy has experienced a big push in recent years, as governments across the world look to cut down their carbon emissions. Nowhere has this push been bigger than in Nairobi. The Kenyan city’s energy is 90.6% environmentally friendly, with the bulk of it coming from hydroelectricity or geothermal energy, where it’s Africa’s largest producer. However, poor air quality, pollution rate and affordability index place Nairobi as the fifth least sustainable city.
Lisbon in Portugal is the second best city for sustainable power, making the most of its sunny location with a huge network of solar systems.
In third is Lima, the capital of Peru. Having faced years of air pollution, it turned to solar power to try and bring its emissions down. The city even installed billboards to act as air purifiers.
Canberra, Australia is leading the way on green transportation
An incredible 88.6% of Canberra’s transport infrastructure is green, with a vast network of public transport options meaning you can get almost anywhere without a car. The city also runs a ride-sharing service, encouraging people to travel as groups and cut back on solo driving.
Another place getting people around in a green way is Zurich (88.8%). The Switzerland city is a biker’s haven, with dedicated bike lanes and car-free roads surrounding the city centre. Walking is also a great way to get around, with cars very much seen as unnecessary by most of its residents.
Completing the top three is Denver. With 82.7% of Colorado city’s transport being sustainable, locals can get around on a range of public transport options.
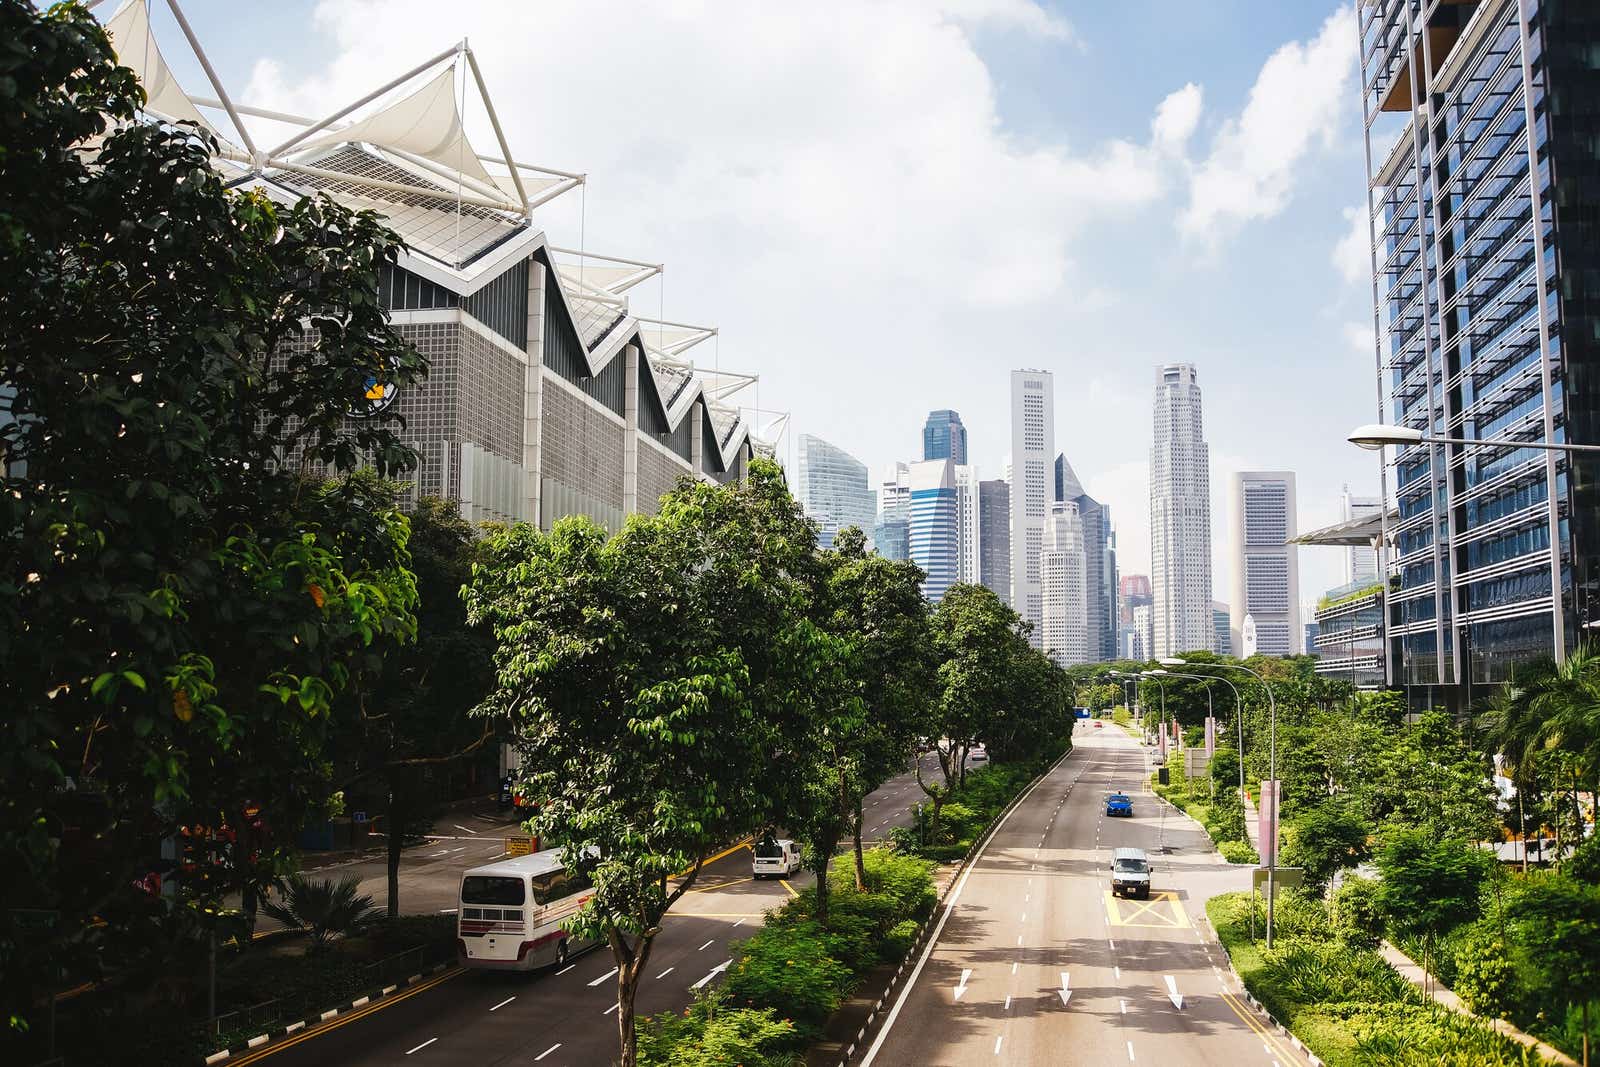
Overall, Canberra is the world’s most sustainable city

Image: Canberra, Australia
When you put all of our scoring together, it’s Canberra in Australia that comes out on top. Not only does the city provide an excellent public transport service, it also offers 48% of its energy in sustainable ways, while only scoring 13.89 on the pollution index.
The country’s capital relies heavily on solar power and nearby wind farms, while also ensuring an incredible 94% of its residents have internet access to make this one connected city.
Madrid comes in second place, scoring highly for energy (77.3%) and transport (82%), with Brisbane completing the top three. Australian cities in general perform well, with excellent solar power bidding farewell to energy options of the past.
Jeddah is the least sustainable city on earth
At the other end of the table, Jeddah, Saudi Arabia is the least sustainable city in our report. The gateway to Mecca for many of the Islamic faith, it suffers from a heavy reliance on fuel and gas. In fact, much of Saudi Arabia’s economy is funded by fossil fuel exports, which increase the country’s bank balance but badly damage its impact on the environment.
Other cities that struggle include New Delhi, the capital of India, where a huge human population and heavily built up, urban areas make green spaces a premium.
Rounding up our worst top three is Amman in Jordan. While it might be home to the Roman Temple of Hercules, its heavy urbanisation and reliance on fossil fuels make it much less strong when it comes to sustainability.
The 10 most sustainable cities

The 10 least sustainable cities

How can you make your home more sustainable?
There are many things you can do around the home to cut back on your emissions, and ensuring you’re with the right energy supplier is just one of them. We’ll help you compare energy prices for some of the most energy efficient suppliers on the market, making it easy for you to switch to a company that truly cares.
Other quick tips include things like turning plugs off when they’re not in use, only boiling as much water as you need in your kettle, and checking the insulation in your loft. Poorly insulated buildings let heat escape, meaning your heating will be working overtime to keep your home cosy. In winter, that could see your emissions rapidly increasing.
Methodology:
To determine which country was the most sustainable they were ranked on six sustainability factors: affordability of property, traffic levels (including commute time, CO2 emission and inefficiencies of traffic system), pollution levels (air, water and smaller types), use of renewable energy.
Sources:
Energy index - Arcadis report on how much of our primary energy comes from renewables?
Transport Infrastructure Index - Arcadis Traffic Index is a composite index of time consumed in traffic due to job commute, estimation of time consumption dissatisfaction, CO2 consumption estimation in traffic and overall inefficiencies in the traffic system.
Percentage of green space - Rank of percentage greenspace within a given city from Able Cities Index.
Affordability Index - Price to Income Ratio is the basic measure for apartment purchase affordability (lower is better)
Pollution Index - Pollution Index is an estimation of the overall pollution in the city. The biggest weight is given to air pollution , then to water pollution/accessibility, two main pollution factors. Small weight is given to other pollution types.
Air quality annual average - Used to quantify C02 emissions by city, measured in kt/year and ranked from highest to lowest.
All data is correct as of 19th April 2021.