- Uswitch.com>
- Mortgage guides
Mortgages guides
Check out our helpful guides to have all of your burning questions about mortgages explained. Covering a wide range of topics, from mortgage terminology and statistics, through to sourcing reputable mortgage advice from a broker when you're looking to buy, move or remortgage your property:

Can You Get A Mortgage On Disability Benefits?
Having a long-term illness or disability shouldn’t prevent you from getting a mortgage, but it is more difficult to get a mortgage on benefits alone. We'll look at all you need to know
How Much Is Stamp Duty In The UK In 2026? SDLT Rates & Thresholds
Stamp duty is a tax applied to certain property purchases. Find out if it will affect you and how much you may have to pay.

Mortgage Terminology - A to Z - What You Need to Know
Mortgage jargon and terminology used to describe the home buying process explained

Rent to Buy Schemes UK - July 2026
What is Rent to Buy? Find out if the government’s Rent to Buy scheme is right for you, and how to find a home under the scheme

How To Get A House Valuation
A house valuation will tell you about the property and how much it is worth. Our guide explains the difference between a valuation and a survey.

Low Fee & Fee Free Mortgages
The mortgage mortgage arrangement fee, is the lender's charge for setting up a mortgage - we look at fee free or low fee mortgages and what to consider

Capital Gains Tax - What Is It, How Does It Work & Current Rates
Capital gains tax is a tax on the profit you make when selling or disposing of an asset. The tax is only charged on the profit, i.e. the gains.

Should I get a 2 or 5 year fixed-rate mortgage?
To help you decide whether to fix your mortgage for 2 or 5 years, we explain the pros and cons of both options.

How Long Does It Take To Get A Mortgage?
The time it takes to get a mortgage will depend on a number of factors, find out more with our comprehensive guide.

Remortgage with the same lender | Product transfers explained
Understand the pros and cons of remortgaging with the same lender, and why it’s so important to compare mortgage deals before making a decision.
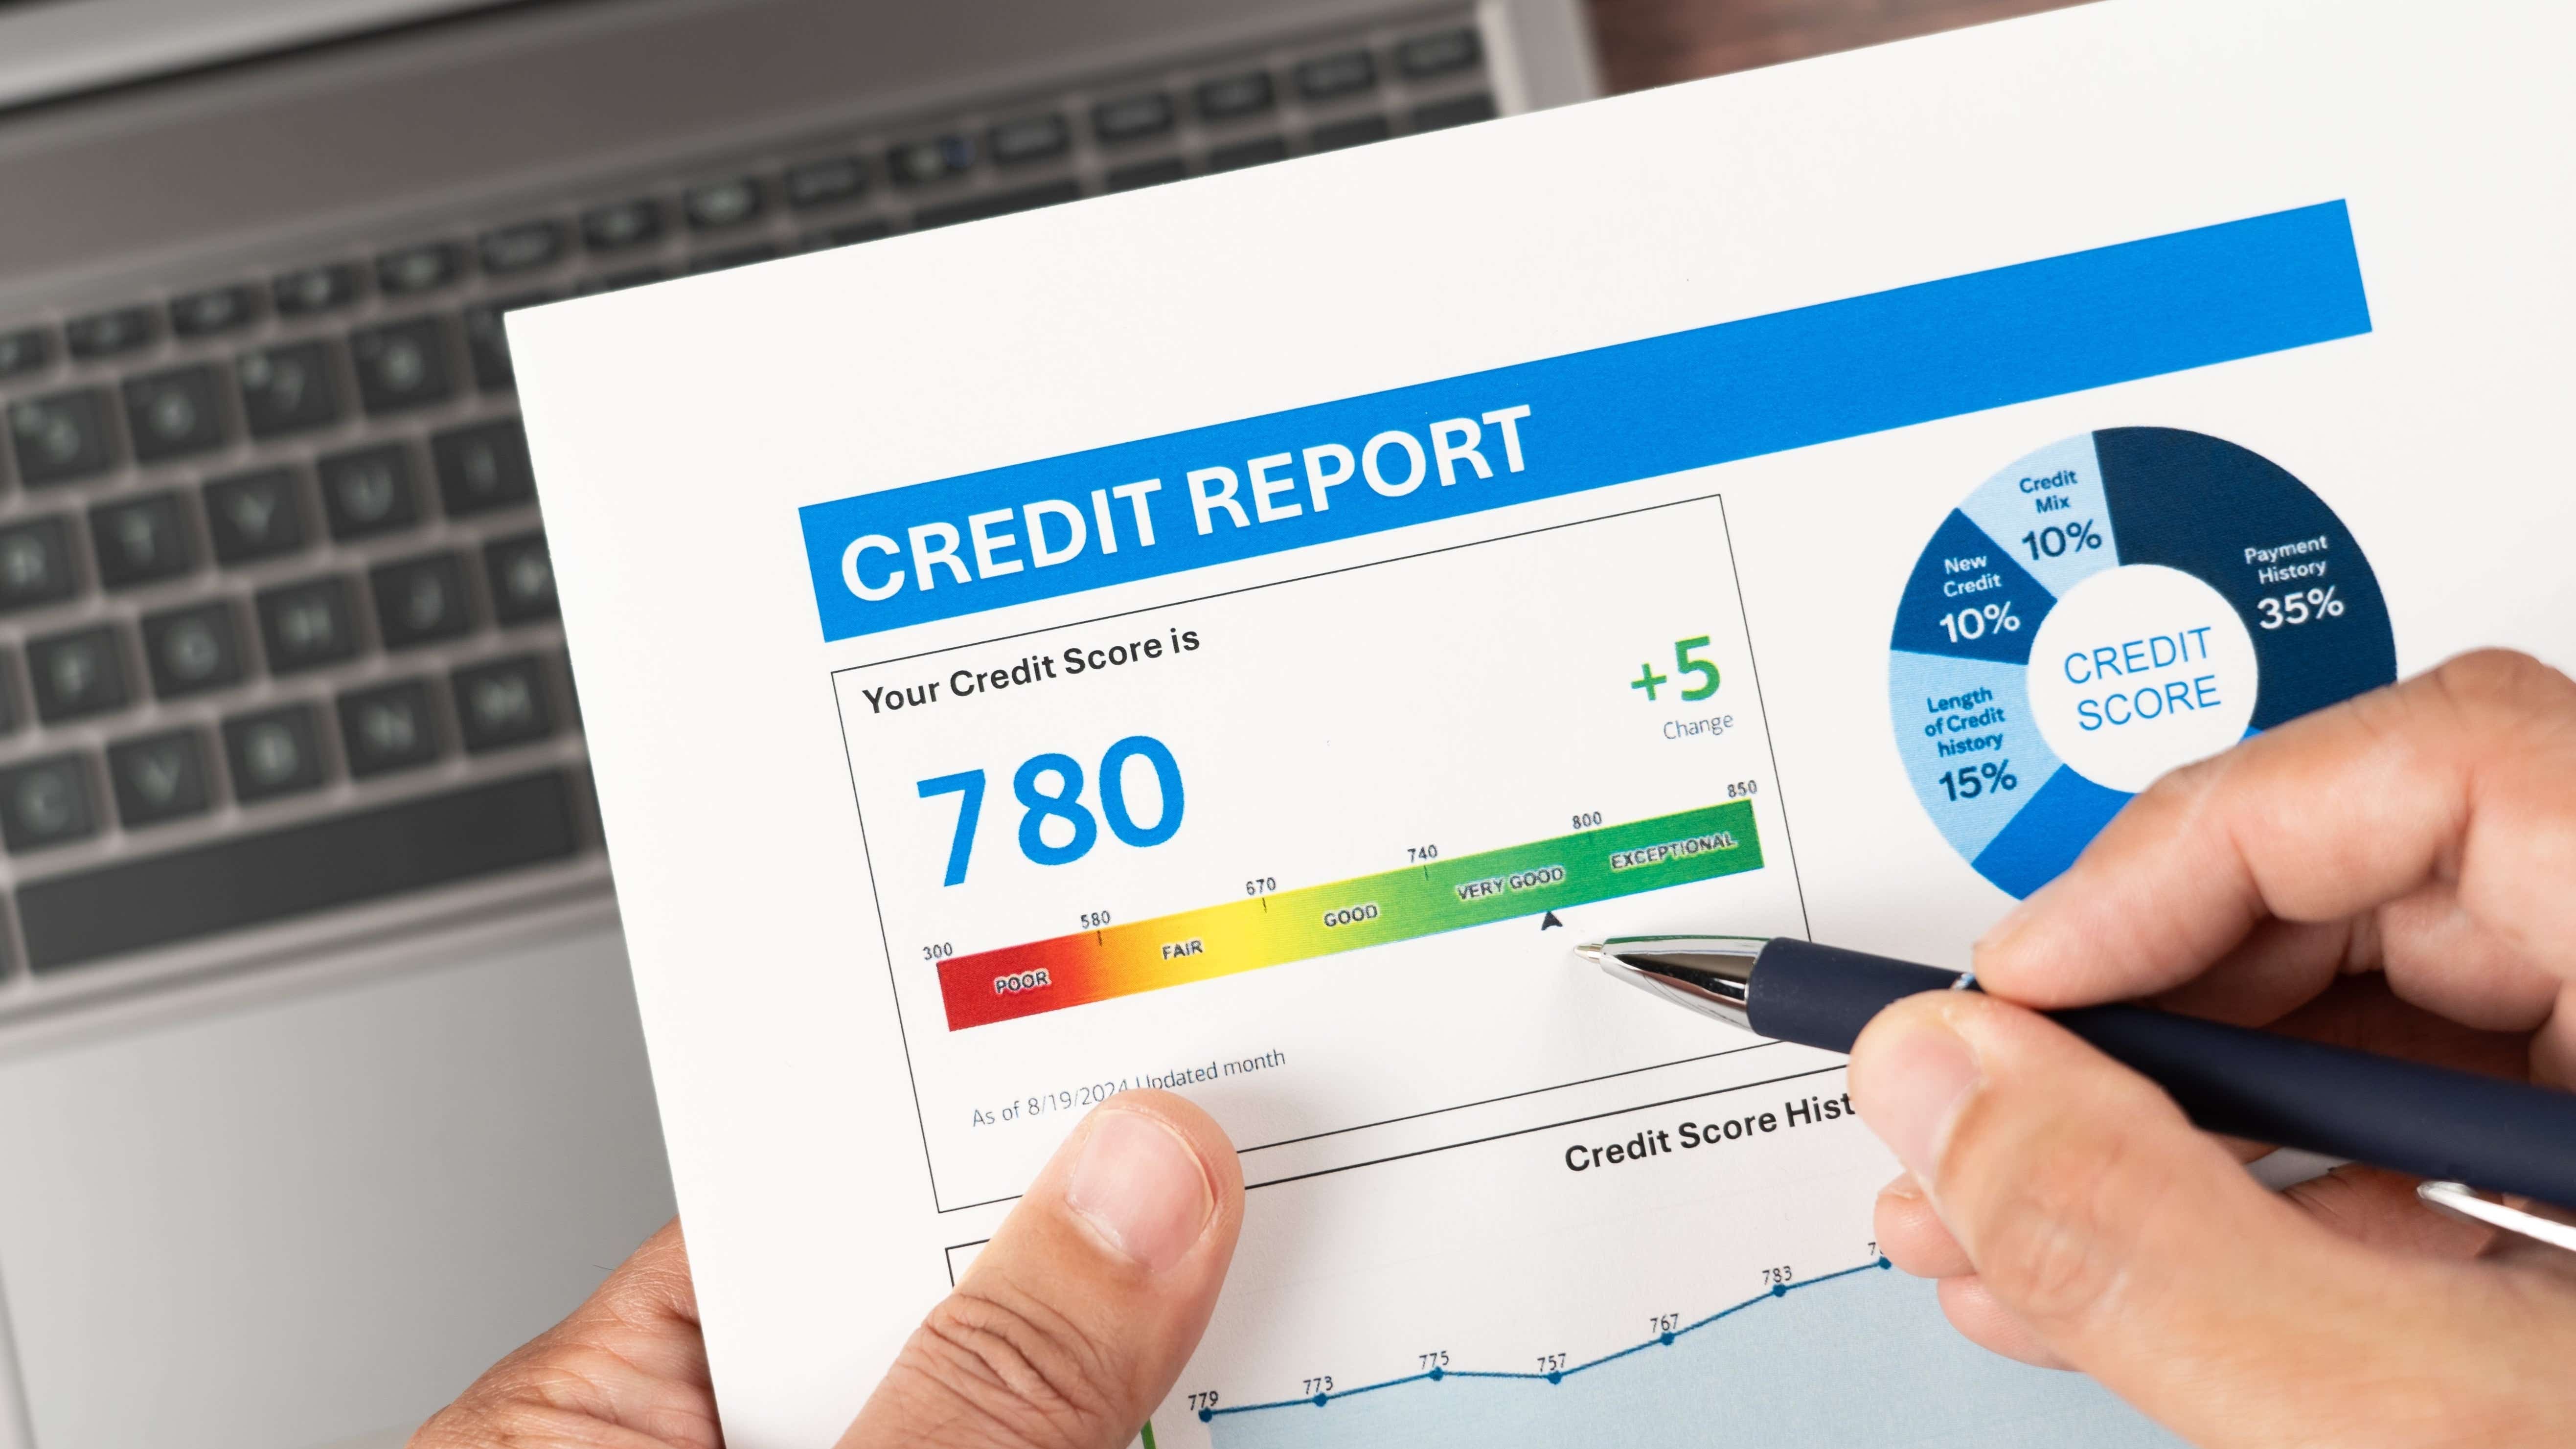
Mortgages & Credit Scores Guide
Your guide to understanding what a credit score is and how it could impact your mortgage application.
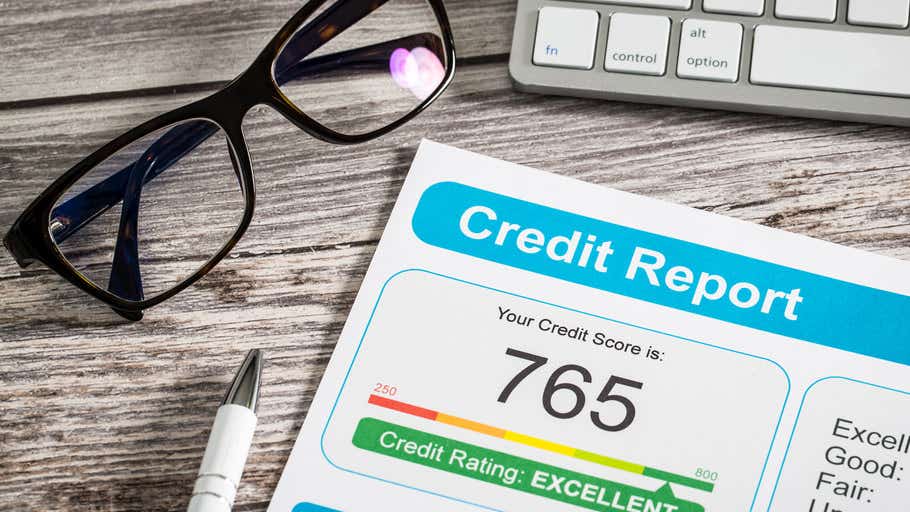
Can I Get A No Credit Check Mortgage?
A lender will look at your credit history when you apply for any type of mortgage, but some base their decision more heavily on your credit score than others.
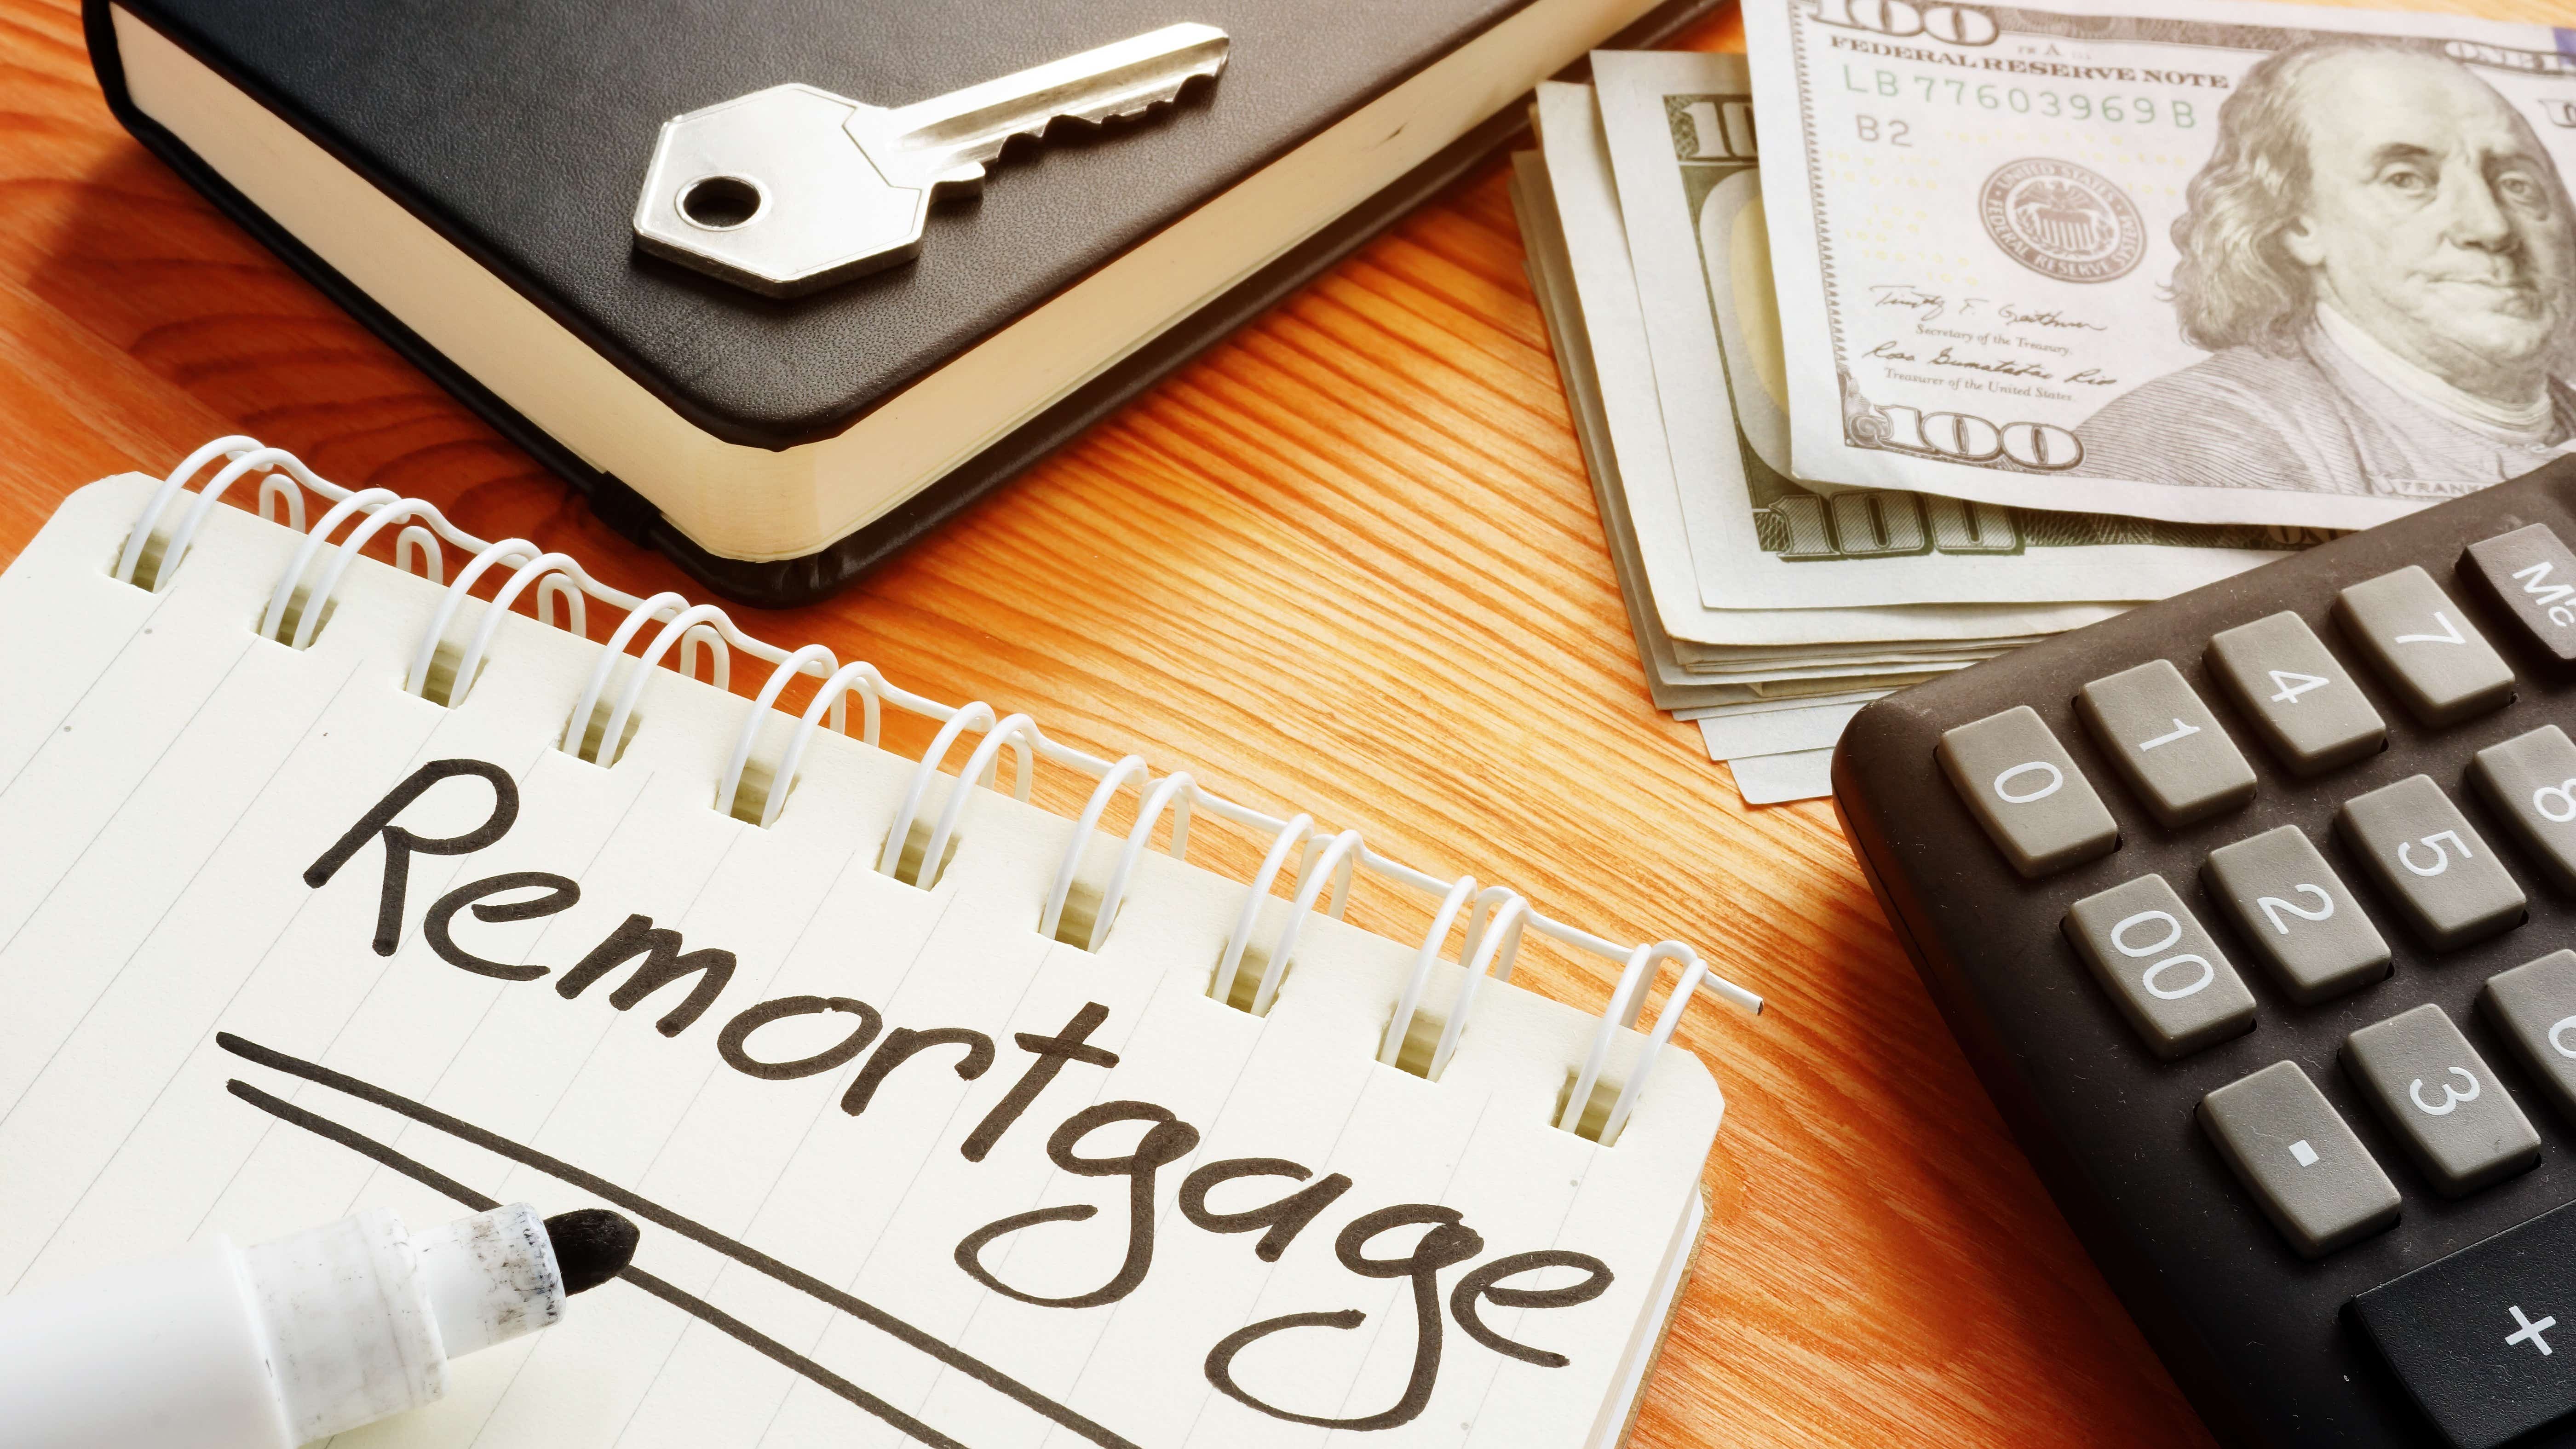
How to remortgage: your guide to the remortgage process
Are you thinking about remortgaging? This guide explains what to expect during the remortgage process.

Residential Mortgage Guide 2025
Learn all about the largest and most common form of credit in the UK - a residential mortgage, helping millions of us buy homes.
100+ UK buy-to-let landlord statistics 2024
Click here for the latest buy-to-let landlord statistics for 2024, including the regions with the most buy-to-let owners, background statistics, and more.

How Much Money Do You Need To Buy A House In 2026?
Discover the costs that could arise when buying your first home and how you could make your money go further
Average Time to Evict a Tenant: How Long Do Evictions Really Take? | Uswitch
Everything you need to know about how long the eviction process takes, the law on evictions, and key statistics about average court times.
UK Remortgage Statistics 2024
The latest UK remortgage facts and stats for 2024, covering UK remortgage rates data, cost increases, remortgage market figures, and more.
UK Mortgage Statistics 2025 - Facts and Stats Report | Uswitch.com
We’ve collated new and updated UK mortgage statistics for 2025, covering mortgage approvals, transactions, arrears, average mortgage debt, and more.

Should I Pay Off My Mortgage Early?
Is paying your mortgage off early always a good thing? We explain your options and the pros and cons of repaying your mortgage before the end of the term

What Is The Maximum Age For A Mortgage In The UK?
Past 50 your mortgage options begin to change, but there are still plenty of options. Check out our guide to mortgages for older borrowers to find out more

Are Cashback Mortgages Worth It?
A cashback mortgage will give you a cash lump sum when you successfully apply for one, but do they always offer the best value for money overall? We look at the answer

How To Become A Landlord In 2025
Investing in buy to let property can be profitable, but do you know all of the requirements of being a landlord and how to get started? Our guide will help

No Deposit Mortgages Guide 2025
No deposit mortgages give you a 100% Loan to Value loan and are aimed at customers who do not have a deposit. We share whether these are still available and how to get one

Family Assist Mortgages
Could a family assisted mortgage help get you onto the property ladder sooner? We explore how they work, who can get one and which lenders offer them.
Mortgage Types

First Time Buyer Mortgages 2026
Ready to buy your first home? Compare first-time buyer mortgage rates and deals from 60+ lenders with our award-winning partner Mojo Mortgages.

What Is A Lifetime Mortgage, And How Do They Work?
Find the best lifetime mortgage rates & offers for 2026. Our partner is an expert in equity release and can find the right deals for you.

Compare Best Equity Release Mortgage Rates & Deals 2026
Compare the best equity release mortgage rates for 2026. Our partner Responsible Equity Release can help find the right option for you.

Best 10 Year Fixed-Rate Mortgages
A 10-year fixed-rate mortgage helps you secure the same interest rate on your mortgage for ten years. Get your best 10 year fixed rate mortgage rate & deal here.

2 Year Fixed Rate Mortgages | Best UK Mortgage Rates 2 Year Fixed
A 2 year fixed rate is a mortgage deal where the interest rate stays the same for two years. Find your best 2 year fixed mortgage rates here.

Best 5 Year Fixed Rate Mortgages
A 5 year fixed rate is a mortgage deal where the interest rate stays the same for five years. Find your best 5 year fixed mortgage rates here.

Best Buy To Let Mortgages - July 2026
Uswitch helps you to compare the best buy-to-let mortgage rates and deals for your budget through our broker partner

Consumer Buy To Let Mortgages
A consumer buy-to-let mortgage is a type of buy-to-let mortgage that is regulated by the Financial Conduct Authority (FCA). We look at how they differ from traditional buy-to-let mortgages.

Joint Mortgages: What Are They & How Do They Work?
Learn about buying a home with someone else with a joint mortgage, and how to apply for one.

Interest-Only Mortgages UK - July 2026
An interest-only mortgage is a deal where you only pay the interest on the amount you've borrowed each month. Get your best interest only mortgage rates here.
Best Tracker Mortgages
A tracker mortgage is a type of variable rate mortgage which follows a base rate. Compare the best tracker mortgage rates & deals here.

Help To Buy Mortgage Schemes UK 2026
Help-To-Buy is designed to help first-time buyers buy a property with a 5% deposit. The government lends you between 5% and 20% of your home. Find out more.
Joint Borrower Sole Proprietor mortgages
Looking to help a loved one get on the property ladder? A Joint Borrower Sole Proprietor (JBSP) mortgage could be a good option for you.

5% Deposit & 95% LTV Mortgages
A 95% LTV mortgage allows you to borrow up to 95% of your property value, a popular option for first-time buyers. Find your best 95% LTV mortgage rates here.

Guarantor Mortgages UK - July 2026
Learn more about guarantor mortgages and how they could help you get on the property ladder.

Best Mortgage In Principle
Take the first step towards buying a new home, or getting a new mortgage deal. Apply for a mortgage in principle here today.
40% Deposit & 60% LTV Mortgages
A 60% loan to value (60% LTV) mortgage allows buyers to secure a property with a 40% deposit. Find the best 60% LTV mortgage rates & deals here.

100% LTV Mortgages UK | Zero Deposit Mortgages
Learn more about 100% LTV mortgages and how no deposit mortgages work.

Second Charge Mortgages
Find out everything you need to know about second mortgages and see how they could help you use your equity to borrow more.
Barclays Mortgage Rates & Deals
If you're considering a getting a mortgage from Barclays, it's a good idea to know a little more about them. We look at their product range and how to compare it with other lender's ranges, as well as providing helpful criteria guidance .

Best Fixed Rate Mortgages
A fixed rate mortgage means your monthly repayments have a fixed interest rate for a period of time. Compare fixed-rate mortgage rates & deals here.
Compare Santander Mortgage Rates
Santander is a popular choice for mortgages because it offers competitive rates and unique deals. Find out if Santander is the best mortgage lender for you.

Compare HSBC Mortgage Rates
HSBC is a popular choice for mortgages because it offers competitive rates and unique deals. Find out if HSBC is the best mortgage lender for you.
Compare Halifax Mortgage Rates
Halifax is a popular choice for mortgages because it offers competitive rates and unique deals. Find out if Halifax is the best mortgage lender for you.

85% LTV & 15% Deposit Mortgages
85% loan to value (85% LTV) mortgages allow buyers to acquire a property with a 15% deposit. Find the best 85% LTV mortgage rates & deals here.

80% LTV & 20% Deposit Mortgages
Compare the best 80% LTV mortgage rates & offers for 2026. No fees ✔️Compare over 60 lenders ✔️

Over 50s Mortgage Rates & Deals UK 2026
Which lenders offer mortgages to over 50s? Plenty of mainstream banks and building societies such as NatWest, HSBC & Santander lend to over 50s. Find out more.

10% Deposit & 90% LTV Mortgages
A 90% loan to value (90% LTV) mortgage allows buyers to secure a property with a 10% deposit. Find the best 90% LTV mortgage rates & deals here.
Let To Buy Mortgages - Rates & Deals
A let-to-buy mortgage is when you rent out your existing home and buy a new house to live in. Get your best let-to-buy mortgage rates & deals here.

75% LTV & 25% Deposit Mortgages
Compare the best 75% LTV mortgage rates & offers for 2024. No fees ✔️ Compare over 70 lenders ✔️

65% LTV Mortgages
A 65% loan to value (65% LTV) mortgage allows buyers to secure a property with a 35% deposit. Find the best 65% LTV mortgage rates & deals here.

70% LTV & 30% Deposit Mortgages
A 70% loan to value (70% LTV) mortgage allows buyers to secure a property with a 30% deposit. Find the best 70% LTV mortgage rates & deals here.

Discounted Variable Mortgages
A discount mortgage is where the interest rate is set at an amount below the lender's standard variable rate (SVR) for a set amount of time. Find out more.
Compare Flexible Mortgages
A flexible mortgage enables you to make overpayments and underpayments to suit your financial situation. Get your best flexible rate mortgage rates & deals.

Moving House Mortgage | Transfer Mortgage To A New Home
Moving home? We can help you transfer your current mortgage deal & rate to your new home. Find a moving home mortgage here.

HMO Mortgages - July 2026
An HMO mortgage is a type of specialist mortgage that is used to purchase houses in multiple occupations (HMOs). Find out more about HMO mortgage deals.

Commercial Mortgage Rates & Deals
Compare the best commercial mortgage rates & offers for 2026. Our partner B2B finance can help you find the right deal.

Self Build Mortgages
Our guide covers self-build mortgages, including what they are and eligibility criteria.

Bad Credit Mortgages UK - July 2026
A poor credit history does not mean you can't own your own home. Find bad credit mortgage deals with our partner Advantage FS to find the best one for you.

Over 60s Mortgages
Find the best mortgage rates & deals for over 60s in 2024. Our partner Advantage FS can find the right deal for you.

Land Mortgages | Can You Get A Mortgage For Land?
Learn about land mortgages and how they work

Compare Best Mortgage Rates & Deals For Over 70s
Find the best mortgage rates & deals for over 70s in 2024. Our partner Advantage FS can find the right deal for you.