- Uswitch.com>
- Mortgages>
- Studies>
- UK First-Time Buyer Statistics 2024
150+ UK first-time buyer statistics 2024

This page includes relevant UK first-time buyer statistics for 2024, such as overall market trends, and what first-time purchasing looks like across various demographics, such as age, location, and property type.

Our research collates the most recent first-time buyer statistics for 2024, alongside our own unique data, to show how the market is changing for those buying their first property. This includes information on the average value of first-time buyers’ homes, first-time-buyer rates and average deposits paid, and demographic breakdowns such as age, region, and salary. By analysing past and present trends, we have outlined how the market has evolved, and suggest what the future has in store for UK first-time buyers.
Find a first-time buyer mortgage
Our trusted partner Mojo Mortgages can compare deals from a wide range of lenders to find the right mortgage option for your needs.
Top 10 UK first-time buyer statistics 2024
In 2022-23, there were 874,000 recent first-time home buyers in England (those who purchased a property within the last 3 years), an increase of around 22,000 compared to 2021-22.
As of 2022-23, the average age for a first-time buyer in England was 34.
In the same year, two in five (40%) first-time buyers were couples without dependents, with almost a third (32%) one-person households.
During 2022-23, the average deposit for first-time buyers in England was £53,414.
Just under three in five (58%) first-time buyers in 2022-23 were in the top two income quintiles (income quintiles are five equally-sized groups divided by earnings).
A third of first-time buyers in 2022-23 were aged over 35 - 20% aged 35-44, and 13% aged over 45.
Almost two in three (65%) first-time buyer mortgage quotes between 2022-23 were to those applied using the title ‘Mr’.
Those applying using the title ‘Mrs’ received, on average, the highest loan amount at £223,525, while their unmarried counterparts (‘Miss’) typically received quotes of £172,578.
Almost half (49%) of first-time buyers from our exclusive survey claimed that house prices would need to fall between 11%-20% before they’d consider buying a home, with a further 13% claiming prices would need to drop more than 20%.
By contrast, more than a quarter (28%) of first-time buyer quotes were for flats (2022-23).
Official government statistics used in this report have been collected from the most recent English Housing Survey, published by the Department for Levelling Up, Housing and Communities in December 2023.
UK first-time buyer market statistics 2024
The latest UK first-time buyer statistics show a general upward trend in purchases throughout the last decade, with a peak of 957,000 recent first-time buyers in England (those who bought a property in the last three years) in 2020-21. As of 2022-23, this number stood at 874,000, an increase of 2.58% from 852,000 in the year prior, but a significant 8.7% drop from the 2020-21 peak.
What is a recent first-time buyer?
A recent first-time buyer is defined as anyone who has bought a house for the first time in the last three years and has not previously owned a property.
The total number of UK first-time buyers by year
In recent years, the decline in first-time buyers was less pronounced in London than in other parts of the UK. Though the capital’s 2021-22 figures represented a decline of around 6% from its peak of 155,000 in 2020-21, this was substantially less than the rest of the country, which saw figures fall from 803,000 to 706,000 (-12%) in 2021-22.
A breakdown of the total number of recent first-time buyers in England by year (2012-23)
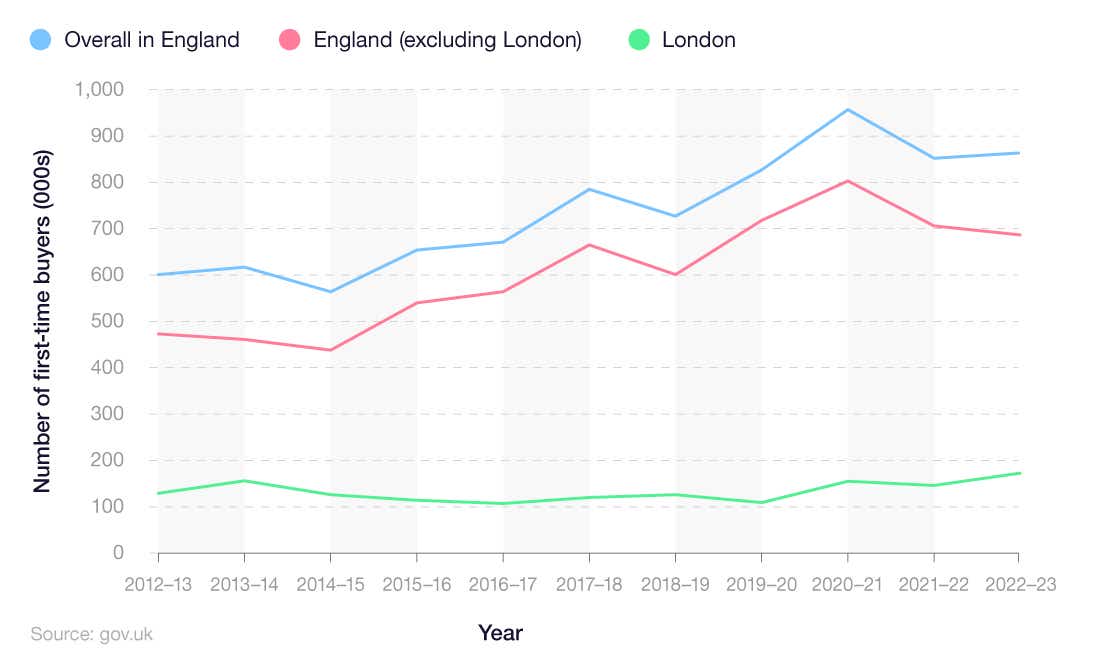
London has recovered from this downward trend in the last year. Between 2021-22 and 2022-23, London experienced almost a quarter (23.97%) increase in the number of first-time buyers, from 146,000 to 181,000.
In contrast, England (excluding London) underwent a 1.84% decrease in first-time buyer figures, dropping below 700,000 (706,000 to 693,000). Higher first-time-buyer mortgage rates will also be playing a part here.
Statistics for the average first-time buyer age UK
The latest demographics of first-time home buyers in the UK show that people aged between 25-34 make up the largest portion of the market. With around 521,000 first-time buyers in this age category, 25-34-year-olds are responsible for three in five (60%) first-time home purchases in England.
This is an increase on the previous year when this age group was only responsible for just over half (51%) of sales (438,000). Despite this, it remains a slight decrease on 2020-21, when 24-34-year-olds accounted for 62% of the total market (601,000 buyers).
A breakdown of English first-time buyer statistics by age group in 2022-23
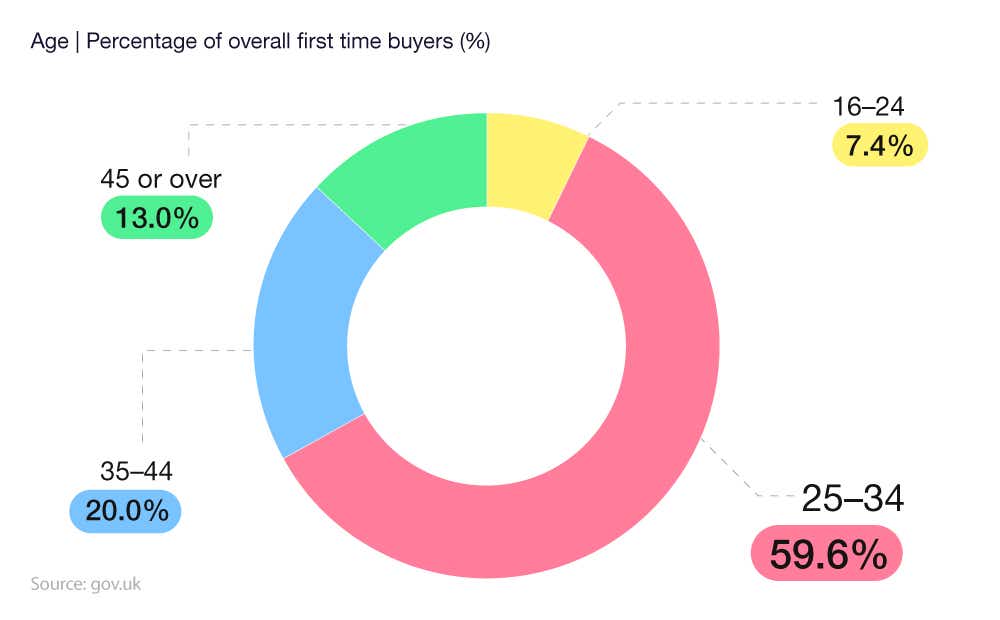
35-44 is the next most prominent average first-time buyer age group, with total purchases of 175,000 in 2022-23 – accounting for one-fifth (20%) of the market. This represents a decrease from 2021-22 where this age group was responsible for almost a third (30%) of overall first-time buyer sales (255,000). Back to the 2020-21, its proportion of the market stood at just over a fifth 21%), or 203,000 sales).
16-24-year-olds have also seen a decline in their share of the first-time buyer market, perhaps owing in part to increases in first-time-buyer mortgage rates. With 65,000 purchases in 2022-23, they represent just 7.4% of sales – down from 9% (69,000) in the previous year.
Those aged 45 and over now make up 13% of the overall figure with 113,000 sales – continuing the rise from 5% in 2019-20. According to Nuts About Money, new first time buyers are more likely to be paying off their mortgage in retirement - with 42% of all new mortgages having an end date past 66 years old (over the State Pension age). This has risen from 31% in 2021.
Which age group makes up the highest percentage of UK first-time homeowners?
25-34 year-olds (60%)
A breakdown of the average age of English first-time home buyers by year (2012-23)
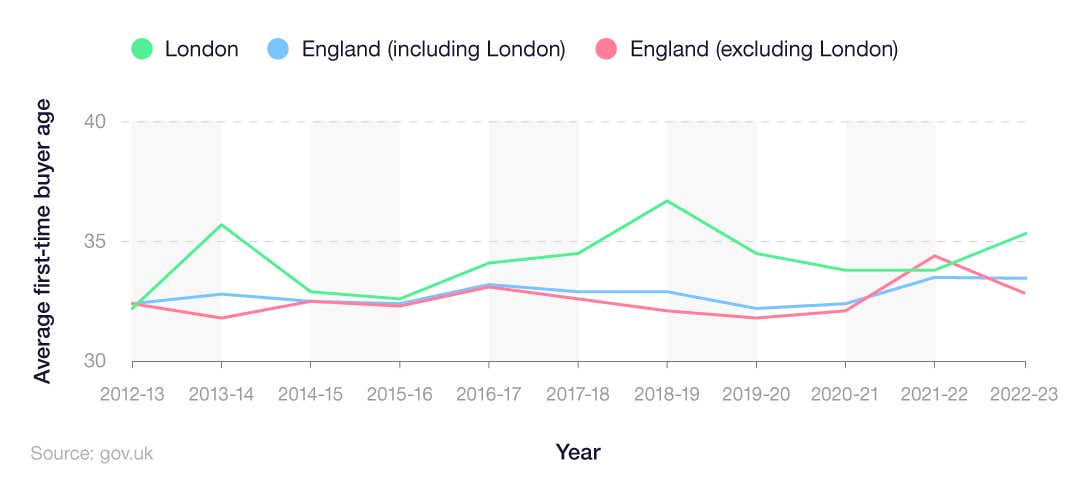
First-time buyer statistics show that the average age of a first-time buyer in England (excluding London) decreased over the last year. After a decade of fluctuations between 32 and 33, the average age of a first-time buyer increased by more than a year between 2020-21 and 2021-22 to 33.4. The 2022-23 figure of 33 is 0.4 years lower, on average, than in 2021-22 (33.4).
Contrastingly, the average first-time buyer age in London has increased in the past year, after being on a downward trend in recent years. Following a decade-high average age of 36.7 in 2018-19, the average age fell to 33.8 in 2020-21 and 2021-22. This has since increased to 35.3 in 2022-23 – the third-highest average age since 2003-04 (behind 2013-14 and 2018-19).
What is the average age to buy a house in the UK as a first-time buyer?
33
UK first-time buyer statistics by employment status
Our data on first-time homebuyers reveals that 94% of individuals who requested a mortgage quote for the first time in 2022-23 were employed on a full-time basis. Typically, they requested an average mortgage loan amount of £201,525. While the percentage share was similar to the year prior (93.98%), the average loan amount increased by almost £10,000, from £191,848 (+5.04%).
A breakdown of average mortgage for first-time buyers in the UK by employment status
| Employment status | Percentage of quotes (%) | Average loan amount (£) |
|---|---|---|
| Full-time | 94.23 | £201,525 |
| Part-time | 5.77 | £202,307 |
(Source: Uswitch)
In contrast, only 6% of those unemployed or retired sought a mortgage quote between 2022-23. Their average loan amount was just £800 more than their full-time working counterparts, averaging at £202,307.
UK first-time buyer statistics by salary
The latest first-time buyer stats show that those in the lowest income band made up the lowest proportion of first-time buyers in 2022-23, accounting for just 6.2% (54,000) of the overall total. However, this represents an increase from the previous year where they made up just 4.5% (39,000).
Only the first and third quintiles saw an increase on the previous year in their share of overall sales in 2022-23. The third quintile underwent the greatest increase, from 20.4% (174,000) to 27.1% (236,000).
A breakdown of the number of first-time buyers in England by income band 2022-23
| Weekly gross household income band | Number of first-time buyers | Percentage of overall first-time buyers (%) |
|---|---|---|
| First quintile - £76-£360 | 54,000 | 6.2 |
| Second quintile - £361-£596 | 78,000 | 9 |
| Third quintile - £597-£888 | 236,000 | 27.1 |
| Fourth quintile - £889-£1,372 | 262,000 | 30 |
| Fifth quintile - £1,373-£16,805 | 242,000 | 27.7 |
(Source: gov.uk)
The quantity of first-time buyers generally increases with each income band, before peaking at the second-highest band (fourth quintile). With 262,000 first-time buyers, this income band accounted for three in ten (30%) sales for 2022-23. This is a slight decrease from the previous year where this band made up nearly a third (32%, 295,000) of the overall total.
Though the highest income band (fifth quintile) posted lower figures than the previous one (fourth quintile), its total of 242,000 first-time buyers was the second highest total overall.
UK first-time buyer statistics by title
Our data shows that between 2022-23, those applying for mortgages under the title ‘Mr’ made up nearly two thirds (65%) of first-time buyer mortgage quotes. On average, their typical loan amount was £207,778.
A breakdown of UK average mortgage for first-time buyers by title
| Title | Average loan amount (£) | Percentage of quotes (%) |
|---|---|---|
| Mr | 207,778 | 64.89 |
| Miss | 172,578 | 26.15 |
| Mrs | 223,525 | 5.15 |
| Ms | 194,904 | 3.82 |
(Source: Uswitch)
By contrast, more than a third (35%) of mortgage quotes were for ‘Miss,’ ‘Mrs,’ or ‘Ms,’ with a combined average loan amount of £197,002 (£10,000 less on average than their male counterparts).
Those applying under ‘Mrs’ received, on average, the highest loan amount at £223,525, while their unmarried counterparts applying under ‘Miss’ typically received quotes of £172,578.
UK first-time buyer statistics by mortgage type
First-time buyer stats show an almost even split between sole and couple first-time buyers in England. Of the 874,000 first-time buyers in 2022-23, 416,000 homes (47.6%) were in the household reference person’s (HRP) name only, while 422,000 homes (48.3%) were found to be in the name of both the HRP and their partner.
A breakdown of the percentage of first-time buyers in England by mortgage type in 2022-23
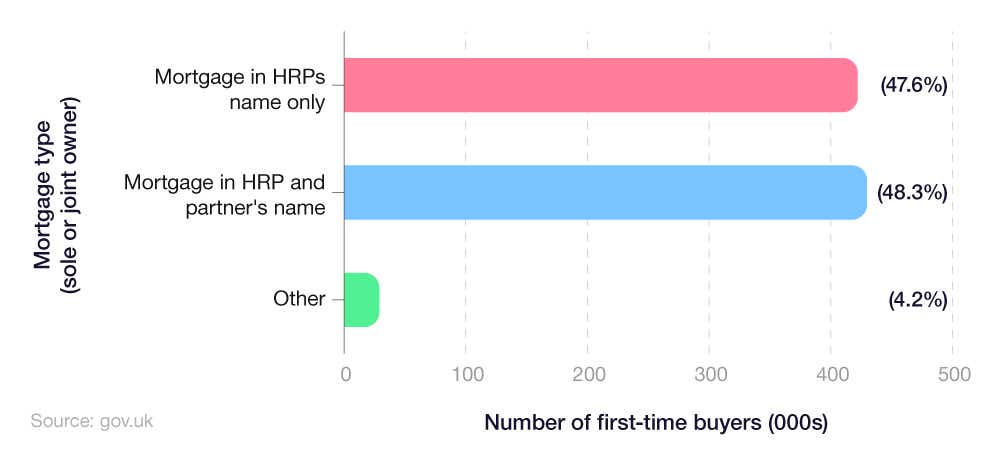
This data shows a reversal in majority share, as in 2021-22, 422,000 homes (49.5%) were in the HRP’s name only while 401,000 (47.1%) were in the name of both the HRP and their partner.
Browse our mortgage guides for expert advice on a range of topics relating to homeownership.
UK first-time buyer statistics by deposit income source
The latest first-time buyer report from the UK government shows that the vast majority of first-time buyers (87%) relied on savings as the primary source of their deposits (748,000 homes) in 2022-23.
This represents a slight increase from the previous year, when around 85% of first-time buyers saved for a deposit (704,000 homes), though this figure remains below the peak of 91% in 2020-21.
A breakdown of the number of first-time buyers in England by deposit income source in 2022-23
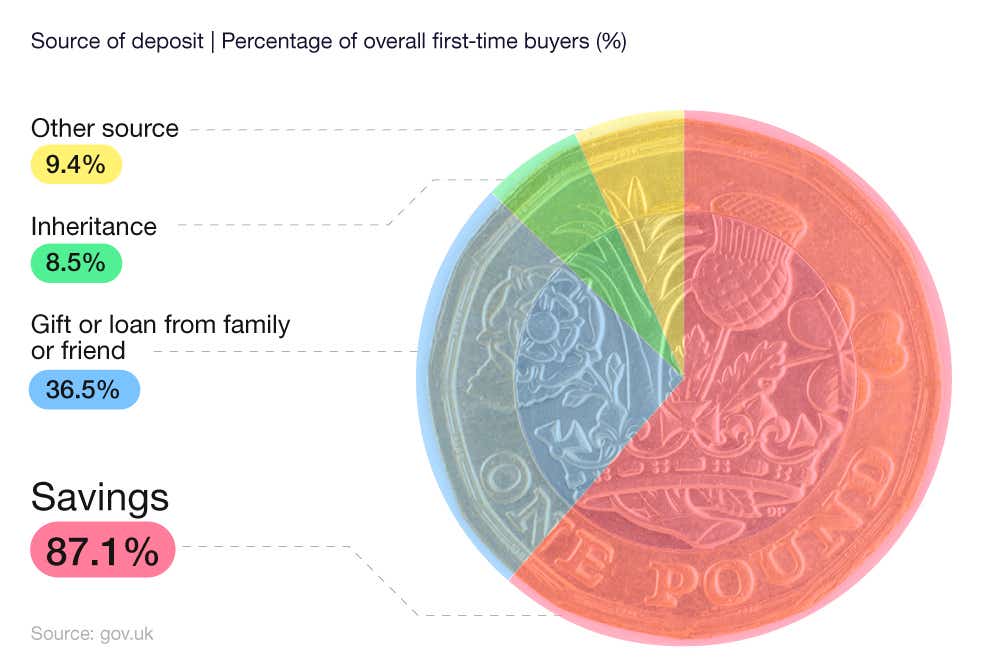
Almost two-fifths (37%) of UK first-time buyers received their deposit as a gift or loan from a friend or family member, making this the second most common source of first-time buyer deposits in 2022-23 (313,000). This is a large increase from the previous year, when just over a quarter (27)% purchased their home with a gifted deposit.
We can also reveal that almost one in 10 (9%) first-time buyers relied on inheritance to fund their deposits in 2022-23. This is a rise of 1% in 2021-22 and an increase from 68,000 to 73,000 homes.
What is the average deposit for first-time buyers in England?
£53,414
UK first-time buyer statistics by family type
Couples with no dependent children are the most common type of first-time buyers in England. This group accounted for two in five (40%) of the total purchases in 2022-23 (346,000 homes).
Lone parents with dependent children were the least likely household type among first-time buyers, accounting for just 2.1% of the overall figures. Representing 18,000 sales, this is a decrease from 26,000 in the previous year. This demographic is only marginally behind other multi-person households. With 20,000 homes, they accounted for 2.3% of first-time sales in 2022-23.
A breakdown of the UK first-time buyer statistics by household type in 2022-23
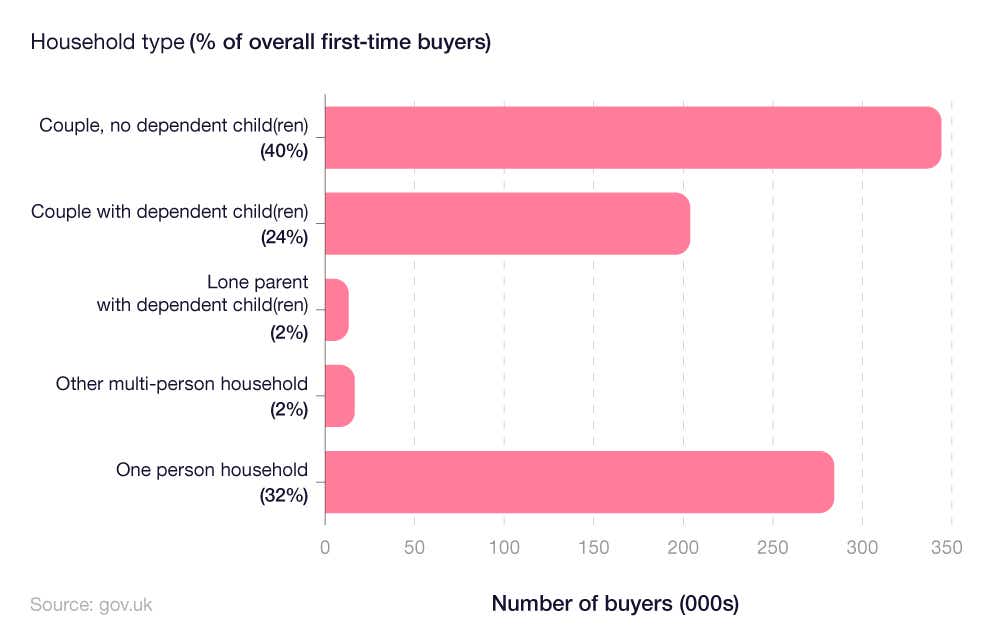
The second most popular type of first-time buyer to purchase a property in 2022-23 was single-person households. Around 283,000 homes were sold that year to this demographic, representing around a third (32%) of all first-time buyers.
UK first-time buyer statistics by property type
Our data shows that between 2022-23, more than seven in 10 (71%) first-time buyer mortgage quotes were for those intending to buy a house. This came with an average loan amount of £207,634. This is an increase on 2021-22, when houses accounted for more than two-thirds (68%) of quotes, with an average loan of £189,285
A breakdown of the UK average mortgage for first-time buyers by type of property
| Property type | Average loan amount (£) | Percentage of quotes (%) |
|---|---|---|
| House | 207,634 | 70.62 |
| Flat | 189,872 | 27.87 |
| Maisonette | 206,171 | 1.51 |
(Source: Uswitch)
By contrast, more than a quarter (28%) of quotes between 2022-23 were for flats, with an average loan amount of £189,872. This is nearly £18,000 less than the typical quote for first-time buyers purchasing a house – in the previous year quotes for flats were around £5,000 more than those for houses.
Maisonettes formed just 2% of total quotes between 2022-23, yet generated an average loan amount of £206,171 for UK first-time buyers.
UK first-time buyer statistics by region
The average mortgage amount for first-time buyers decreased between 2022 and 2023 in five regions of the UK – London, the East of England, the South West, the North East, and Scotland.
A regional breakdown of the average mortgage for UK first-time buyers in 2022 and 2023
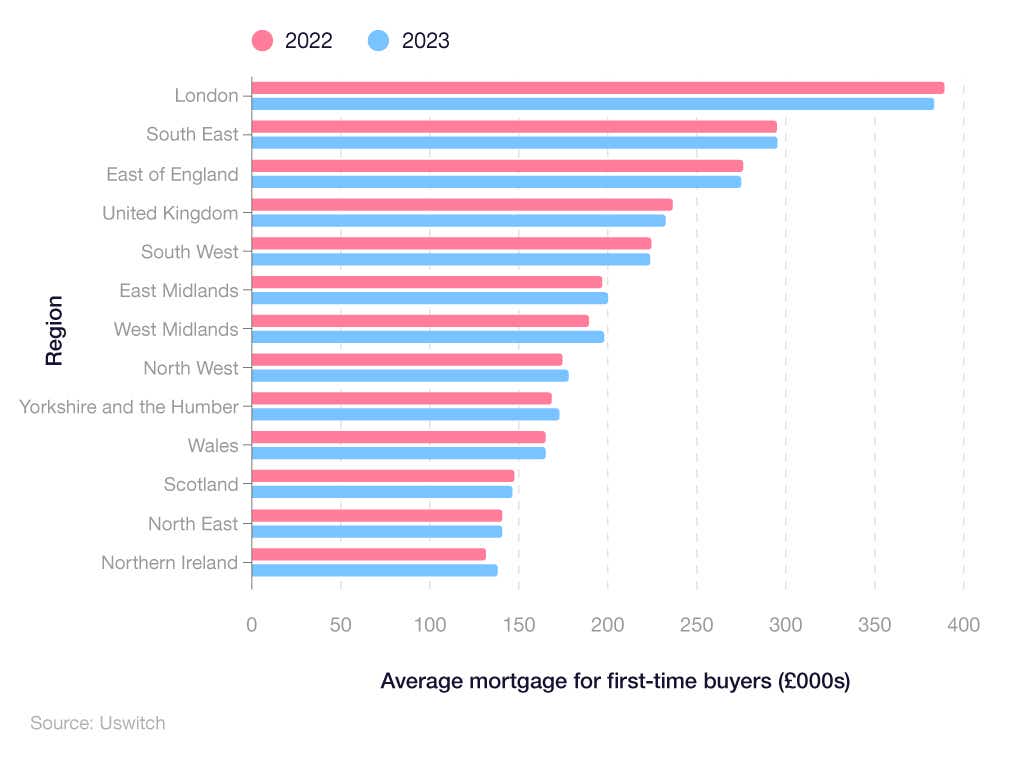
The UK as a whole also faced a decrease in the average mortgage amount for those purchasing their first property. In 2023, the average cost of a first-time mortgage was £234,722, down 2.01% from the previous year (£239,537).
Greater London faced the greatest decrease in average mortgage amounts afforded to first-time buyers, dropping 1.91% to £383,386 in 2023 (from £390,848).
The region with the greatest increase in average mortgage amounts between 2022 and 2023 was Yorkshire and the Humber, rising 3.05% to £170,970 (from £165,914).
First-time buyer opinion statistics 2023 (exclusive data)
Our exclusive first-time buyer survey found that around two in five (40%) of non-homeowners in the UK do not intend to buy a home within the next five years. Of these, more than half (53%) referenced affordability as the primary reason for not buying a home, with a further quarter (26%) citing the recession.
The number of people intending to buy a home was far higher amongst those aged between 25-34, with only around 25% of respondents in this age group claiming they do not intend to buy a home within the next year.
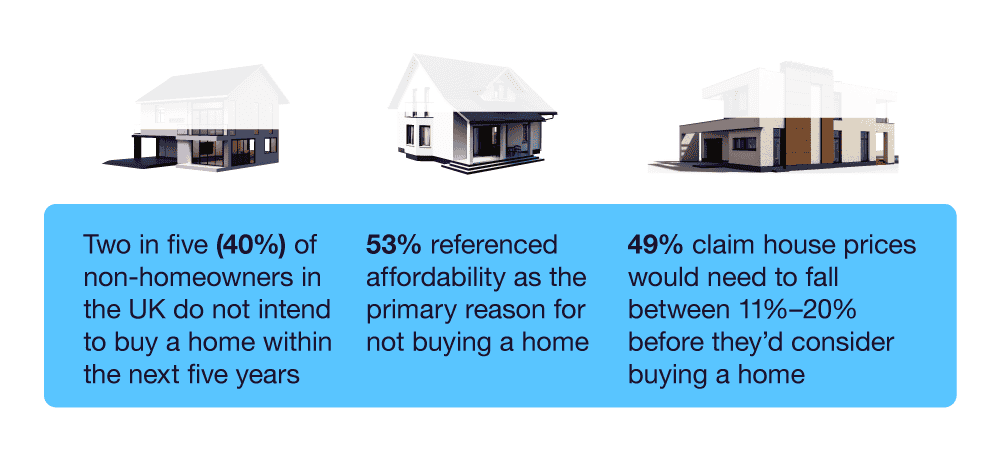
Almost half (49%) of the people interviewed claimed that house prices would need to fall between 11%-20% before they’d consider buying a home, with a further 13% claiming prices would need to drop more than 20%.
Around 25% of respondents predicted that their budget for buying a home would be £150,000 or less. This figure is almost 50% lower than the October 2022 average UK house price of £295,000. More than half (57%) believed their budget would be no higher than £300,000.
UK first-time buyers deposit statistics
According to UK house price statistics, the average first-time buyer house price decreased by 1.4% in the year to December 2023, to £237,655.
Based on an average rate of saving from an average UK income between October and December 2023, it now takes 12 years for a typical UK first-time buyer to save enough money for a house deposit. This is also assuming it is a standard, instant-access savings account. If the first-time buyer were to transfer their money to a cash ISA with the same rate, the amount of time required to save would drop to 11 years.
UK Finance suggests a typical deposit for a UK first-time property purchase in 2023 was around a fifth (19%) of the property purchase price, down from just under a quarter (23%) in 2019.
Compare first-time-buyer mortgage rates to ensure you get the best deal whether you're a first-time buyer, a homemover, or remortgaging your current home.
A breakdown of the average deposits for UK first-time buyers in 2022 and 2023
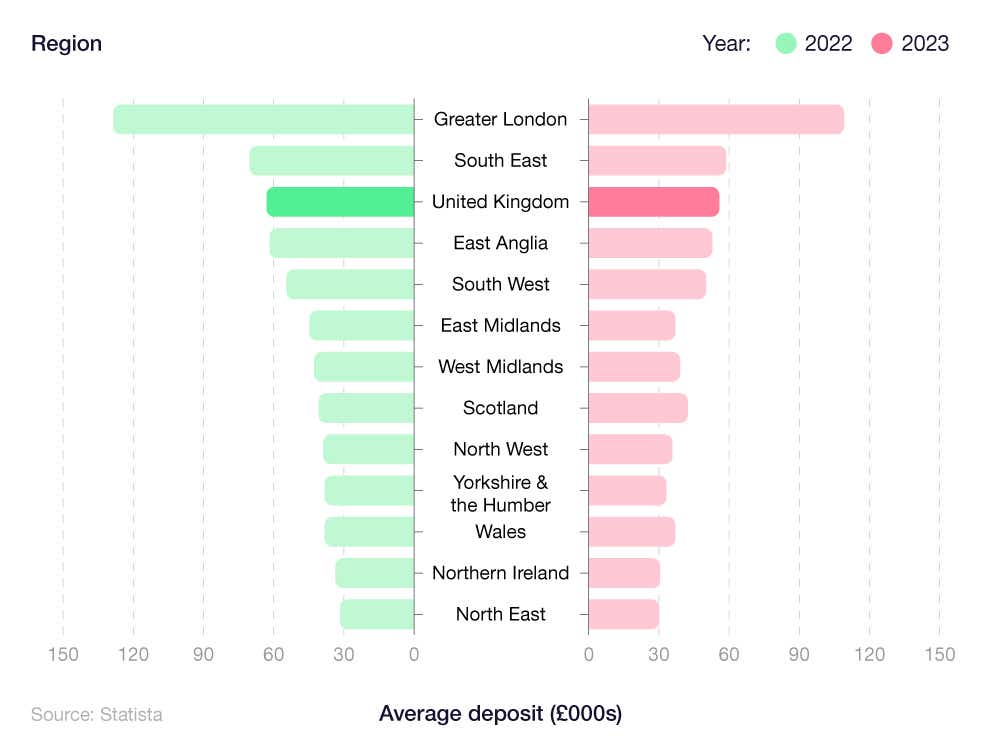
The average deposit for first-time buyers has decreased in all areas of the UK since 2022.
Based on the average deposit for first-time buyers statistics from 2023, this figure stood at £53,414 - down over £9,000 from the average in 2022 (£62,471).
Admittedly, Greater London skews this average somewhat, with an average first-time buyer deposit of £108,848 in 2023 – though this is down by 14.51% from 2022 (£127,320). The 2023 figure re
presents more than double (+103.78%) the average deposit paid by first-time buyers in the United Kingdom as a whole for the year, £53,414.
In Scotland, the average first-time buyer deposit in 2023 cost around £39,691, over £2,000 less than in 2022, at £41,487 (-4.33%). Moreover, first-time buyers in Wales parted with an average of £36,350 for their deposits (-2.75%), while this figure was £31,948 for those in Northern Ireland (-3.68%).
First-time buyers in the North East had the smallest average deposit in 2023, at £29,740 – more than three times less than the average deposit for first-time buyers in London.
FAQs about first-time buyers
How many first-time buyers are there in the UK?
According to the latest first-time buyer statistics, there were around 874,000 first-time buyers in the UK between 2022-23 (approximately 22,000 more compared to 2021-22).
How does a mortgage work for first-time buyers?
As a first-time buyer, you will usually need to save at least 5% of the intended property purchase value to act as a deposit. Some lenders may require more than 5% depending on your financial circumstances and their eligibility criteria. The remaining money is borrowed from a lender, such as a bank or building society, and is secured against the value of your house until it is paid off.
What are the requirements for first-time home buyers?
In order to qualify as a first-time buyer, you must have never owned a residential property before. This includes inheriting a property or being added to the deeds. If you are applying for a joint mortgage, then both parties must meet these criteria in order for you to be classed as a first-time buyer. This includes owning residential properties overseas, or a commercial property (such as a pub) that has a residential element attached to it.
How much can first-time buyers borrow?
Lenders will traditionally offer between four and five times the salary earnings of the prospective homeowner. While that may restrict how much you can borrow for a mortgage, certain government schemes can help you to get onto the property ladder faster.
How much deposit is needed for first-time buyers?
In terms of monetary value, the mean average deposit for first-time buyers in England in 2021-22 was £43,693, with a median of £30,000. However, this very much depends on where you live within the country and whether you opt into a scheme.
Can first-time buyers rent their property in the UK?
Yes, it’s possible for a first-time buyer to obtain a buy-to-let mortgage and subsequently rent out their property in the UK. Some lenders may view you as high-risk, and therefore you may have to put down a larger-than-normal deposit if you want to proceed. However, this is not always the case and each lender will have their own individual policy and eligibility criteria when it comes to granting mortgages to first-time buyers.
Glossary
First-time buyer
A first-time buyer relates to anyone who is purchasing their first residential property. They must never have owned, or had a residential property in their name before, either in the UK or overseas.
First Homes Scheme
The First Homes Scheme was introduced by the UK Government in 2021 in order to help first-time buyers by offering at least 30% discount on property purchases in their local area.
Help to Buy
Help to Buy was introduced in 2013 by the UK Government to help first-time buyers get onto the property ladder.
Help to Buy equity loan scheme
The Help to Buy equity loan scheme allows first-time buyers to purchase a property with a 5% deposit. The Government will supply another 5% to make the final deposit up to 10% of the intended property purchase value.
Household dependant
A household dependent is regarded in the UK as any family member or relative that lives with you, and highly depends on you due to an illness, disability, or age. It’s most commonly used to describe those under the age of 18, but can be extended to other family members who meet this eligibility criteria.
Interest rates
The proportion of a loan that is charged to the borrower on top of their agreed repayment schedule. This is normally expressed as a percentage of the outstanding loan. In the UK, interest rates for mortgages can be fixed (i.e. will not change over a given time) or variable (liable to fluctuations).
Inflation rates
The rate at which prices increase over a given time period, resulting in a decrease in the purchasing value of money.
Lifetime Individual Savings Account (LISA)
A Lifetime Individual Savings Account (LISA) was launched in 2016 as a long-term replacement for the Help to Buy ISA. Although, this is not exclusive for first-time buyers, and can be used to fund retirement.
Mortgage Guarantee Scheme (MGS)
The Mortgage Guarantee Scheme (MGS) supports first-time buyers to purchase a home with a 5% deposit, and offers lenders the financial guarantee they need in order to cover the remaining 95% of the mortgage.
Right-to-Acquire Scheme
The Right-to-Acquire Scheme is similar to the Right-to-Buy-Scheme (see below). However, the discounts offered are usually less, and provided at a flat rate regardless of how long someone has lived in the property.
Right-to-Buy Scheme
The Right-to-Buy Scheme was introduced in 1980 by the UK Government to allow those living in council houses the right to purchase their home at a discounted rate. The scheme is currently only available in England and Northern Ireland.
Shared Ownership Scheme
The Shared Ownership Scheme allows first-time buyers the opportunity to own a share in a property. As the purchaser is not buying the whole property, they only need a mortgage to cover their percentage share, therefore reducing the deposit needed and amount to be borrowed.
Stamp duty land tax (SDLT)
Stamp duty land tax (SDLT) is a compulsory fee incurred when buying a property or land over a certain price in England and Northern Ireland. In Scotland, this is known as Land and Buildings Transaction Tax, and in Wales just Land Transaction Tax, and is subject to its own individual criteria.
Methodology and sources
https://www.statista.com/statistics/557891/first-time-buyer-average-deposit-by-region-uk/
https://www.ons.gov.uk/economy/inflationandpriceindices/bulletins/housepriceindex/december2022
https://www.statista.com/statistics/557891/first-time-buyer-average-deposit-by-region-uk/
https://www.gov.uk/government/statistics/main-tax-expenditures-and-structural-reliefs
https://www.ftadviser.com/mortgages/2022/12/22/natwest-withdraws-from-mortgage-guarantee-scheme/
https://www.ftadviser.com/mortgages/2022/12/20/govt-extends-mortgage-guarantee-scheme-by-a-year/
https://www.gov.uk/government/collections/Help-to-Buy-equity-loan-and-newbuy-statistics
https://www.gov.uk/government/statistics/Help-to-Buy-equity-loan-scheme-data-to-31-march-2022
https://www.manchestereveningnews.co.uk/news/property/first-time-buyers-just-weeks-26351092
https://media.quilter.com/search/lifetime-isa-withdrawal-charges-more-than-triple-during-lockdown/
https://researchbriefings.files.parliament.uk/documents/CBP-8828/CBP-8828.pdf
https://www.statista.com/statistics/650798/initiated-dwellings-by-country-europe/
https://www.gov.uk/right-to-buy-buying-your-council-home/discounts
https://www.bbc.co.uk/news/business-63005427
Which are most affordable for first-time buyers to buy their home? (exclusive data)
https://www.ros.gov.uk/data-and-statistics/house-price-statistics
Which universities offer the most affordable conditions for first-time buyers? (exclusive data)
https://www.hesa.ac.uk/data-and-analysis/graduates/table-26
https://www.hesa.ac.uk/data-and-analysis/graduates/table-2
https://www.hesa.ac.uk/data-and-analysis/students/table-62
https://www.rightmove.co.uk/house-prices/glasgow
https://commonslibrary.parliament.uk/research-briefings/cbp-8456/
https://www.nomisweb.co.uk/sources/aps
https://www.hesa.ac.uk/data-and-analysis/sb263/figure-14
Which places do Help to Buy equity loans make up the highest percentage of home value?
https://www.gov.uk/government/statistics/help-to-buy-equity-loan-scheme-data-to-30-september-2022
https://statswales.gov.wales/Catalogue/Housing/Help-To-Buy/averageequityloan-by-la-ftb
https://statswales.gov.wales/Catalogue/Housing/Help-To-Buy/completedpurchases-by-la-ftb
Read more like UK first-time buyer statistics 2023