- Uswitch.com>
- Mortgage guides>
- UK Mortgage Statistics 2024 - Facts and Stats Report | Uswitch.com
UK Mortgage Statistics 2024
This refreshed page includes relevant mortgage statistics for 2024, such as the number of mortgage approvals, what the average UK mortgage looks like across different demographics, as well as mortgage repayment statistics and average mortgage debt.

For many people, a mortgage will be the most expensive financial product they take out in their lifetime. The UK mortgage market is in a constant state of flux and influenced by numerous variables from interest rates to property availability.
Using new and refreshed data, our research allows us to compare mortgage statistics over time and analyse key trends in the UK mortgage market.
By compiling the latest UK mortgage data for 2024, this page aims to provide you with the most up-to-date figures on the UK mortgage landscape and help you make informed decisions about your current and future mortgage deals.
Top UK mortgage statistics 2024
According to the Bank of England (BoE), the average UK mortgage was £184,445 in Q1 2024.
There were 279,606 mortgage transactions in the first three months of 2024, totalling more than £51.5 billion.
The most common age group for a mortgage in the UK in 2023-24 was 30-39, accounting for over a third (36.44%) of Uswitch consumer quotes for the year.
Houses were the most popular property type for a mortgage in 2023-24, constituting almost 80% of quotes for the year at an average of £179,116.
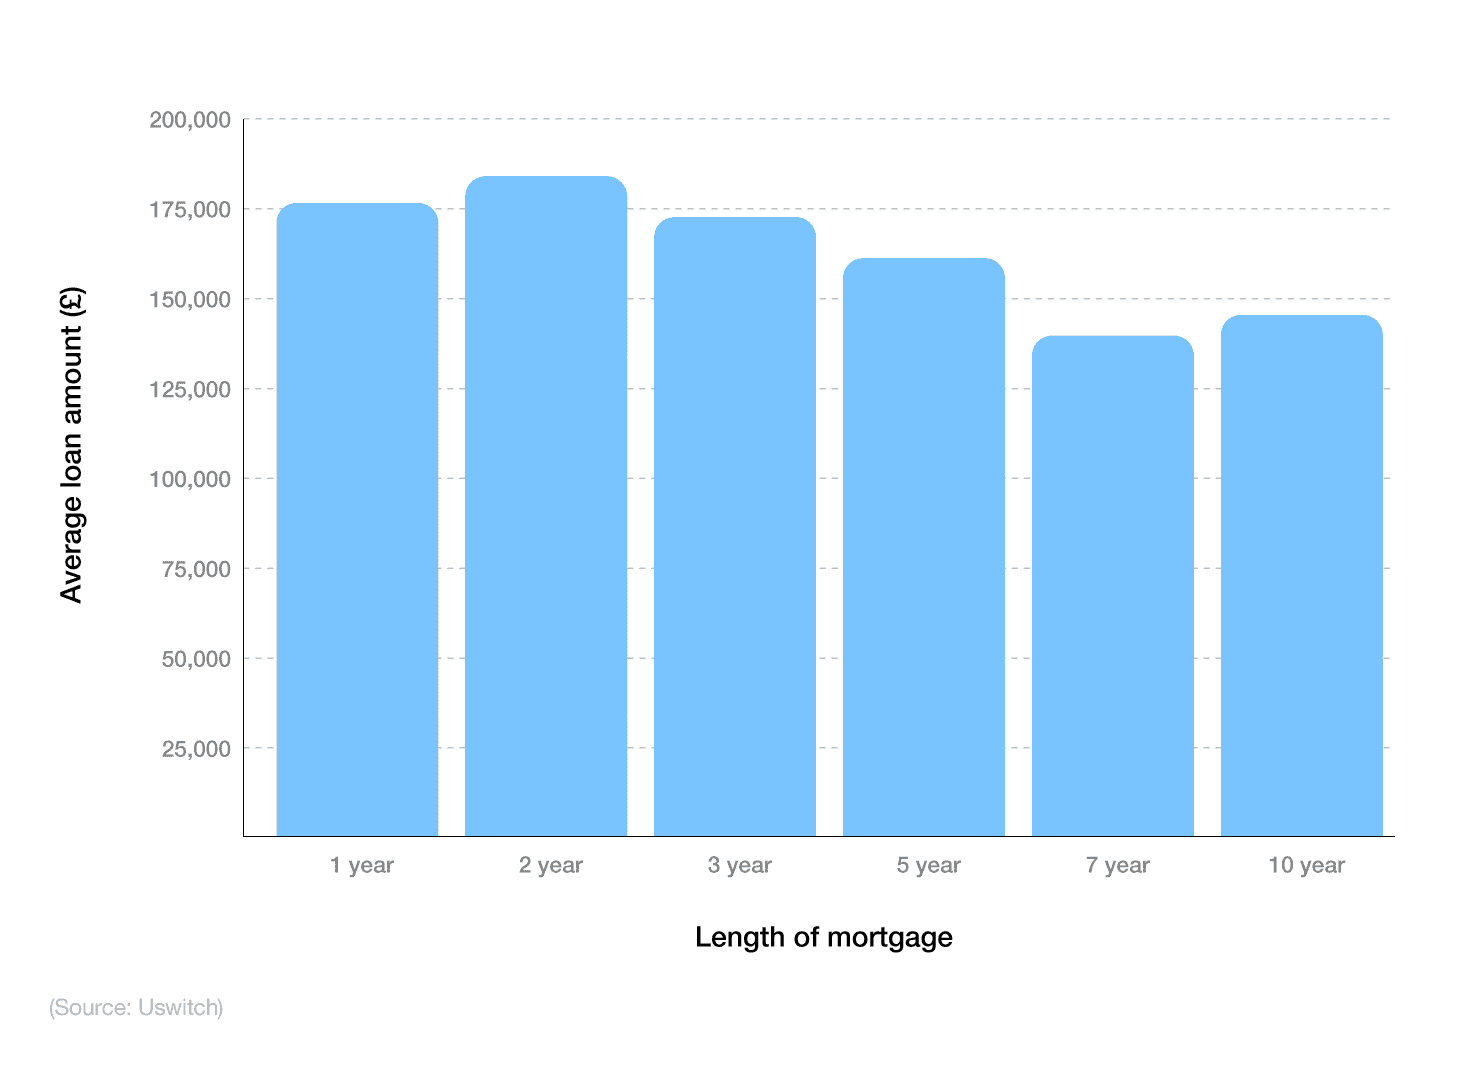
Around two-thirds (63.43%) of mortgages in the UK are two years in length, with an average value of £182,263.
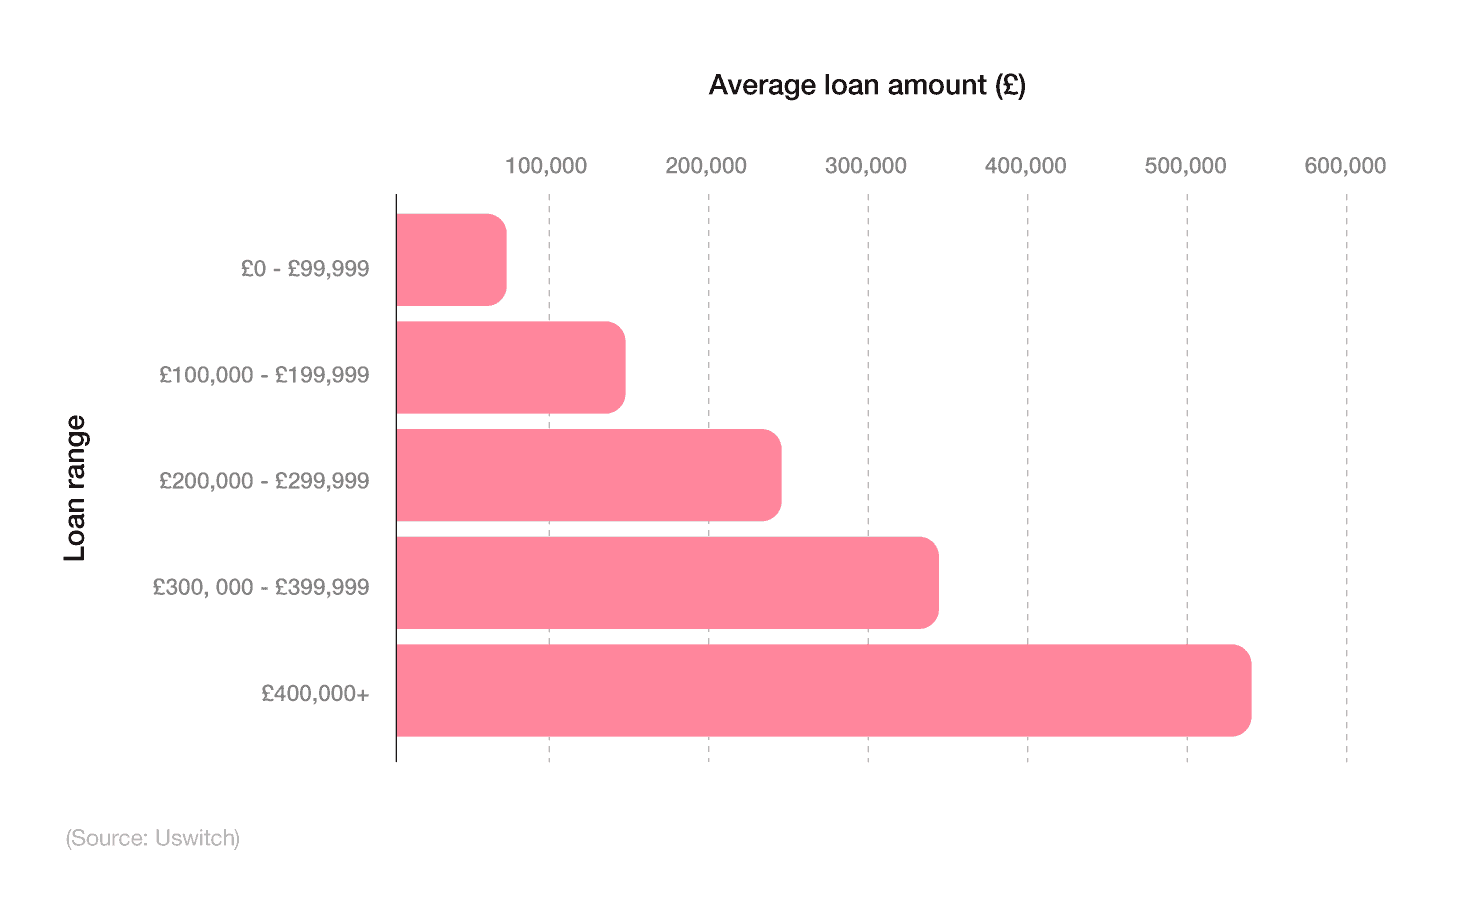
Most UK mortgages are between £100,000 and £199,999, accounting for more than two in five (42.7%) of Uswitch quotes between 2023-24.
Around one in six (17.51%) of mortgages in 2023-24 were from London at an average of £266,822 - the most popular UK region for mortgages.
As of March 2024, there were approximately 61,325 mortgage approvals in the UK – a 1.4% increase from the previous month.
By the end of 2023, around one in three (31.52%) of the UK mortgage market was home movers - a 4% rise from the start of 2023.
Research from Apex Bridging found that mortgage-related fraud increased by around a third (32.8%) between 2022 and 2023 – the second-highest increase of all banking and credit industry fraud.
Average UK mortgage statistics
How much is the average mortgage in the UK?
As of Q1 2024, the average UK mortgage was approximately £184,445. This is based on quarterly calculations from the BoE of 279,606 mortgage transactions totalling around £51.6 billion.
A breakdown of average UK mortgage statistics between 2023-24
| Month and year | Number of mortgage transactions | Total value of mortgages (£mn) | Average UK mortgage |
|---|---|---|---|
| Q1 2023 | 314,854 | 59,845 | 190,072 |
| Q2 2023 | 291,667 | 51,101 | 175,203 |
| Q3 2023 | 321,452 | 52,415 | 163,057 |
| Q4 2023 | 289,964 | 46,360 | 159,882 |
| Q1 2024 | 279,606 | 51,572 | 184,445 |
(Source: Uswitch via BoE)
The average UK mortgage decreased throughout 2023 by almost a sixth (15.9%) to a low of £159,882 in Q4 2023.
During this time, the number of mortgage transactions also fell by around 7.9%, from almost 315,000 at the start of the year, down to less than 290,000 by Q4 2023.
The total value of UK mortgages also dropped by more than a fifth (22.5%) throughout 2023, from £59.8 billion in Q1 to almost £46.4 billion in Q4.
Average UK mortgage statistics by age group
Based on Uswitch consumer data between January and December 2023, the majority of UK mortgages were requested by those aged 30-39, making up more than a third (36.44%) of total quotes. This was followed closely by 40-49-year-olds, who made up roughly one in three (32.47%).
A breakdown of the UK average mortgage statistics by age group
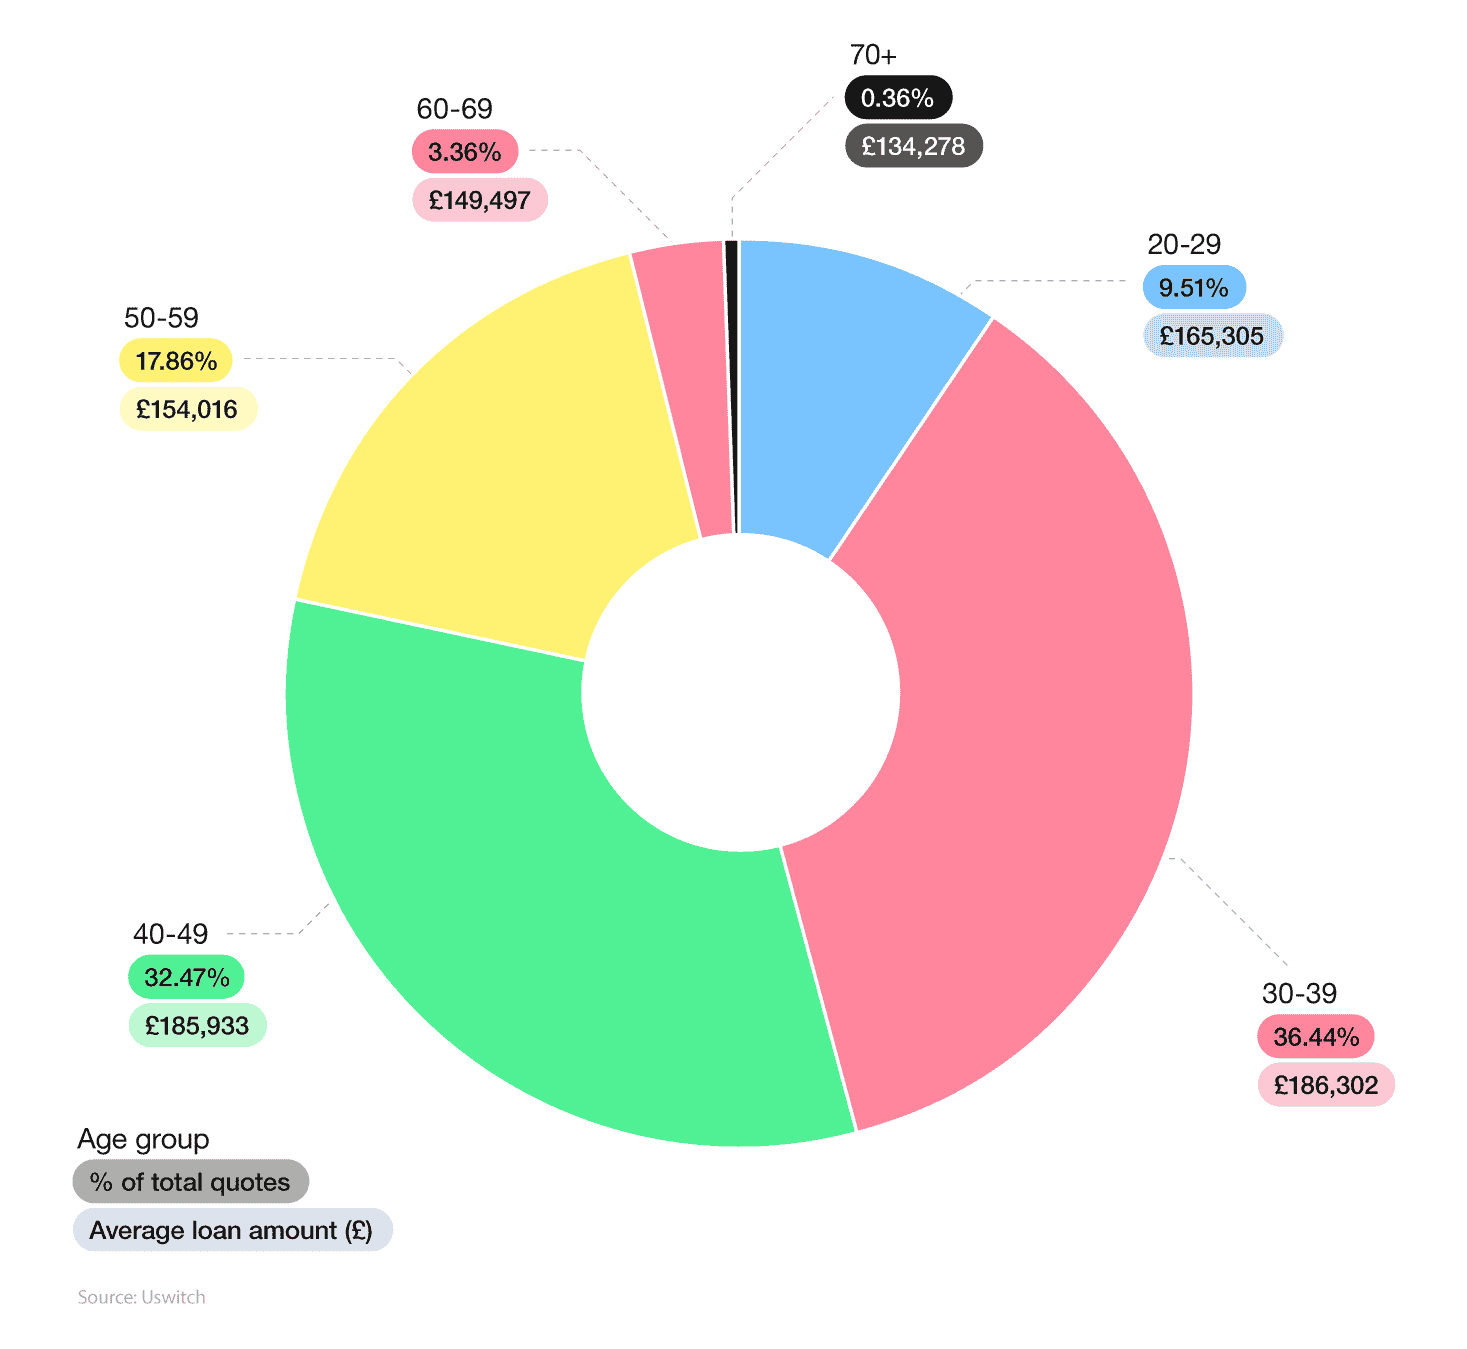
The average mortgage for these age groups was £186,302 and £185,993, respectively. This was around a third (32.5%) more than the typical mortgage for those aged 70 and above – the least common age group from our study.
Despite less than 1% of mortgage quotes coming from those aged 70 plus at an average of £134,278, this shows that it’s still possible to get a mortgage when you’re older.
What is the average age to get a mortgage in the UK? 34
Average UK mortgage statistics by employment status
The vast majority of Uswitch customers requesting a mortgage throughout 2023 were in some form of employment. This accounted for almost nine in 10 (88.28%) mortgage quotes across the year, with an average mortgage value of £177,854.
A breakdown of average UK mortgage by employment status
| Employment status | Average loan amount | % of total quotes |
|---|---|---|
| Unemployed / retired | £169,016 | 8.71% |
| Employed | £177,854 | 88.28% |
(Source: Uswitch)
By contrast, those unemployed or retired made up less than one in nine (8.71%) quotes throughout 2023, with an average mortgage loan amount of £169,016 – around 5% less than the typical mortgage for those employed.
Average UK mortgage statistics by property type
Around four in five (79.97%) of Uswitch mortgage quotes for 2023 were from those looking to buy a house. This produced an average mortgage of £179,116.
A breakdown of the UK average mortgage by type of property
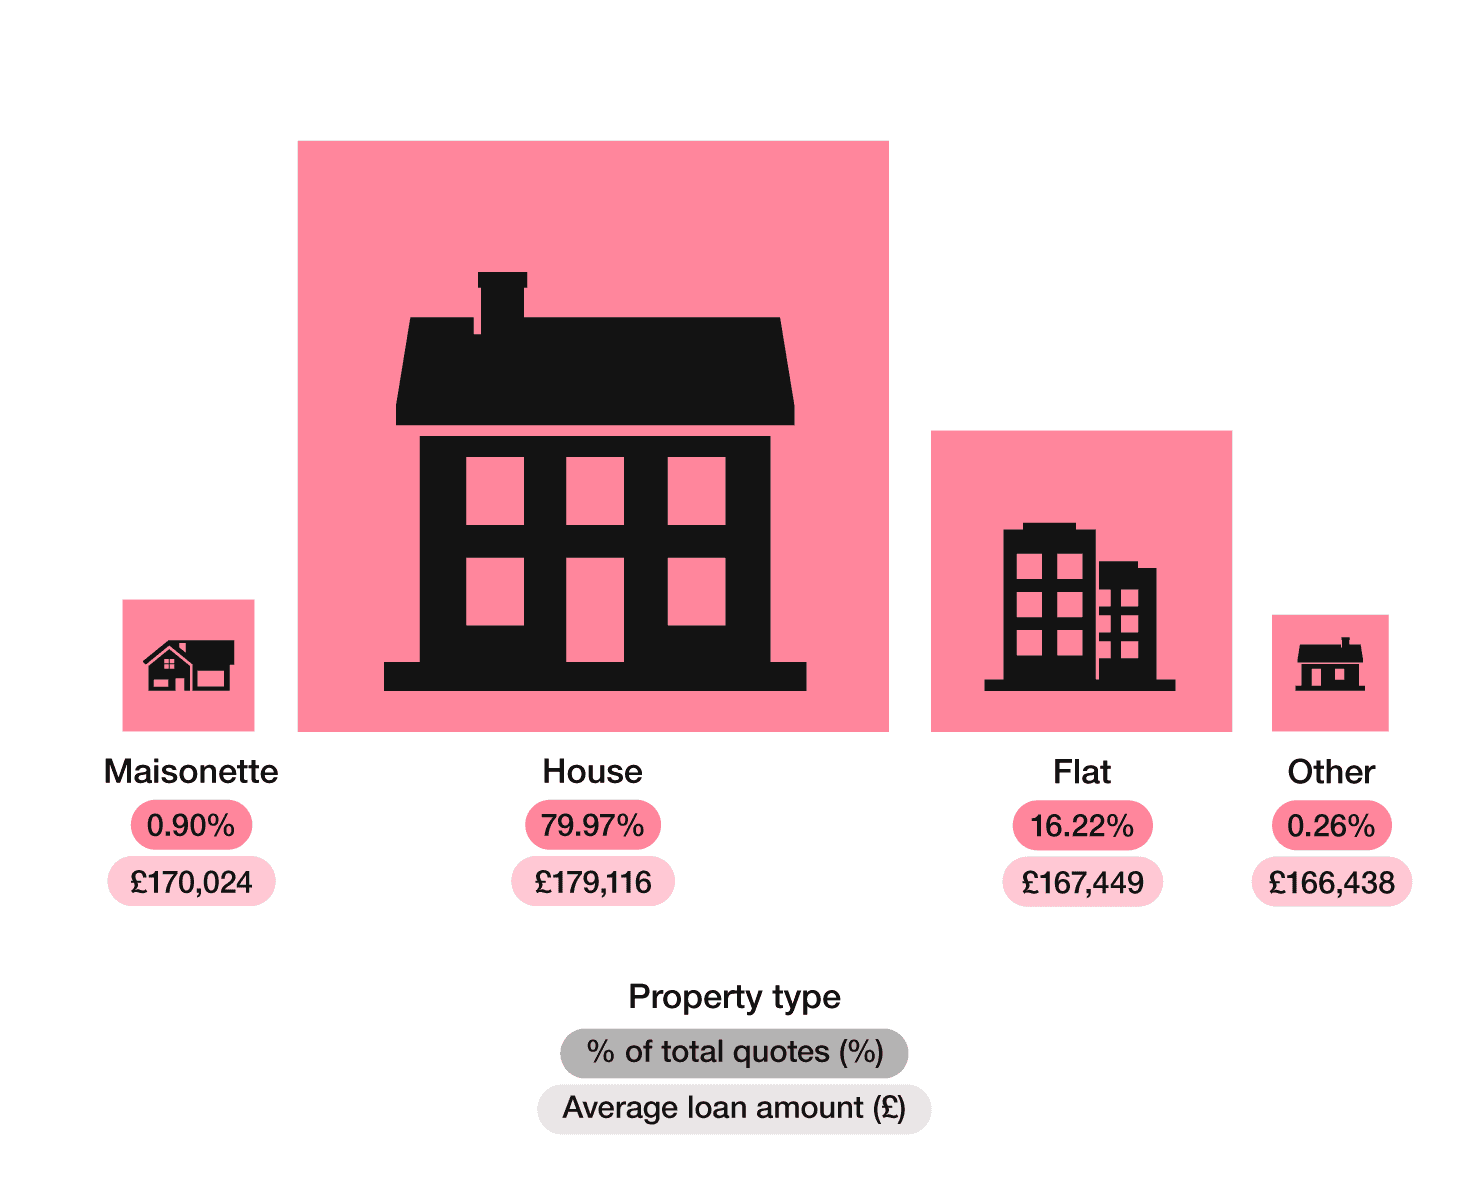
This was followed by flats, which accounted for around one in six (16.22%) of quotes for 2023 and an average mortgage value of £167,449 – about 6.7% less than the typical mortgage for a UK house.
Average UK mortgage statistics by occupancy status
The most common type of occupancy status for Uswitch mortgage customers in 2023 was for a lived-in property. This accounted for around nine in 10 (88.61%) quotes between January and December, with an average mortgage of £182,447.
A breakdown of the UK average mortgages by occupancy status
| Occupancy status | Average loan amount | % of total quotes |
|---|---|---|
| Additional property | £247,863 | 0.45% |
| Live in property | £182,447 | 88.61% |
| Rent it out | £144,002 | 10.93% |
(Source: Uswitch)
By contrast, almost one in 11 (10.93%) of Uswitch consumers in 2023 were after a mortgage for a property that was being rented out. The typical mortgage for a rental property during this time was £144,002 – almost a quarter (23.6%) less than a lived-in property.
Additional properties accounted for less than one in 100 (0.45%) quotes throughout 2023. Yet, they produced the highest average mortgage value across all occupancy types (£247,863) – almost £100,000 more than the typical mortgage for a UK rental property.
Average UK mortgage statistics by length of mortgage
The most common mortgage length for Uswitch customers in 2023 was two years. This accounted for almost two-thirds (63.43%) of quotes across the year with an average mortgage value of £182,263.
A breakdown of the UK average mortgages by mortgage length
| Length of mortgage | Average loan amount | % of total quotes |
|---|---|---|
| 1 year | £175,026 | 1.93% |
| 2 year | £182,263 | 63.43% |
| 3 year | £173,076 | 6.54% |
| 5 year | £166,710 | 27.33% |
| 7 year | £141,757 | 0.12% |
| 10 year | £147,734 | 0.65% |
(Source: Uswitch)
More than a quarter (27.33%) of quotes were for five-year mortgage deals with an average mortgage size of £166,710 – almost 9% less compared to a typical two-year mortgage.
Seven-year mortgages produced the smallest average mortgage cost in 2023 (£141,757), yet only accounted for 0.12% of all quotes for the year.
How long is the average mortgage in the UK? 2 years
Average UK mortgage statistics by loan amount
Around two in five (42.7%) of Uswitch customers in 2023 were looking for a mortgage between £100,000 and £199,999. This produced an average mortgage amount of £143,019.
A breakdown of the UK average mortgage amount
| Loan range | Average loan amount | % of total quotes |
|---|---|---|
| £0 - £99,999 | £71,680 | 26.33% |
| £100,000 - £199,999 | £143,019 | 42.70% |
| £200,000 - £299,999 | £242,294 | 18.41% |
| £300,000 - £399,999 | £342,064 | 7.55% |
| £400,000+ | £532,684 | 5.01% |
(Source: Uswitch)
Customers looking to borrow less than £100,000 were the next most common mortgage loan range, accounting for just over a quarter (26.33%) of quotes throughout the year. This yielded an average mortgage value of £71,680.
Around one in 20 (5.01%) of Uswitch consumers sought a mortgage above £400,000 in 2023, with an average loan amount of £532,684.
Average UK mortgage statistics by region
The most popular UK region for Uswitch mortgage quotes in 2023 was Greater London, accounting for less than a fifth (17.51%) of the overall total. This produced an average London mortgage of £266,822 – the highest of all UK regions.
This was followed by the South East with an average mortgage value of £210,877. With around one in 11 (11.44%) quotes from the South East, this region was almost a quarter (23.4%) less than the average London mortgage.
A breakdown of the UK average mortgage by region
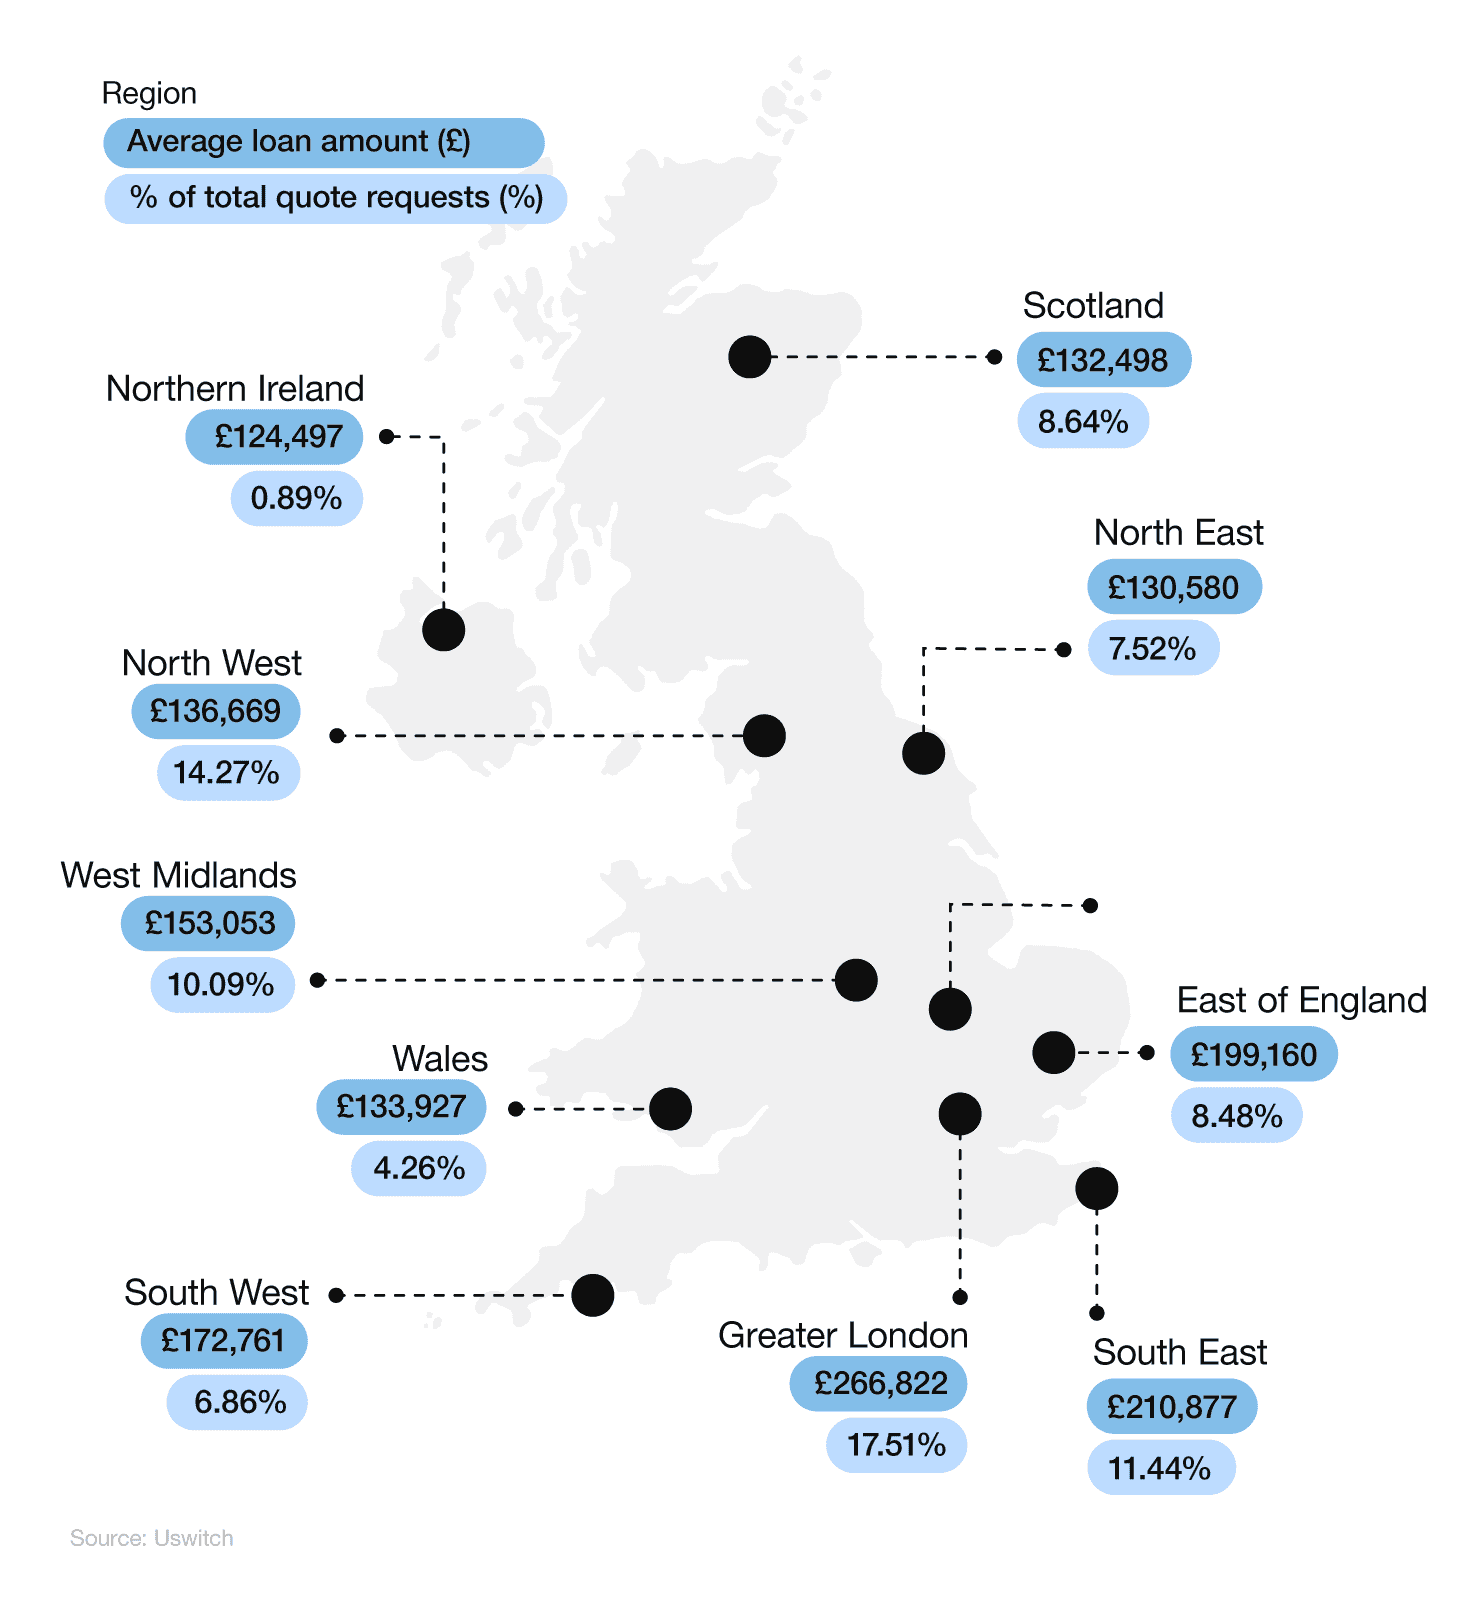
By contrast, the UK region with the lowest average mortgage for 2023 was Northern Ireland. Based on Uswitch consumer quotes between January and December 2023, the typical mortgage for a property in Northern Ireland was just under £125,000 – more than half the amount compared to London.
This makes the UK average mortgage around £163,358, meaning the average mortgage in Scotland and Wales is around £30,000 less compared to the rest of the country.
Average UK mortgage statistics by city
In 2023, around one in eight (8.24%) Uswitch mortgage quotes were from those looking to buy in London. This generated an average mortgage of around £282,000, making it one of the most expensive cities in the UK for a mortgage.
A breakdown of the most common UK cities for mortgage applications and their average loan amount
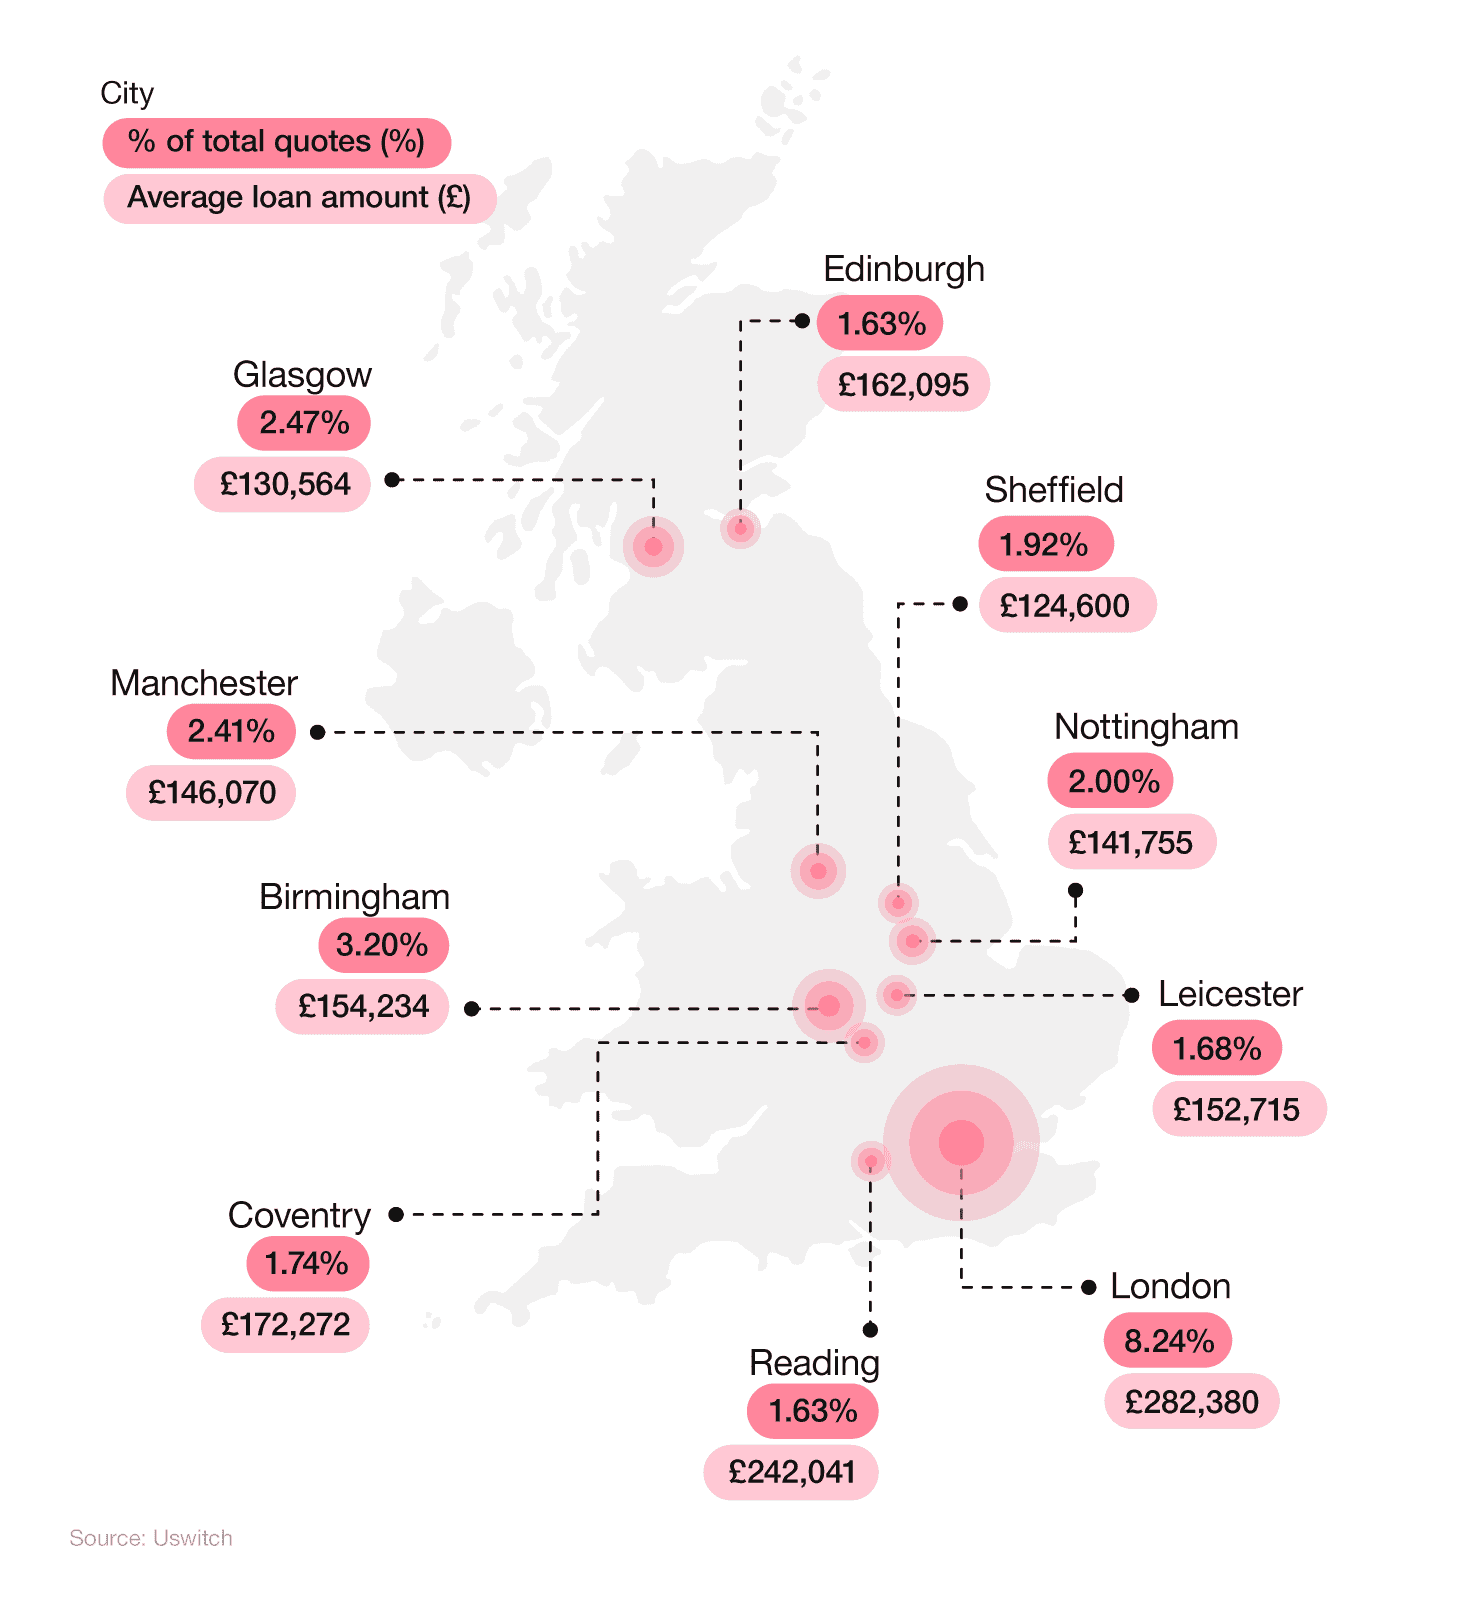
Birmingham is the next most popular UK city for mortgage quotes in 2023 (3.2%), with an average mortgage of around £154,000 – around three-fifths (58.7%) compared to the typical property in London.
Glasgow and Manchester both accounted for less than 2.5% of mortgage quotes in 2023, with respective average mortgage values of £130,564 and £146,070.
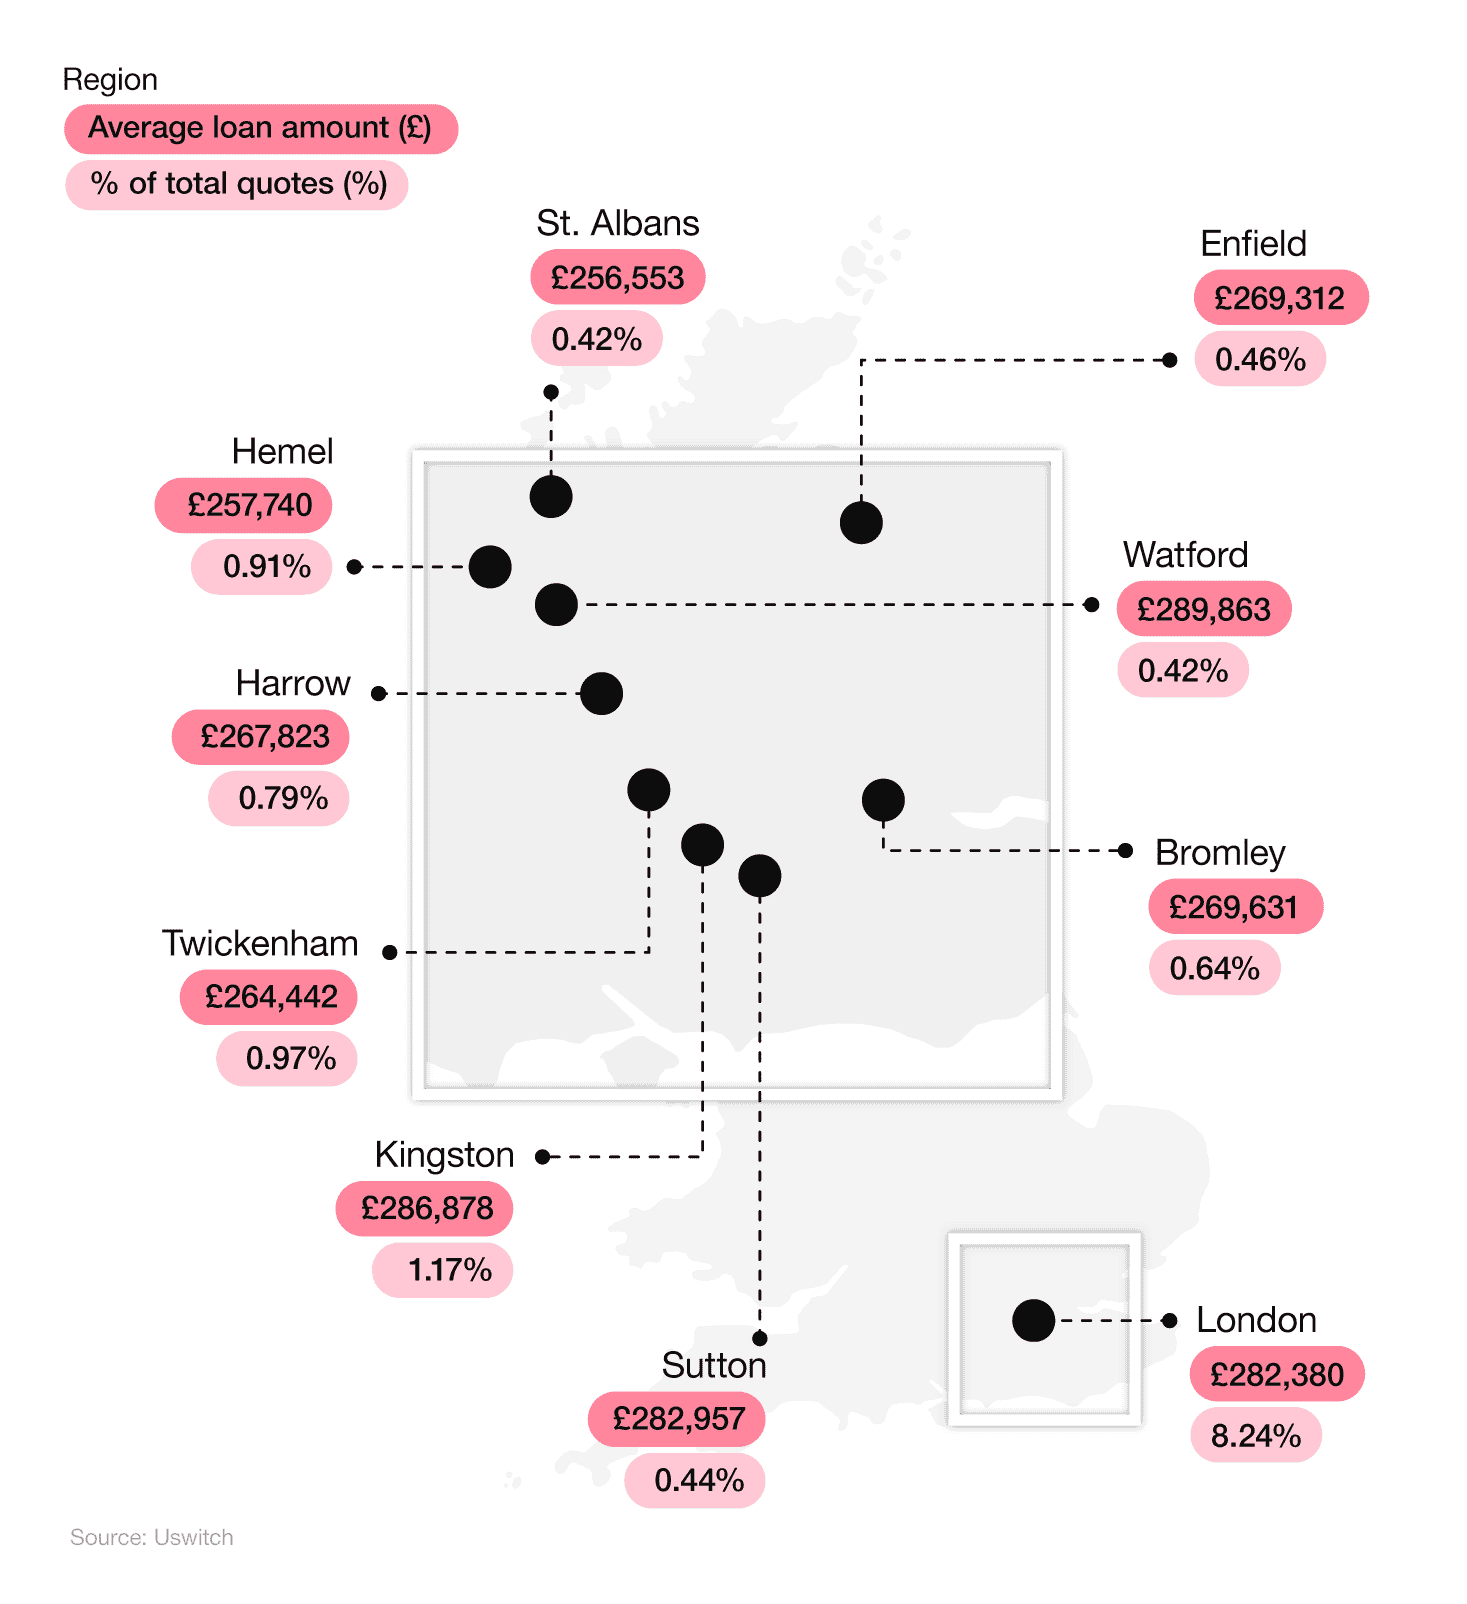
Based on Uswitch consumer data, the UK’s highest average mortgage in 2023 was located in Watford, with a typical mortgage of £289,863. This was around £3,000 greater than the average mortgage for properties in Kingston and around £7,000 more than those in Sutton and London.
Perhaps unsurprisingly, all of the 10 towns/cities with the highest average mortgages in the UK are located in either London, the South East, or the East of England.
A breakdown of the UK’s lowest average mortgage applications by town/city
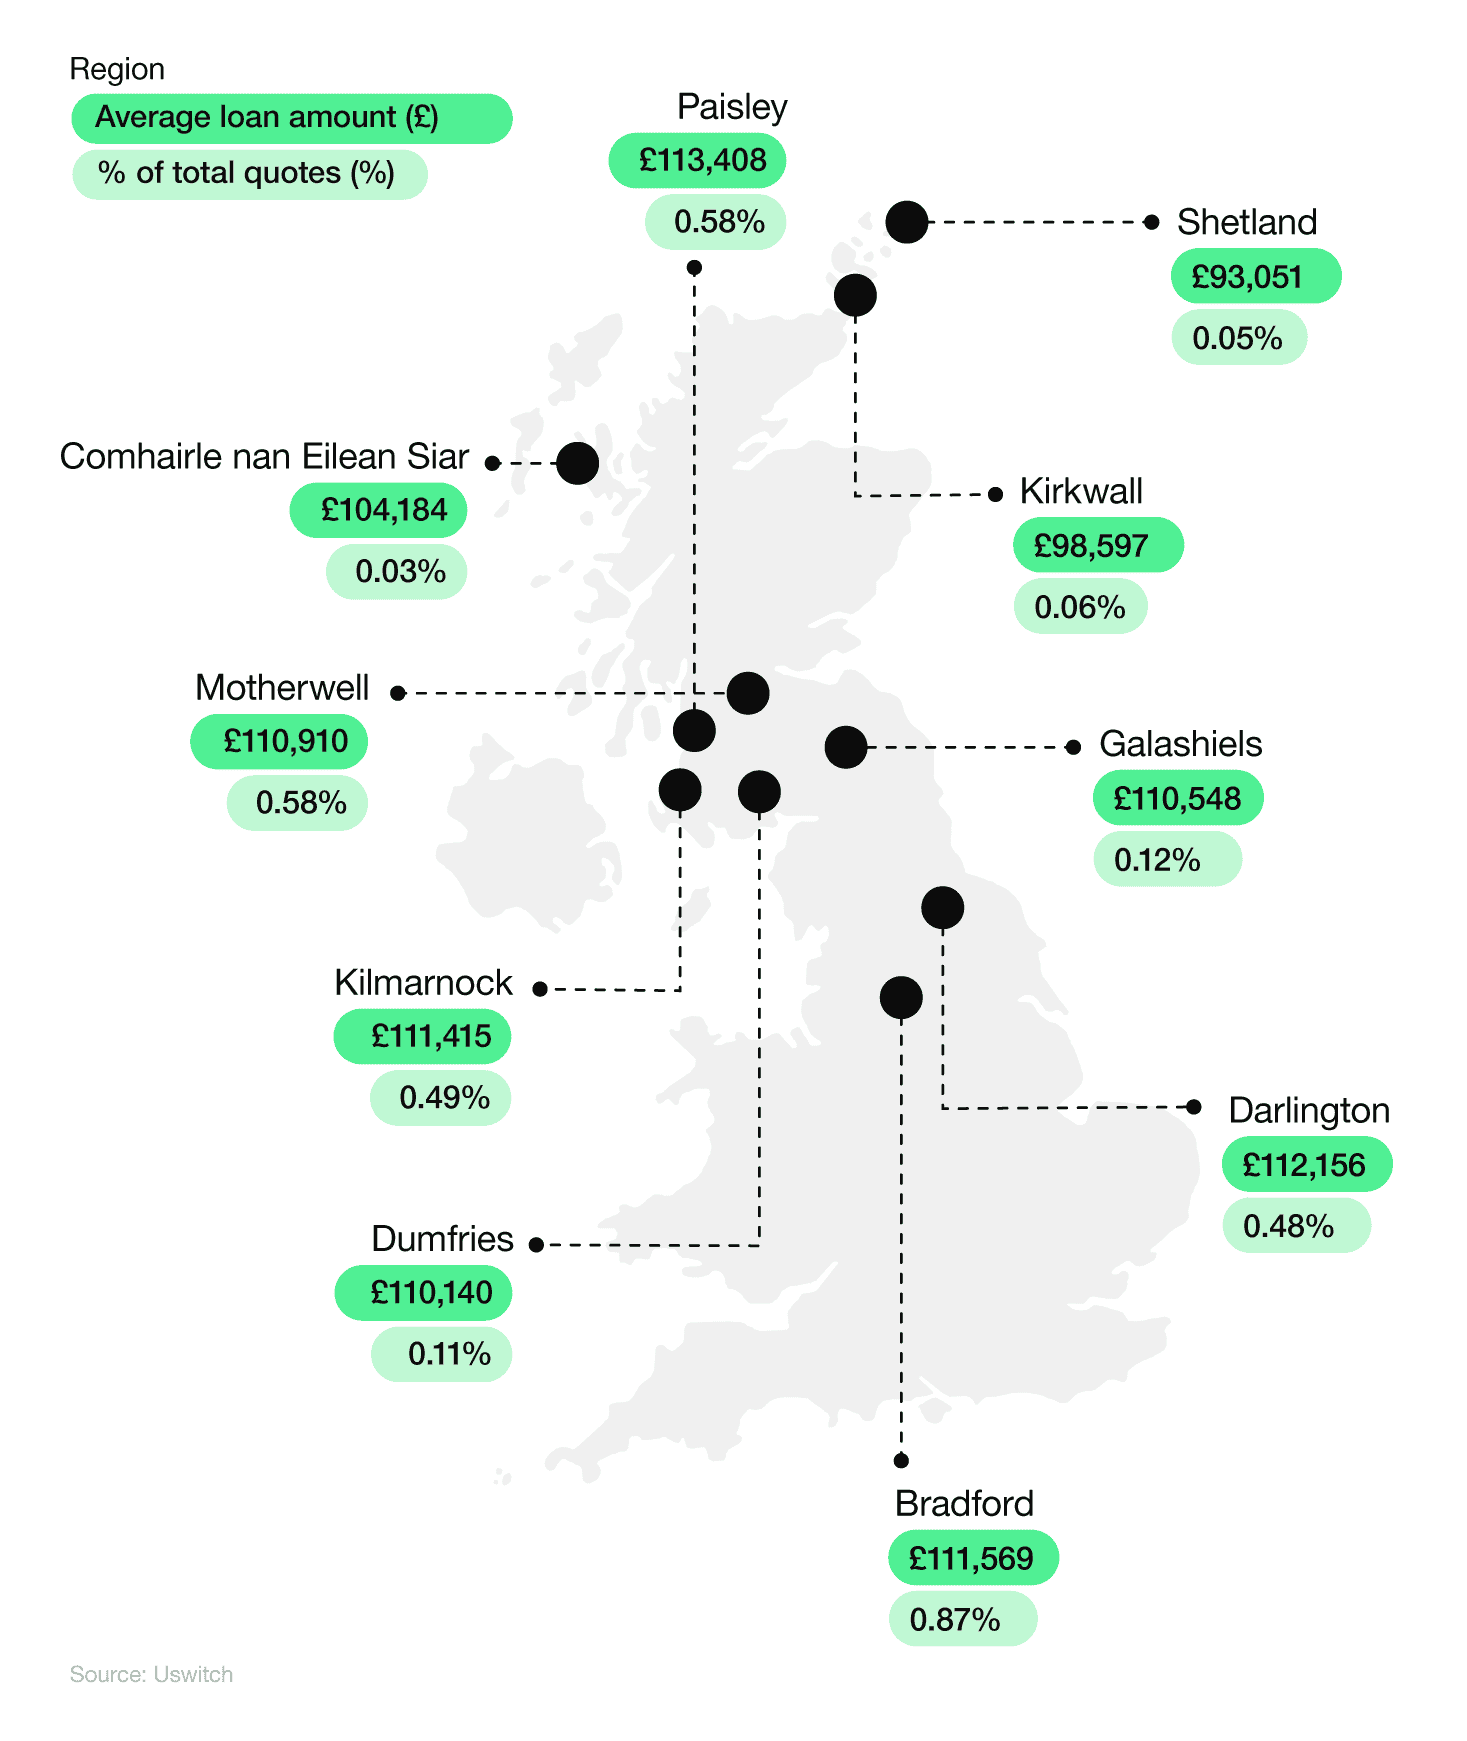
By contrast, the UK’s lowest average mortgage for 2023 was typically for properties located in Shetland (£93,501). This was around £3,500 (5.8%) less than the average mortgage for Kirkwall and approximately £11,000 (11.3%) less compared to those in Comhairle nan Eilean Siar.
Incidentally, eight out of the 10 lowest average mortgages in the UK are for towns and cities found in Scotland.
UK mortgage approval statistics
How many mortgages are there in the UK?
As of March 2024, there were approximately 61,325 mortgage approvals in the UK – a 1.4% increase from the previous month.
A breakdown of mortgage approval numbers between 2023-24
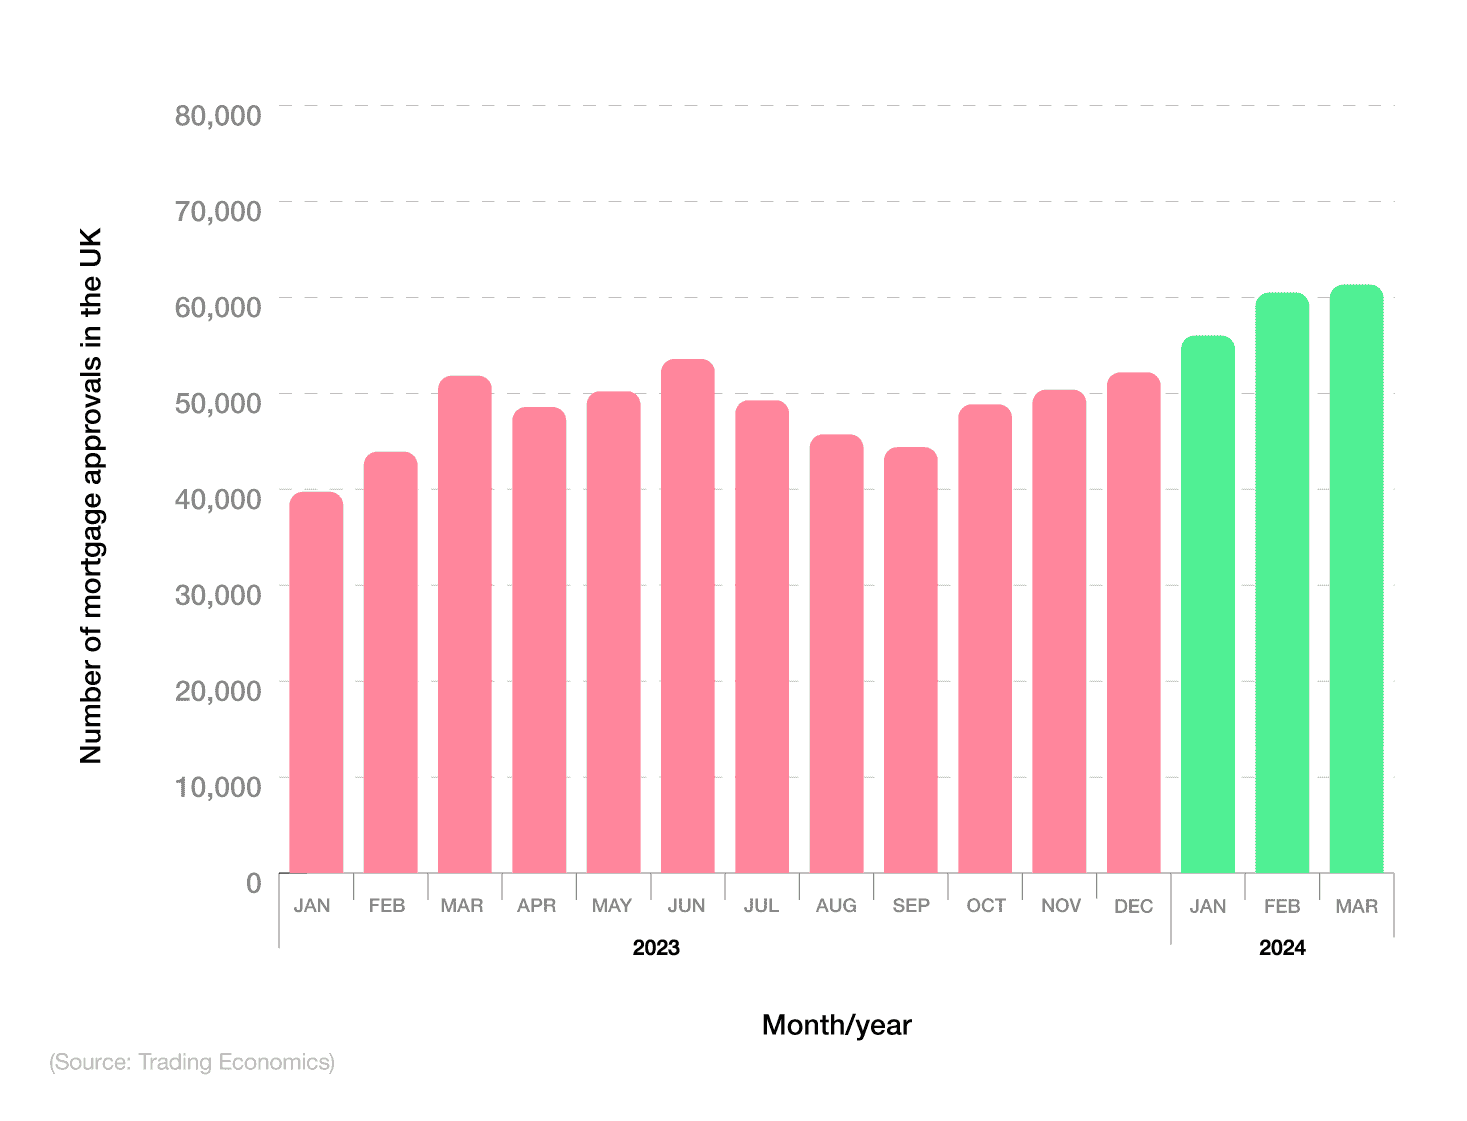
Mortgage approvals are an indicator of potential future lending, particularly when it comes to residential mortgages. Throughout 2023-24, the number of UK mortgage approvals fluctuated from a low of 39,731 in January 2023 to a peak of 61,325 in March 2024 – an overall rise of more than half (54.4%).
These figures gradually rose month-on-month from September 2023, when the number of UK mortgage approvals stood at 44,387 – an increase of almost two-fifths (38.2%) in just six months.
These mortgage approval rates only represent home buyers. Those looking for an equity release mortgage, or to take out a commercial mortgage on a prospective business, may see different approval rates from lenders. There are hundreds of different types of mortgages available, so always shop around before deciding.
UK mortgage approval statistics over time
From 2013, the number of UK mortgage approvals fluctuated between 60,000 to over 70,000 approvals per month until the Covid-19 pandemic struck in March 2020. This had a profound impact on mortgages during the following months, as numbers plunged to an all-time low of 9,300 in May 2020.
With the easing of initial lockdown restrictions, the housing market began its recovery. There was a rapid increase in the number of mortgage approvals throughout 2020, up to a peak of more than 100,000 in November and December 2020. After this point, numbers started to decrease throughout 2021, stabilising at around 60,000 per month in 2022.
A breakdown of UK residential mortgage approvals over time
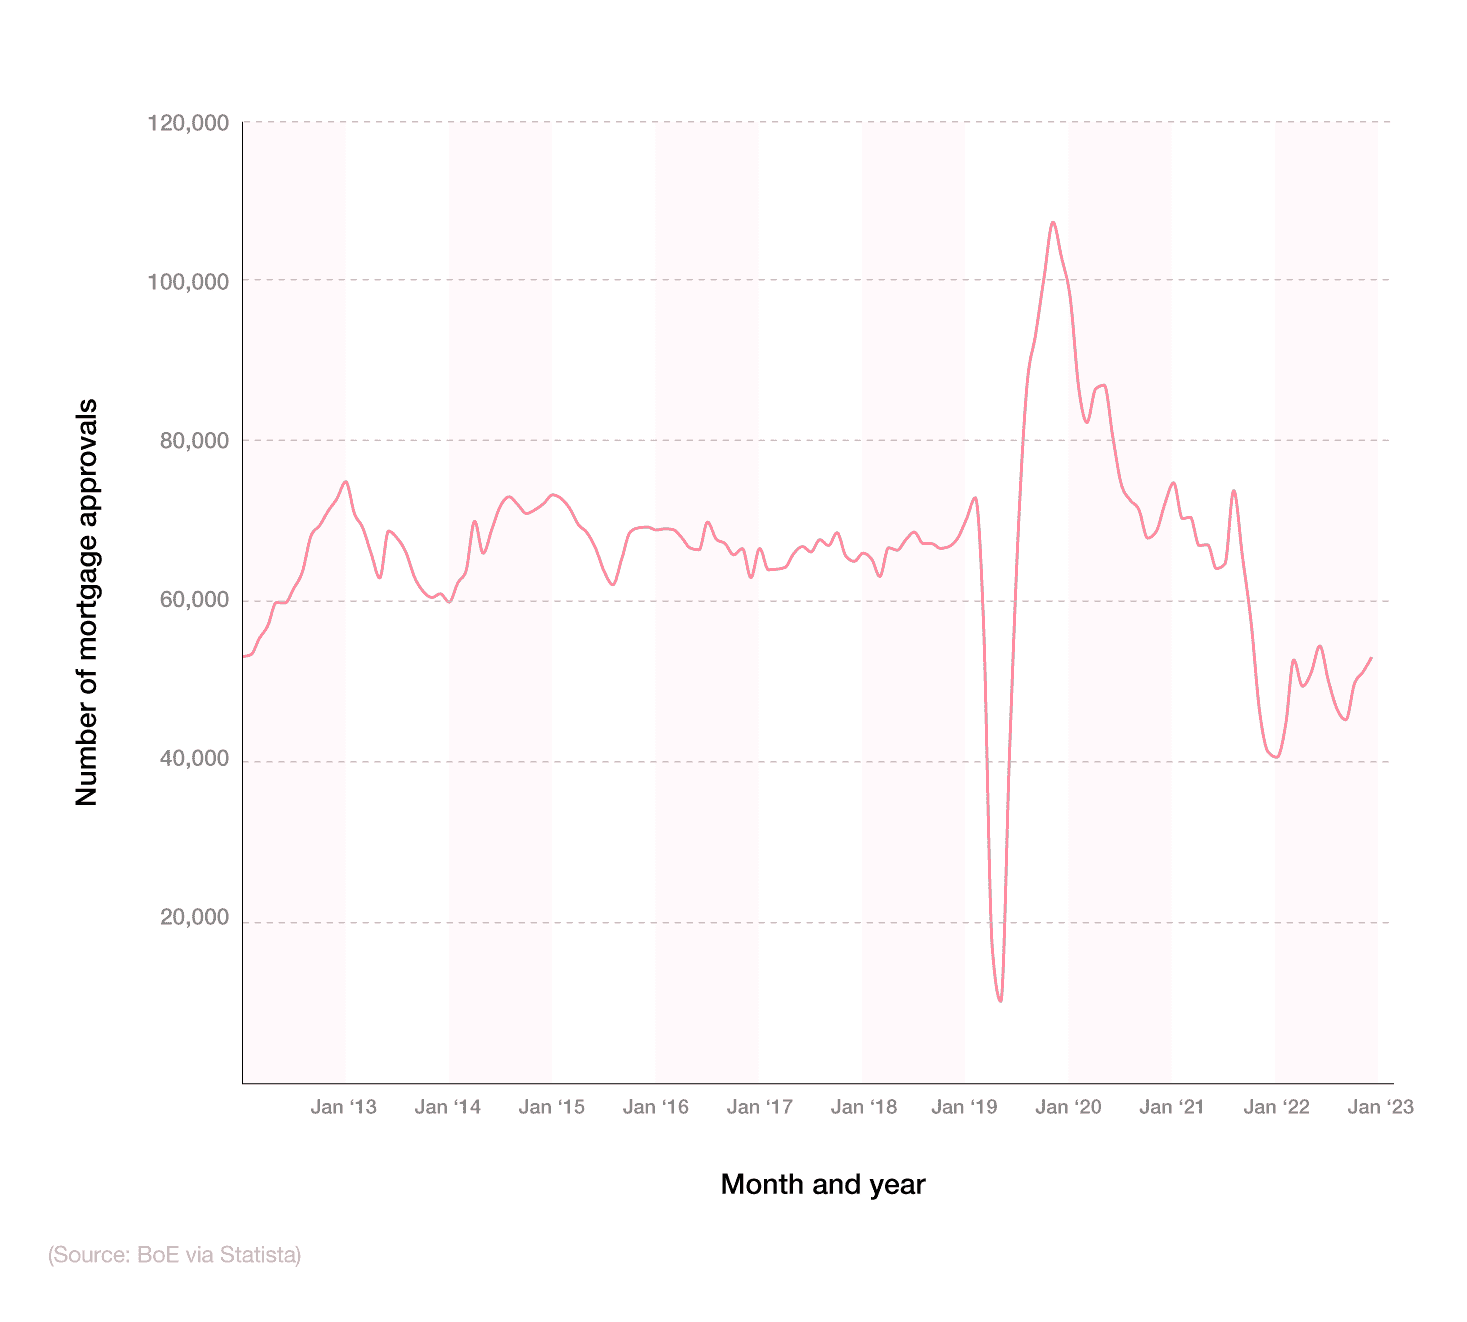
However, with 750,000 households forced into poverty in 2022 due to climbing interest rates on mortgage repayments, and wages increasing 4% slower than inflation, banks and building societies were approving fewer mortgages than in previous years.
2023 saw a gradual rise and restoration in the number of mortgage approvals across the UK up to 52,000 by the end of the year. Yet, this was around a quarter (26.8%) less than two years previous.
The average mortgage approval time is usually between two to six weeks. You can sometimes speed up this process by going through a mortgage broker, who will assess the entire mortgage market to find the best deal for you. This mortgage offer is then usually valid for six months from the date of issue.
Average number of monthly mortgage approvals in the UK
When broken down historically by month, UK mortgages are most commonly approved between August and October, with all three months typically around 67,000.
A breakdown of the average monthly UK house purchase approvals between 2007 and 2023
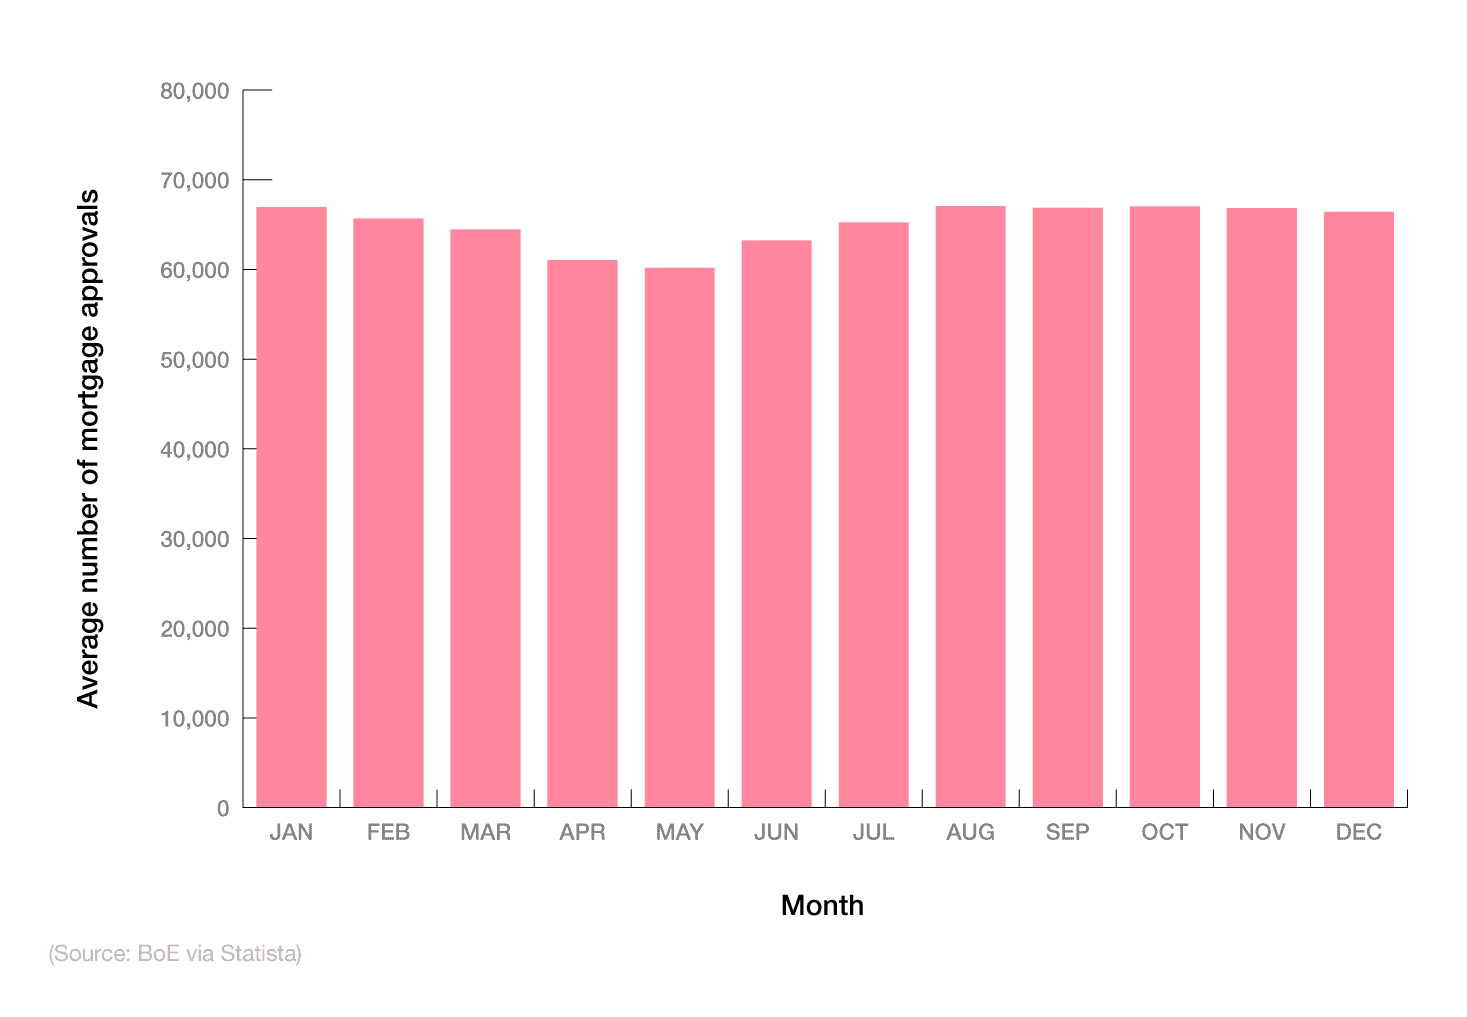
For the remaining months of the year, monthly mortgage approvals tend to fluctuate between an average of 60,000 in May and 66,000 in December.
With mortgage interest rates changing daily, and Q1 2023 figures approaching 5.5-6% on average, it’s worth noting that the housing market is always subject to change. Higher interest rates normally mean a reduction in mortgage uptake and approvals for prospective homeowners.
UK mortgage lending statistics
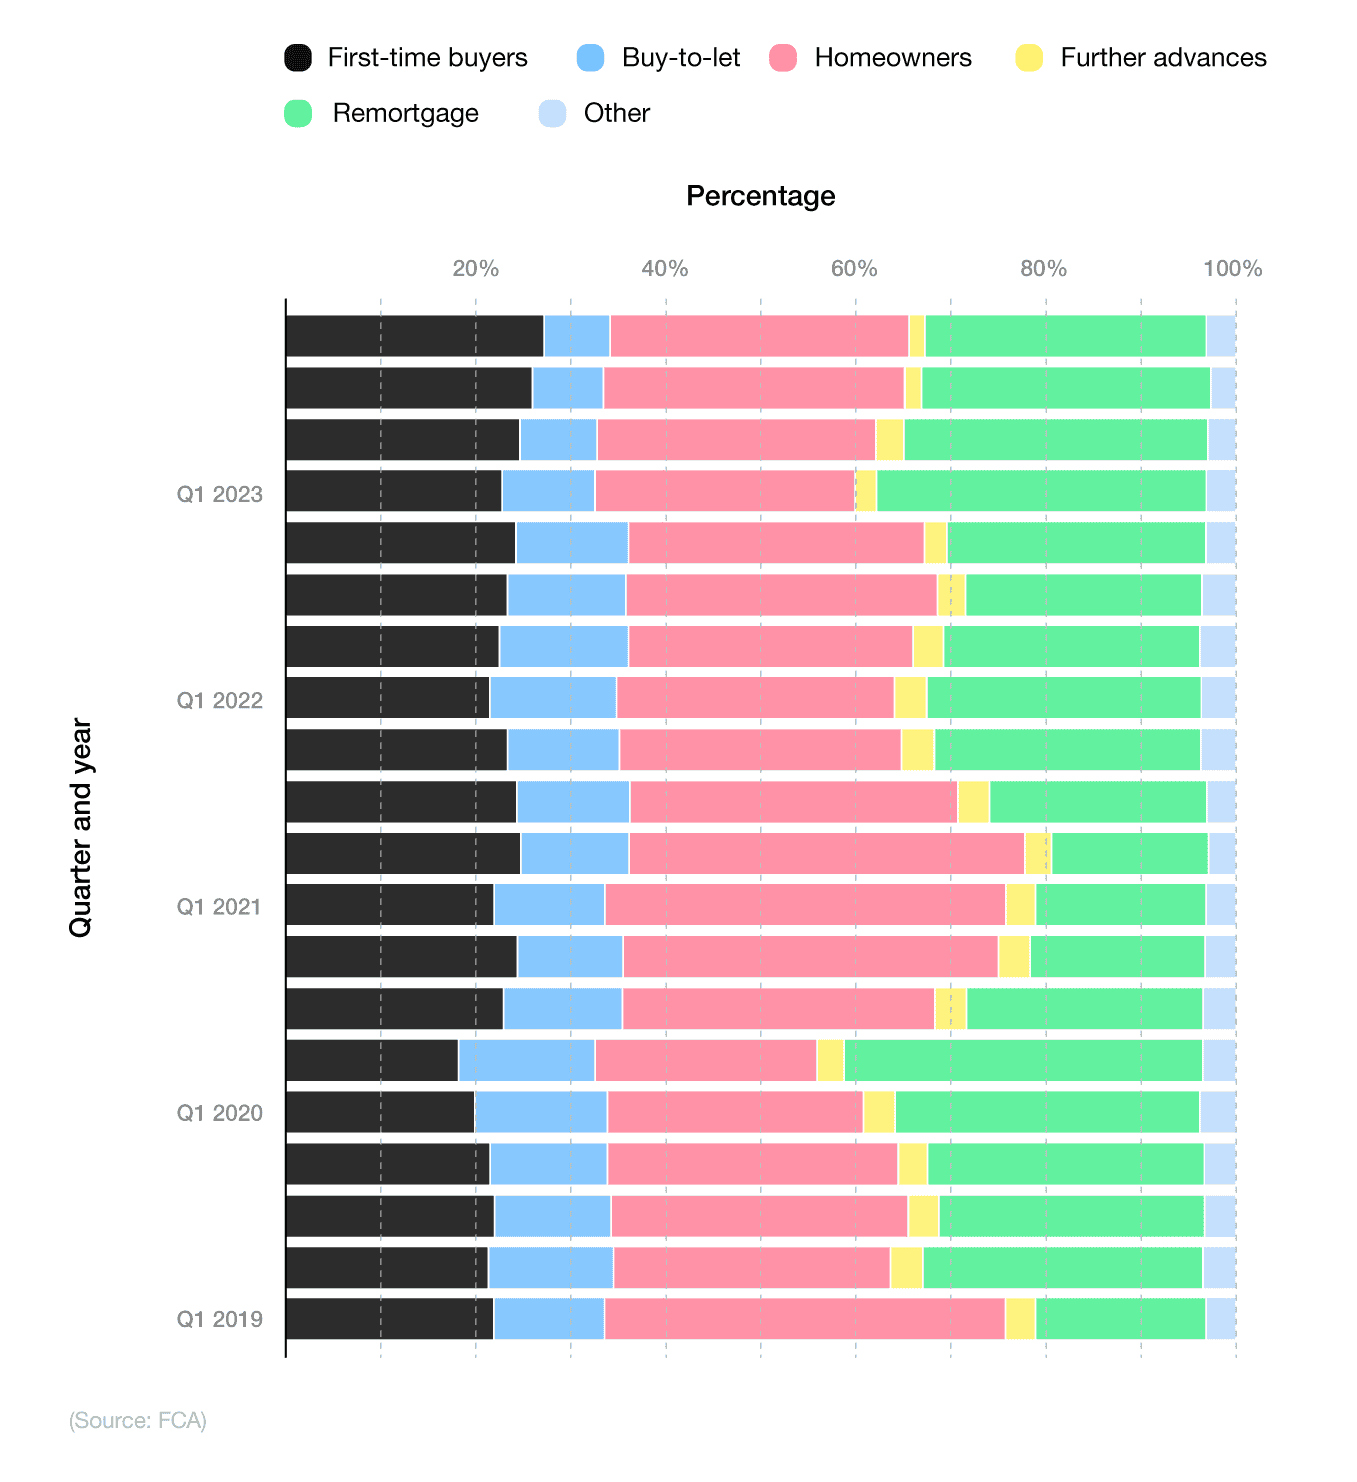
As of Q4 2023, the UK mortgage lending market largely comprised homemovers, who accounted for around one in three (31.52%) of all UK mortgages issued for the quarter. This represents a 4% rise from Q1 2023.
UK mortgage lending statistics over time
According to UK mortgage lending statistics, the percentage of UK first-time buyers rose gradually throughout 2023, from just over a fifth (22.7%) in Q1 to more than a quarter (27.14%) in Q4. Conversely, the proportion of those remortgaging during this period fell from 34.78% to 29.67%, respectively.
A breakdown of mortgage lending statistics over time by type of purchase
A gross advance is the total value of a residential mortgage loan, advanced by societies in a period. This can include loans for reasons such as house purchases, further advances, and remortgaging. Gross advances can be secured by the prospective homeowners themselves, or a mortgage broker.
At the start of 2020, less than 14% of people were purchasing UK properties through the buy-to-let scheme, the lowest percentage across the previous seven years. By Q4 2023, this figure had practically halved to 6.96% of all UK mortgage lending for the quarter, highlighting a significant drop in the scheme’s popularity over the previous three years.
In the mini-budget of September 2022, the Conservative government decided to cut stamp duty in England and Northern Ireland for some buyers in a bid to boost economic growth following the cost of living crisis.
The Chancellor of the time, Kwasi Kwarteng, announced the price at which stamp duty was to be paid would double from £125,000 to £250,000, saving money for around 200,000 people purchasing a property.
Changes were also made to the rates at which stamp duty is paid, with the new rates being:
0% for properties up to £250,000
5% for properties between £250,000 and £925,000
10% for properties between £925,000 and £1.5 million
12% for any property over £1.5 million.
Those who qualify as first-time buyers in England and Northern Ireland will pay no stamp duty on their first property (a £425,000 ceiling applies, although this has increased from £300,000). Furthermore, discounted stamp duty for first-time buyers will apply up to £625,000 (up from £500,000).
In November 2022, the Government confirmed that the Stamp Duty Land Tax (SDLT), and the higher thresholds in which it is paid, will remain in place until at least March 2025. This will save prospective homeowners hundreds of pounds per year from paying stamp duty, with first-time buyer mortgage data showing the move positively affects over 300,000 new homeowners nationwide in 2023.
A breakdown of mortgage lending statistics as a percentage of total new commitments
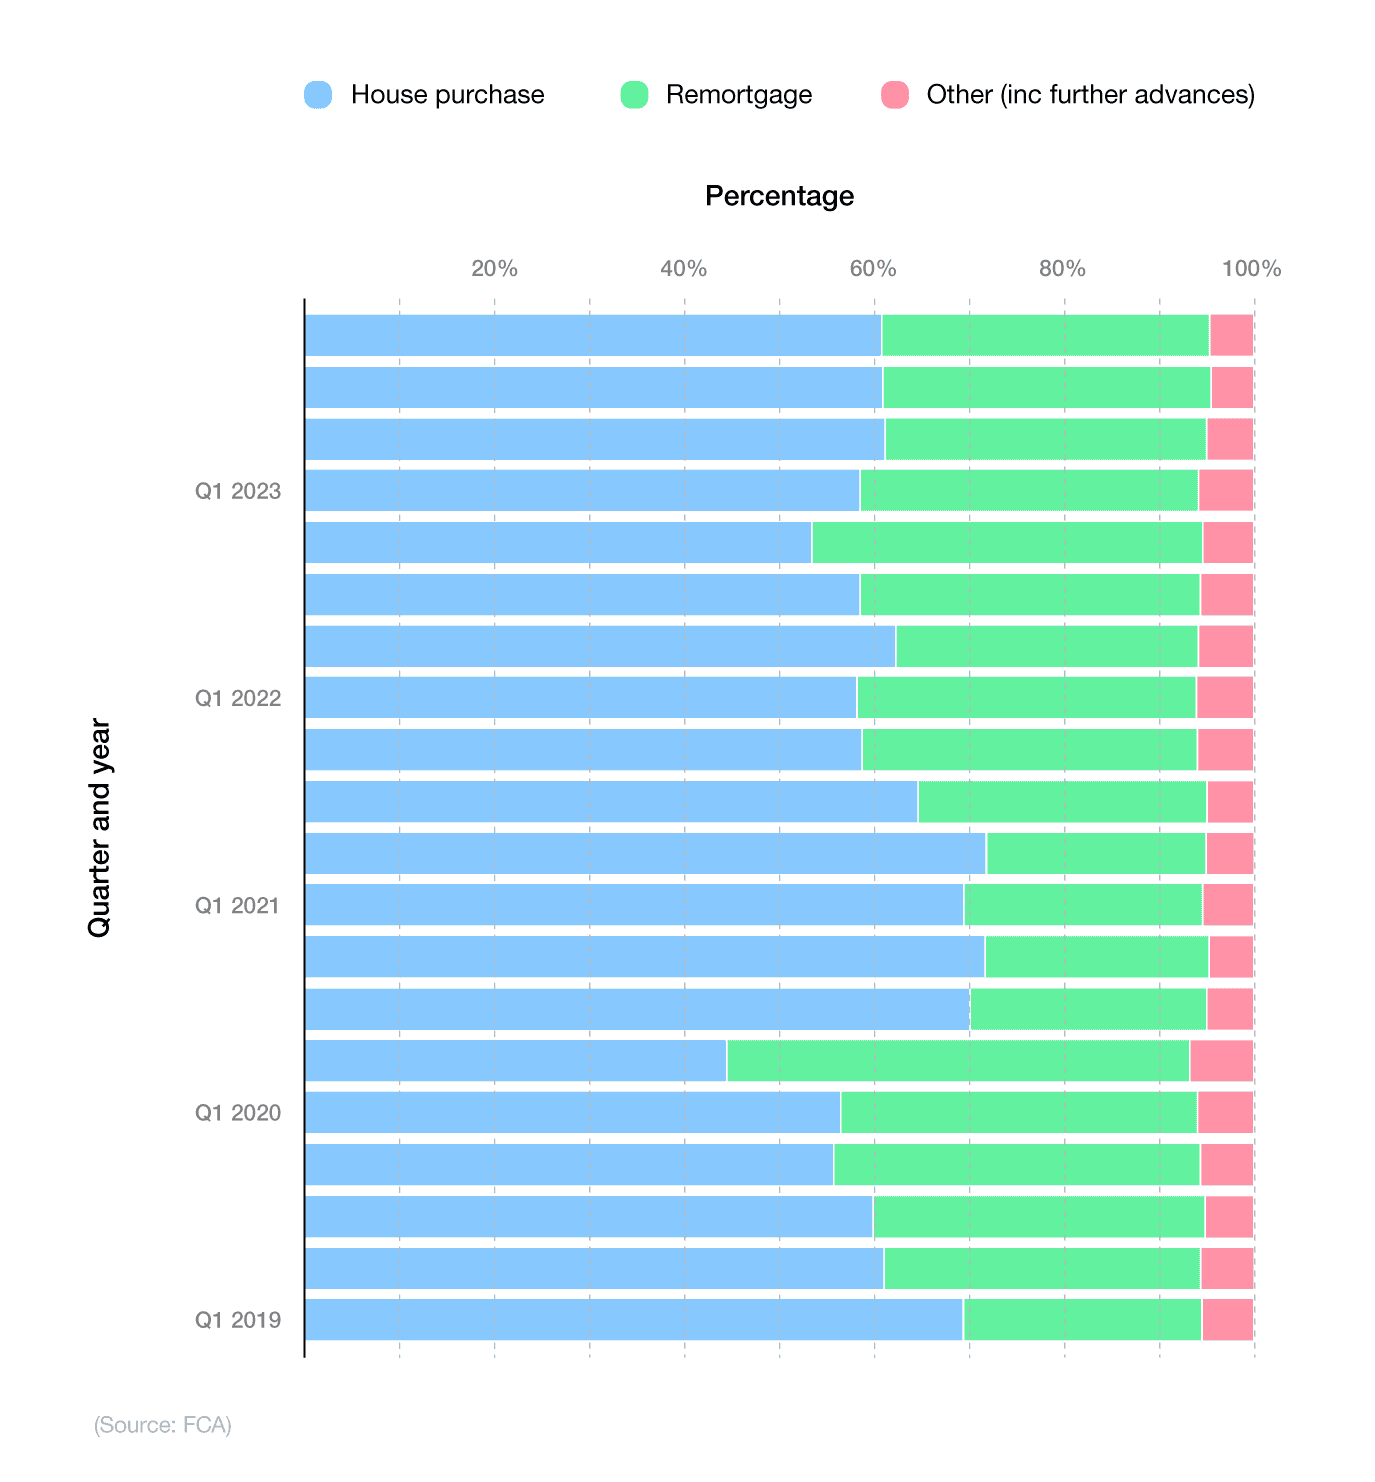
As of Q4 2023, around three-fifths (60.86%) of UK mortgage lending was for house purchases, with just over a third (34.59%) for remortgages.
Since 2019, house purchases have generally been the most common purpose for mortgage lending in the UK, with the exception of Q2 2020. The Covid-19 pandemic caused house sales to plummet below 45% for the quarter, before restoring to beyond 70% three months later. Remortgage statistics during this period rose to almost half (48%) of all mortgage lending for the quarter – the highest recorded figure between 2019-23.
Value of UK mortgage lending
As of Q4 2023, the value of UK mortgage lending from gross advances stood at just over £54 billion – a drop of 13.4% from the previous quarter.
Net advances from UK mortgages during this period also fell by three-fifths (60.8%) to almost £1.1 billion, with the number of new mortgage commitments decreasing by 6.6% to virtually £46 billion – a fall of 6.5% in three months.
A breakdown of the value of mortgage approvals in the UK by quarter and year (£mn)
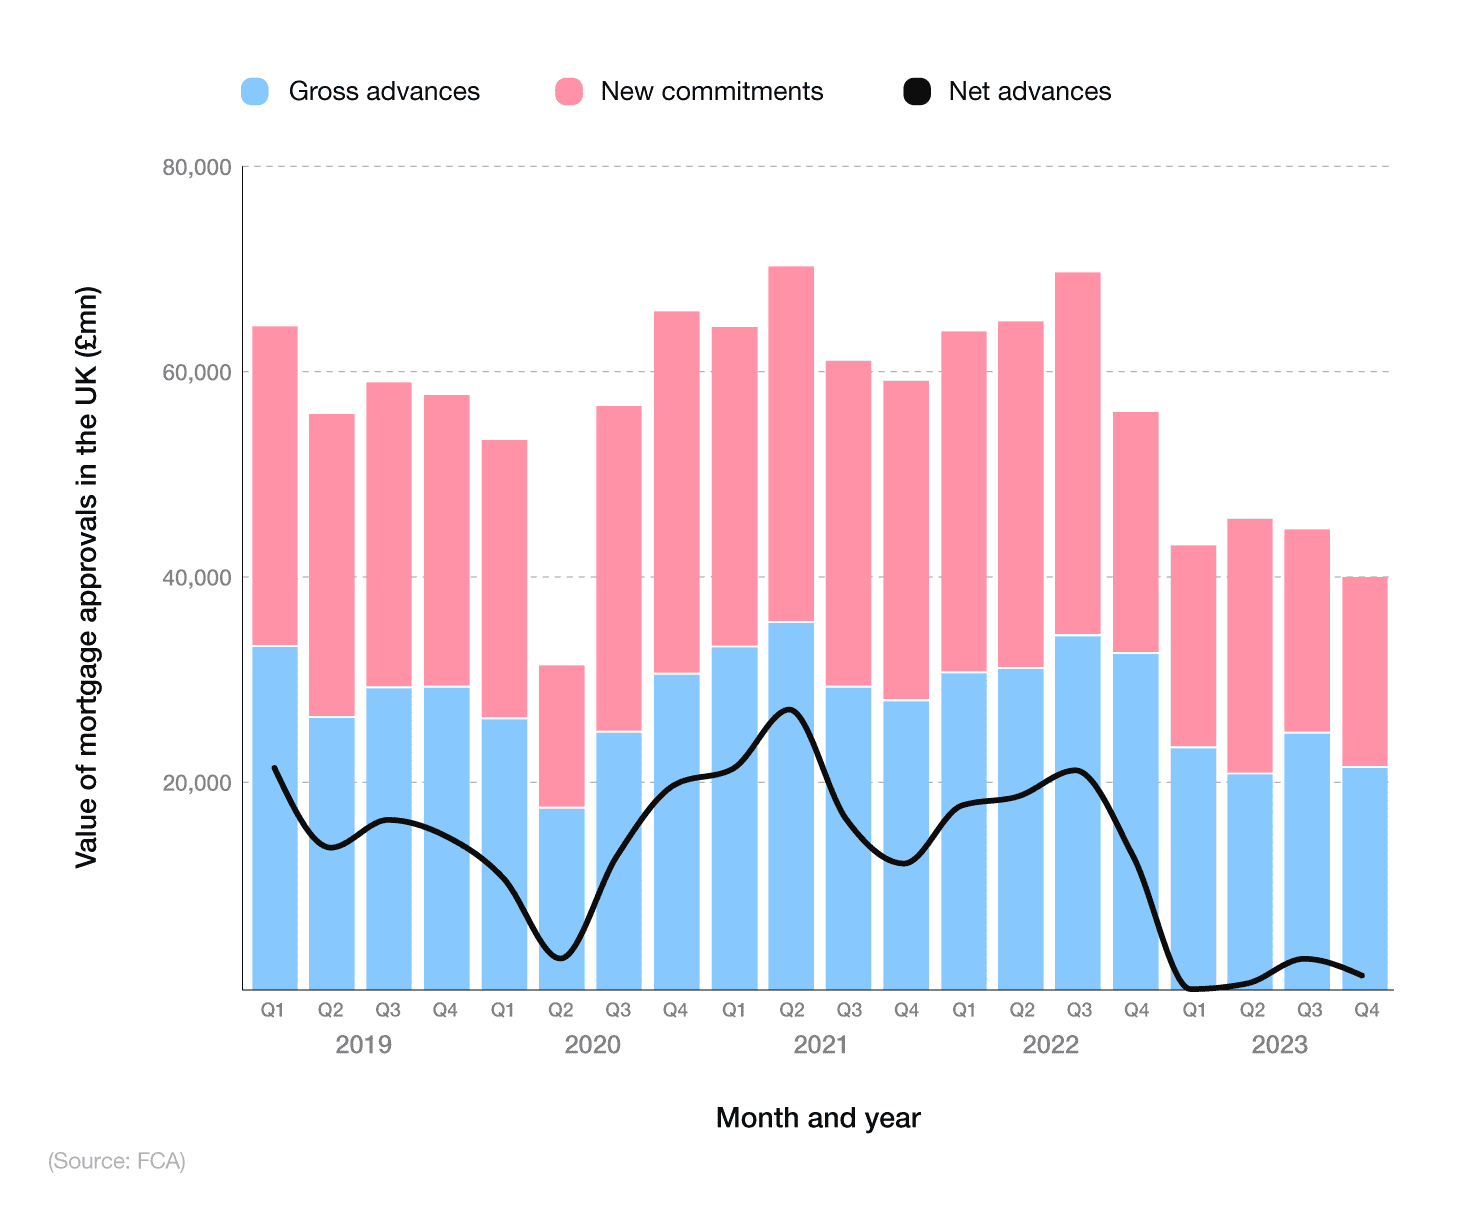
Since Q1 2019, the value of mortgage lending in the UK has fluctuated considerably across all three categories.
Gross advances from UK mortgages dropped by more than a third (35.2%) between 2019-23. A peak of almost £86 billion in Q3 2022 was almost double the recorded figure for Q2 2020 of £44.2 billion.
Net advances from UK mortgages fell by 95% between 2019-23, from £21.7 billion in Q1 2019 to just over £1.1 billion four years later (even registering a loss of £280 million in Q1 2023).
The value of new commitments from UK mortgages in Q1 2019 stood at almost £77.5 billion – around £30 billion more than the recorded figure for Q4 2023.
UK mortgage lending statistics
As of March 2024, there were 93,059 mortgage transactions across the UK, according to mortgage lending statistics from the BoE. This represented a 0.7% rise from the previous month, yet a 14.9% decrease from March 2022.
Monthly UK mortgage lending
At the start of 2020, there were around 125,000 mortgage transactions in the UK for March. This figure plummeted to just over 85,000 in April 2020, as a result of Covid-19. This represented a drop of almost a third (32.4%) in just one month.
According to the BoE, the number of mortgage transactions per month rose steadily throughout 2020 to more than 140,000 by the end of December.
A breakdown of UK monthly mortgage transactions over time
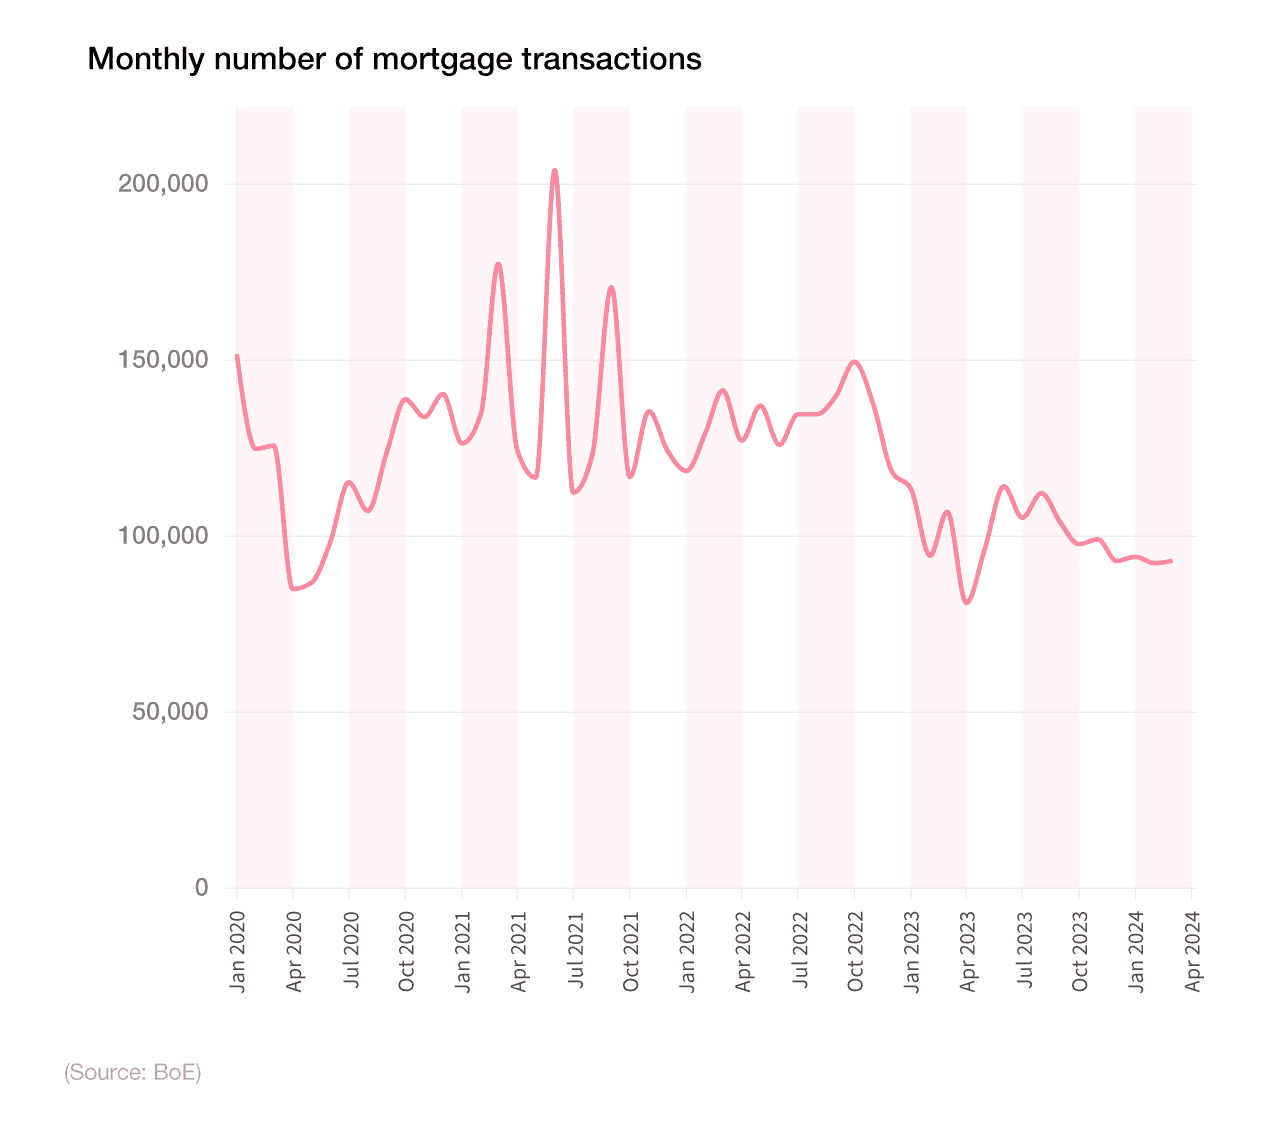
The number of monthly mortgage transactions in the UK fluctuated throughout 2021-22, reaching a peak of almost 204,000 in June 2021 before decreasing just a month later by almost half (44.9%) to around 112,000.
Between November 2022 and April 2023, the amount of UK mortgage transactions each month dropped by two-fifths (41%), from 137,343 to a low of 81,065. Numbers restored themselves within a few months, reaching 114,200 by June, before declining once more to 97,802 in October.
Monthly mortgage transaction figures stabilised between Q4 2023 and Q1 2024, fluctuating between 92,000 and 99,000 mortgages per month.
The value of UK mortgage lending
According to mortgage lending statistics from the BoE, the total value of gross mortgage lending in the UK stood at £209.7 billion, as of 2023. This represented a drop of more than a quarter (27.6%) from the peak of £289.6 billion the previous year.
A breakdown of the total value for British mortgage lending over time
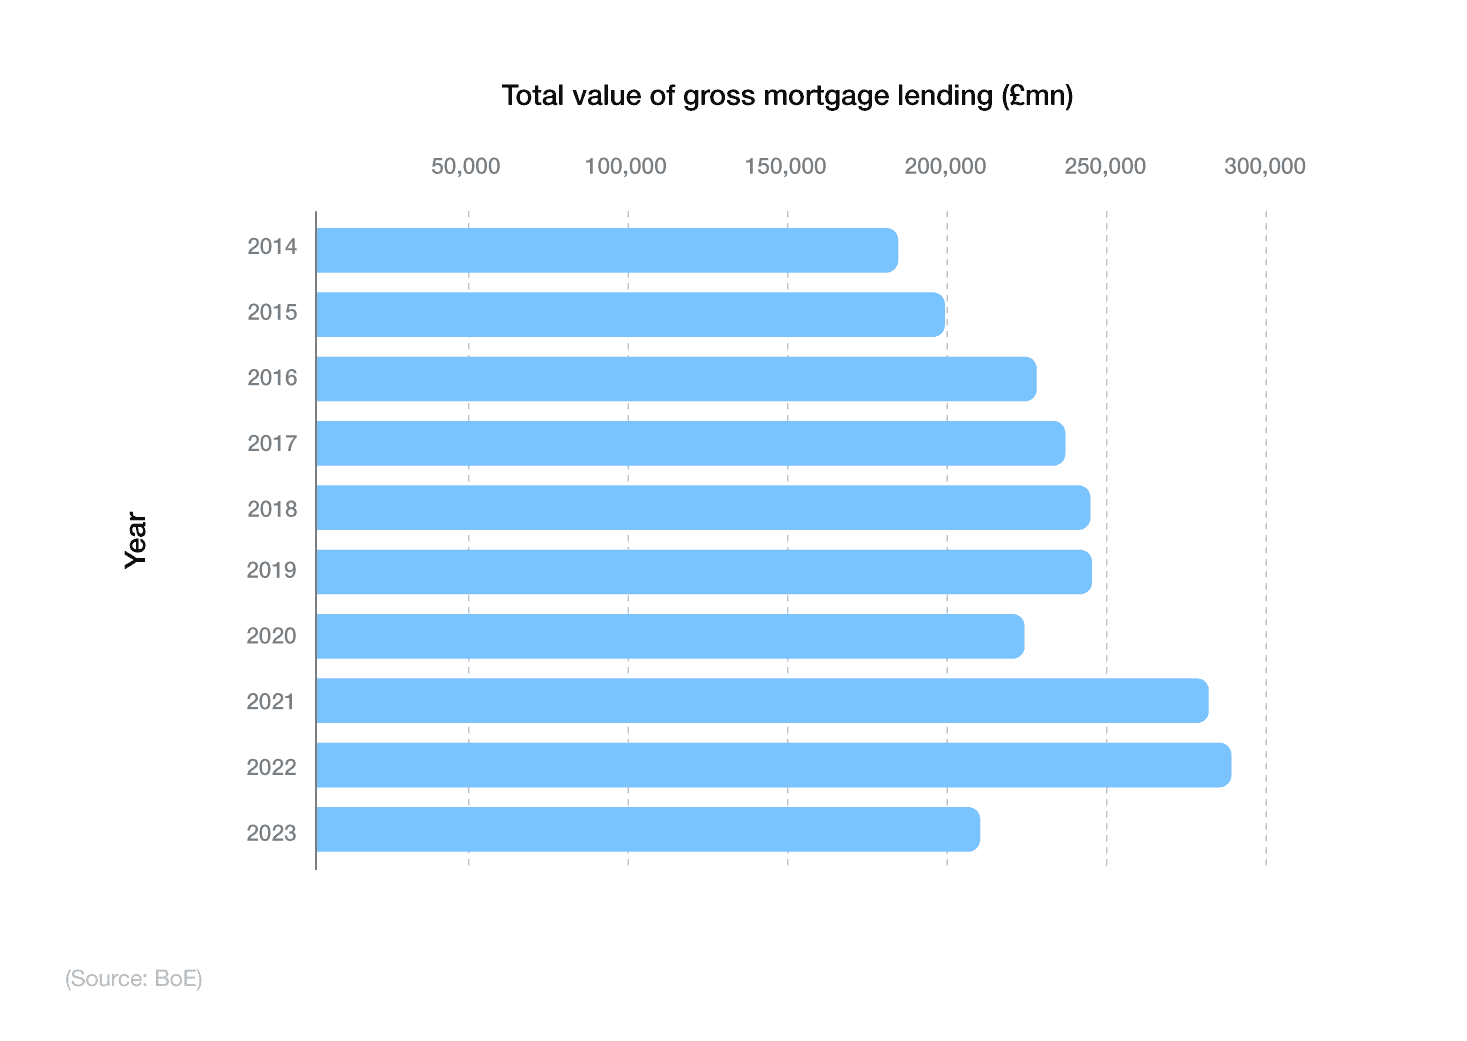
From 2014 onwards, the UK’s total value of gross mortgage lending has generally risen year-on-year, rising 13.2% in the space of 10 years. A slight drop of 9.3% between 2019-20 was soon met with an increase of more than a quarter (27.4%) the following year.
Check out our mortgage news page for daily updates on all things mortgage-related. Alternatively, if you’re after even more industry statistics, have a look at our mortgage studies page.
A breakdown of the value of UK mortgage lending over time
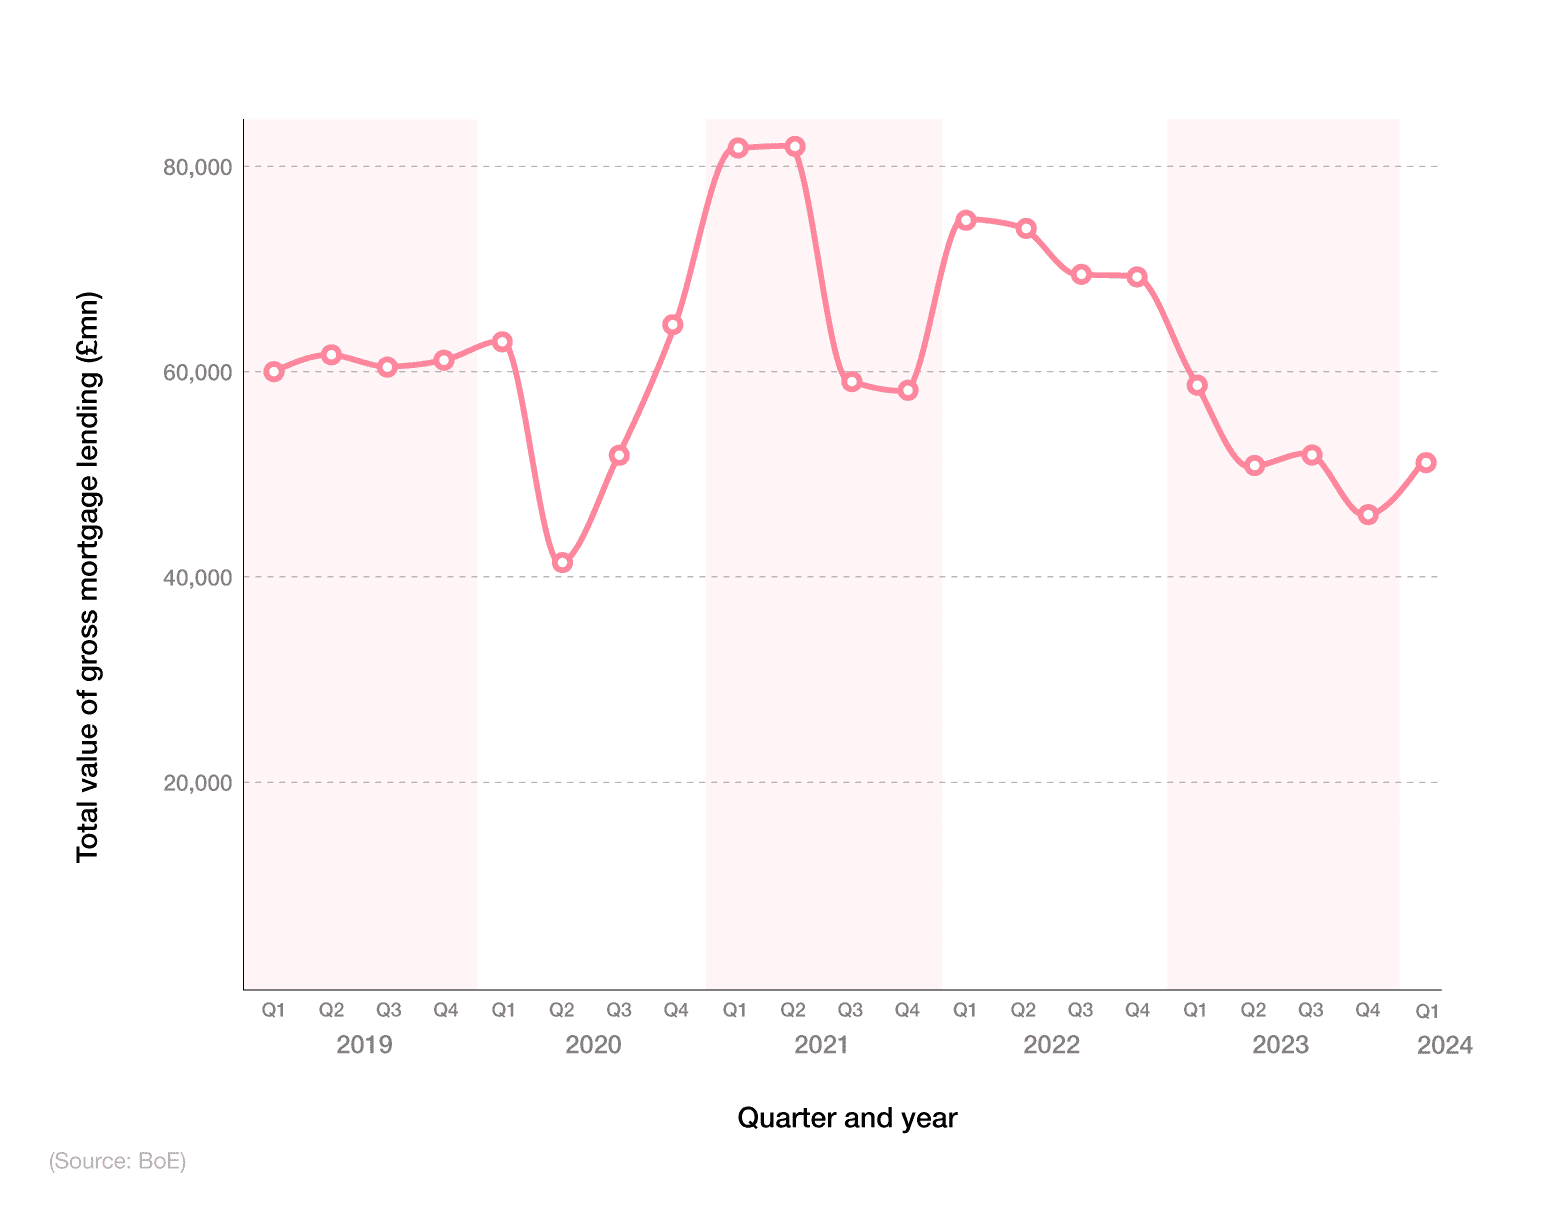
When broken down by quarter, the value of gross mortgage lending in the UK has steadily fluctuated between 2019-23. According to mortgage statistics from the BoE, there was £51.6 billion worth of mortgage lending in Q1 2024 – a rise of 11.2% from the previous quarter.
Gross mortgage lending in the UK reached a peak at the start of 2021 of around £82 billion in Q1 and Q2, followed by a drop of more than a quarter (27.7% in Q3).
Q4 2023 saw the lowest recorded figure for UK mortgage lending within five years when the BoE reported a total value of almost £46.4 billion for the quarter – a drop of more than two-fifths (43.8%) from Q2 2021.
UK mortgage lending from building societies
In September 2023, there were 29,471 mortgages approved by UK building societies, an almost identical figure to the one reported the previous month.
The number of mortgages from building societies in the UK fluctuated throughout 2023, from a low of 23,240 in January to a high of 33,649 in March.

Fluctuations were also apparent across 2021-22 but with much healthier numbers by comparison. Mortgage approval statistics for 2021 indicate that monthly figures didn’t drop below 30,000 throughout the year.
Yet, in 2022, respective figures were similar up until Q4 2022, dropping to a low of 21,298 in December – around half the number of mortgages approved compared to March of that year.
Unlike banks, building societies are not listed on the stock market, and therefore don’t have external shareholders. Instead, the “owners” and decision-makers are mortgage borrowers, savers, and current account holders.
A breakdown of the value of mortgage approvals by UK building societies over time
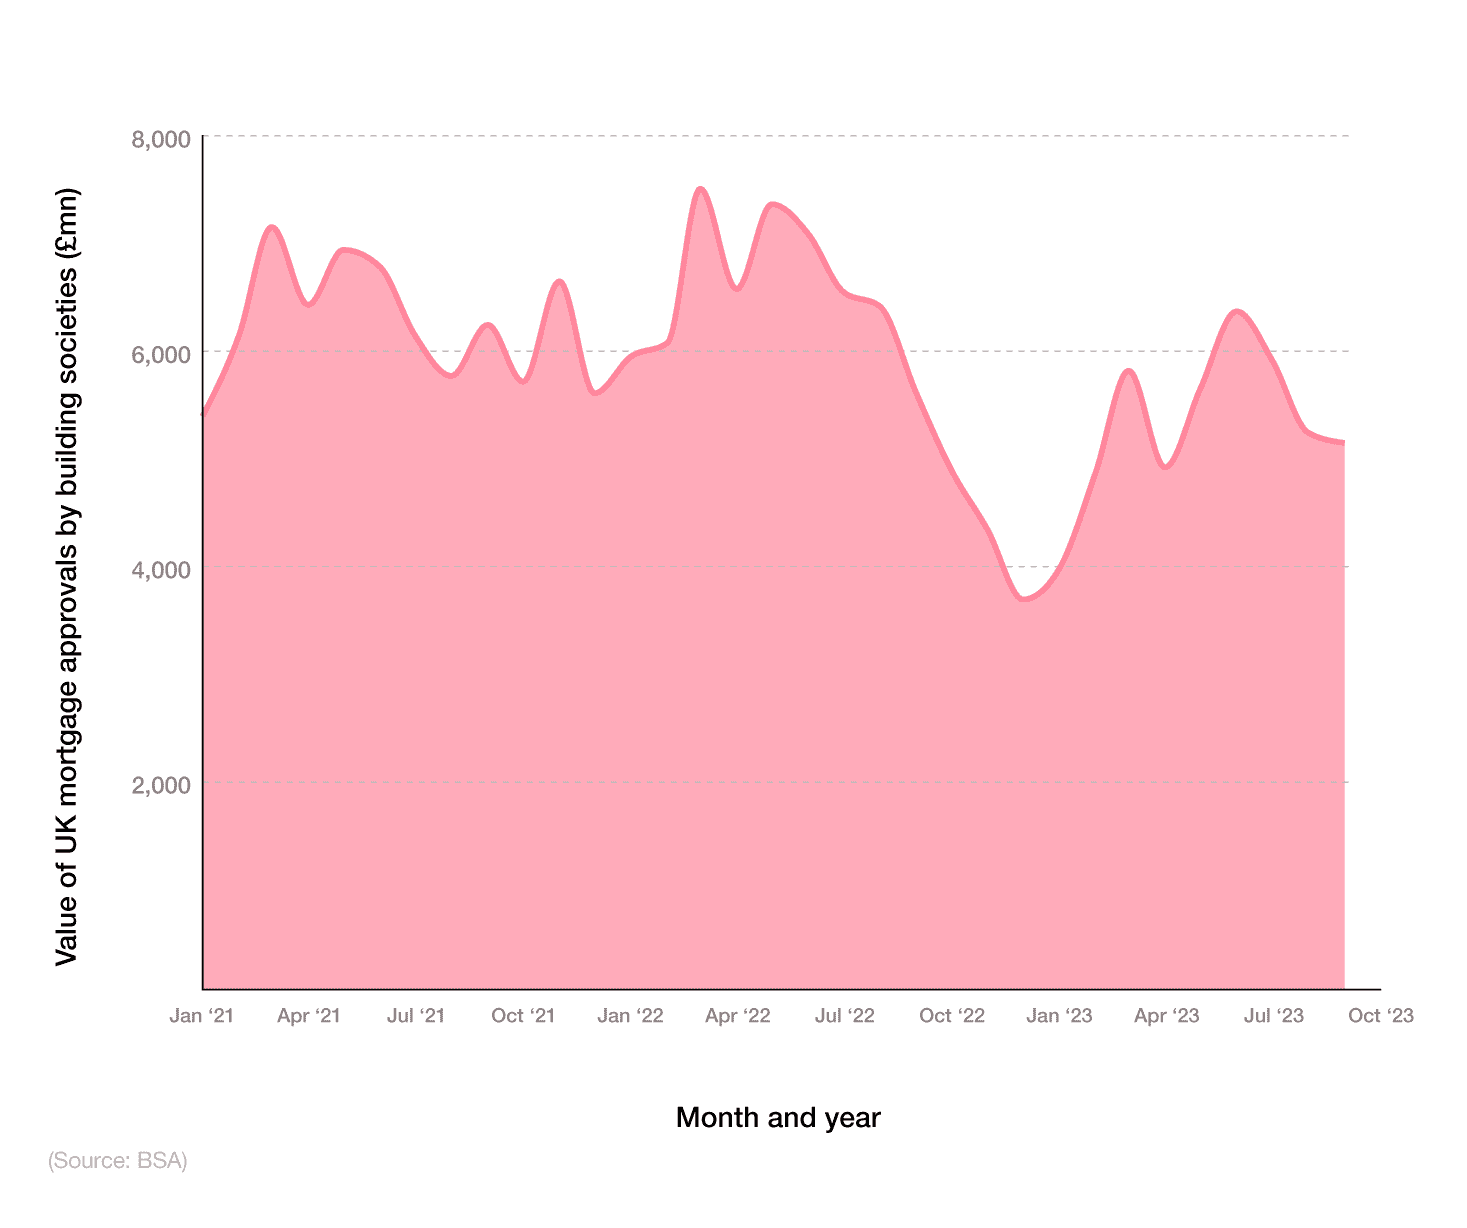
As of September 2023, the value of mortgages approved by UK building societies stood at just over £5.1 billion – a drop of 1.8% from the previous month and 8.4% from 12 months earlier.
Since January 2021, the cost of UK mortgages from building societies has fluctuated between a peak of £7.5 billion in March 2022 down to a low of £3.6 billion in December 2022 – a drop of more than half (52%) in the space of nine months.
A breakdown of the value of gross mortgage lending by UK building societies over time
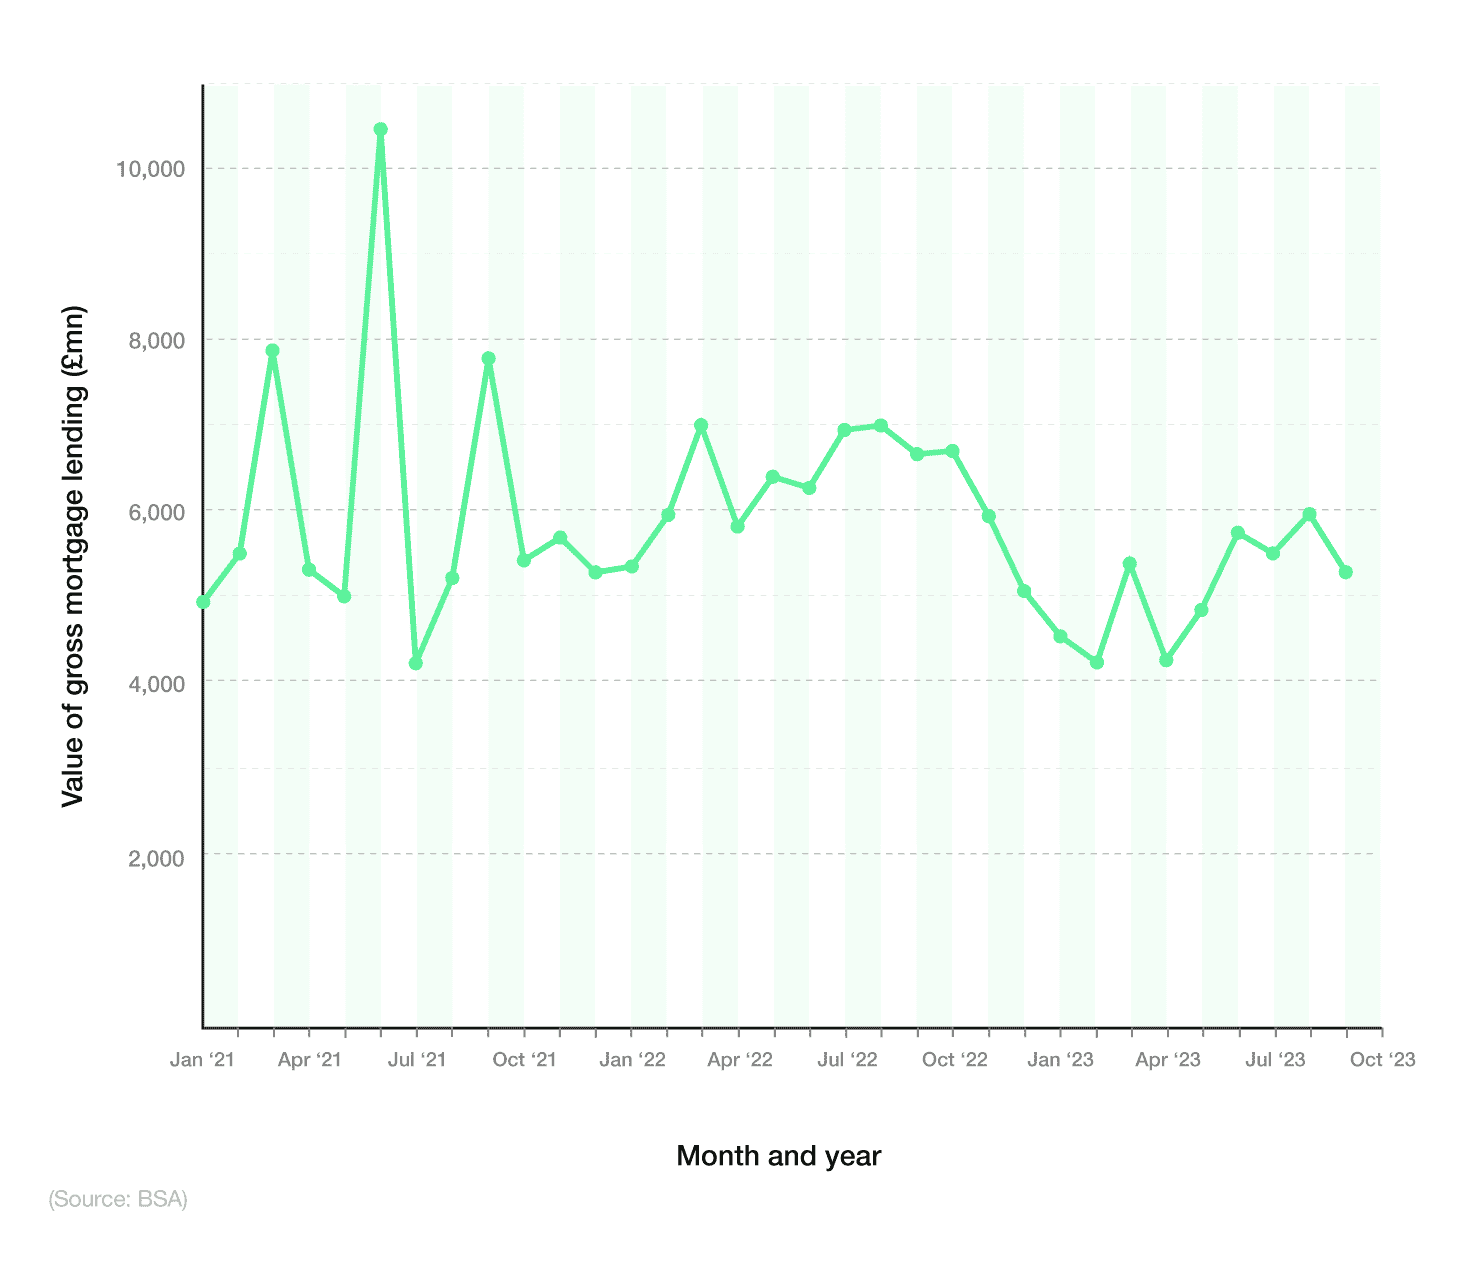
As of September 2023, the value of gross mortgage lending by UK building societies stood at almost £5.2 billion. This represented an 11.4% decrease from August and a fall of more than a fifth (20.8%) from September 2022.
Since January 2022, there have been significant fluctuations in the UK in terms of gross mortgage lending from building societies. June 2022 saw an abnormally high peak of around £10.3 billion – almost double the recorded figure for September 2023.
Yet, July 2022 experienced the lowest gross value for mortgages across this period, dropping by three-fifths (60.2%) in one month to £4.1 billion.
A breakdown of the value of net mortgage lending by UK building societies over time
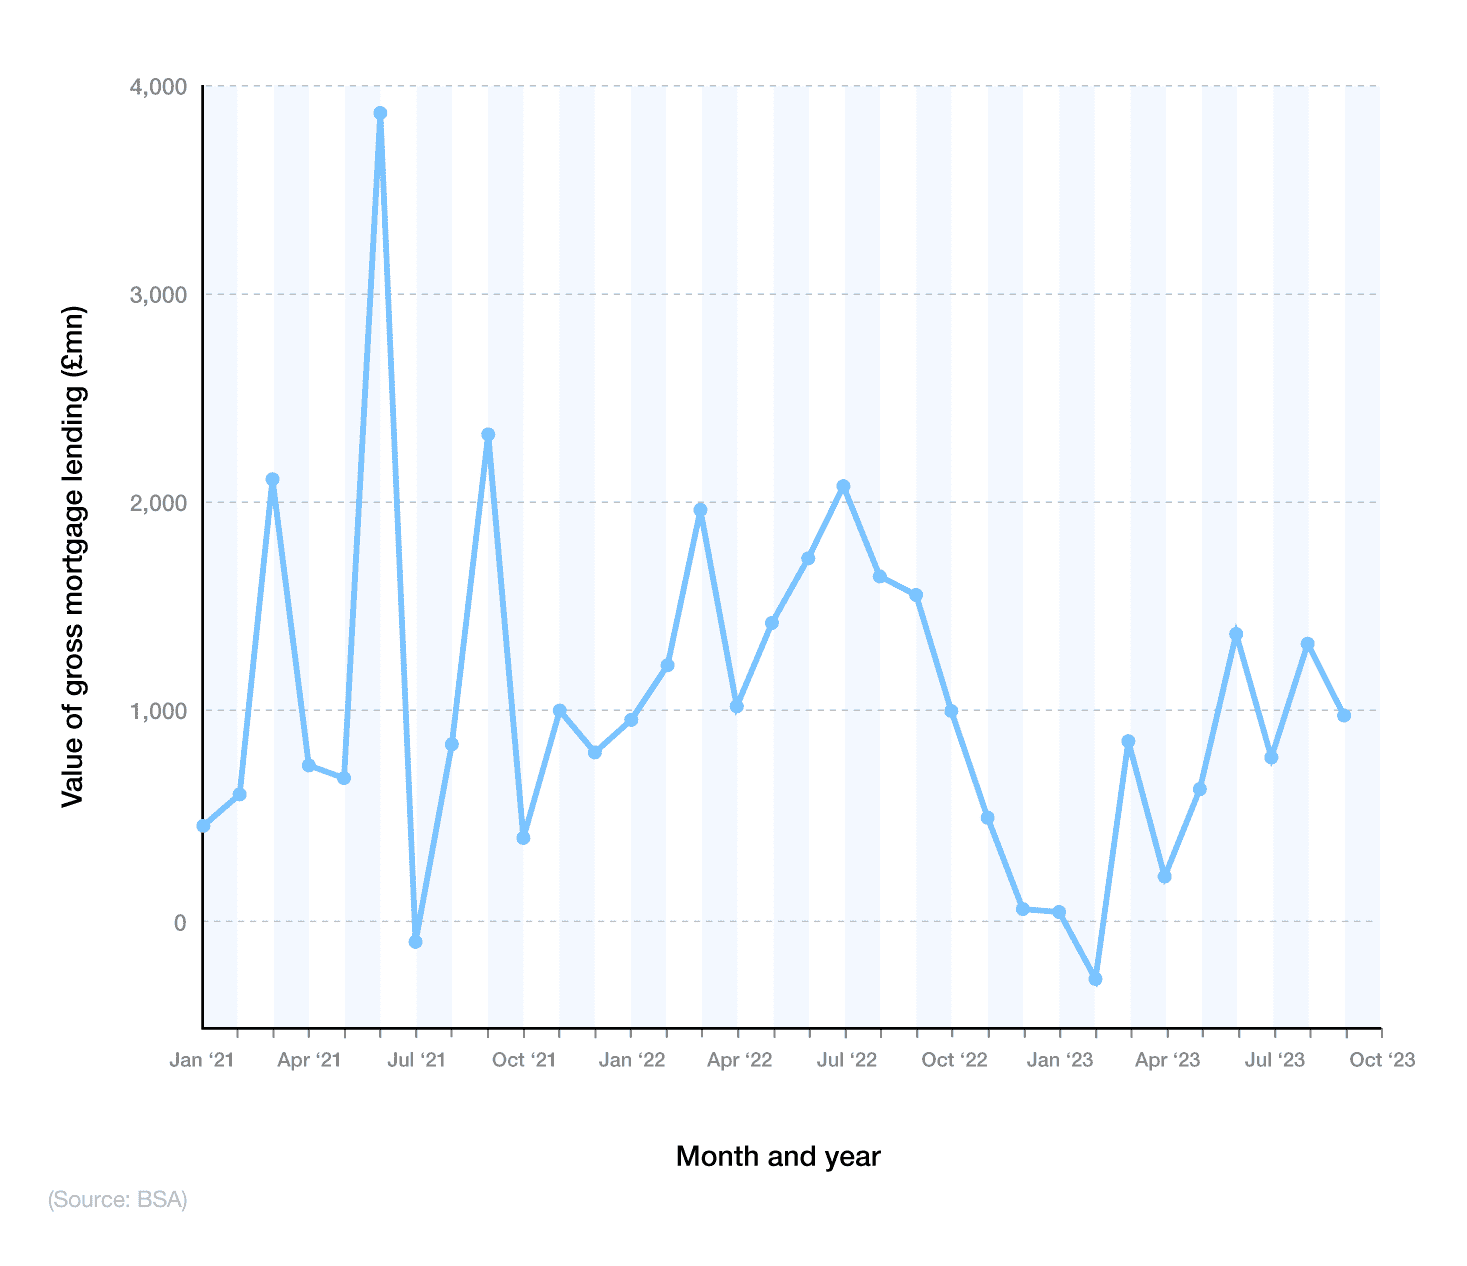
The value of net mortgage lending from UK building societies fluctuated significantly throughout 2022-23. For the most part, this has remained positive, reaching a peak of almost £3.9 billion in June 2022.
However, some months during this period registered negative growth, notably February 2023 with a loss of £265 million (the lowest recorded figure in 2022-23).
As of September 2023, the net value of UK mortgages from building societies stood at £998 million, according to BoE mortgage data.
Mortgage loan statistics: LTV and LTI ratios
The predominant mortgage type in the UK has consistently been for those with a loan-to-value (LTV) of 75% or less, meaning a 25% deposit saved, as well as a high loan-to-income (LTI) ratio of either single 4.00+ or joint 3.00+. This suggests that UK homeowners prefer to save for a higher deposit, in the hope of seeking preferential interest rates more commonly seen in 60% LTV mortgages, for example.
As of Q4 2023, around three-fifths (60.5%) of UK mortgages had an LTV of 75% or less – a 7% drop from Q1 when this figure stood at more than two-thirds (67.5%).
A breakdown of the UK mortgage loan-to-value ratio (LTV) over time
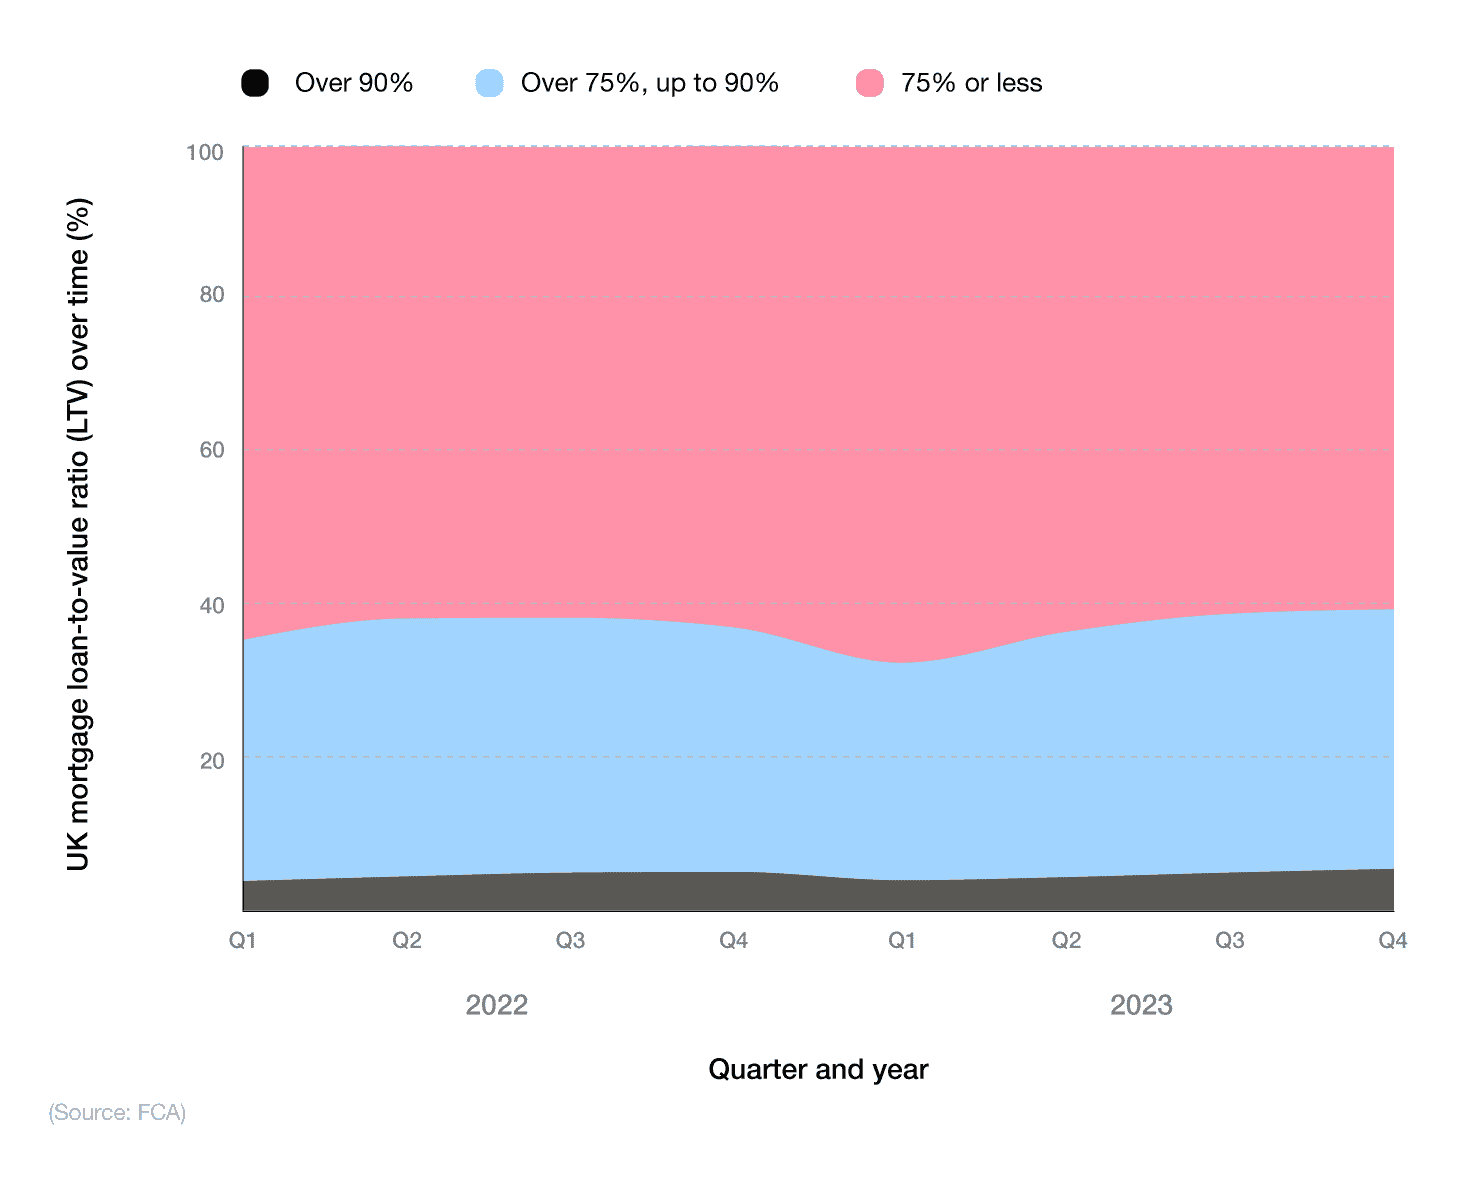
The share of mortgages with an LTV ratio above 90% reached 5.5% in Q4 2023, according to FCA mortgage statistics – a rise of 1.5% from the start of the year.
Those with a 75% LTV mortgage or above saw a gradual increase in their market share across 2023, rising by 5.5% in 12 months to just over a third (34%) by the end of Q4.
For mortgages advanced with LTVs of 75% or less in Q4 2022, the percentage increased 1.4% over the previous quarter, going from 61.6% to 63% in just three months. This indicates that prospective home buyers are saving more for their deposit.
A breakdown of forecasted data for LTV mortgages above 90% between 2023-25
| Quarter and year | % mortgages of over 90% LTV |
|---|---|
| Q1 2024 | 6.06 |
| Q2 2024 | 6.749 |
| Q3 2024 | 6.874 |
| Q4 2024 | 6.441 |
| Q1 2025 | 6.402 |
| Q2 2025 | 7.091 |
| Q3 2025 | 7.216 |
| Q4 2025 | 6.783 |
(Source: Uswitch)
UK mortgage data show the rate of mortgages over 90% LTV could increase rapidly between 2024 and 2025.
By Q3 2025, approximately 7.2% of all UK mortgages may have an LTV of 90% or higher, representing a 2.2% increase from Q3 2022.
However, forecasts also show that Q4 2025 could see the 90%+ LTV rate decrease to 6.7% in the following quarter.
Those looking to secure a mortgage with the best rates generally need to have a deposit of at least 25%, as high LTV mortgages offer the highest mortgage interest rates on the market. The statistics above are a potential sign that consumers are struggling to balance general outgoings (such as rent and other bills) while saving for a deposit, and as such have to utilise high LTV mortgage options.
A breakdown of UK mortgage lending over time, based on level of household incomes
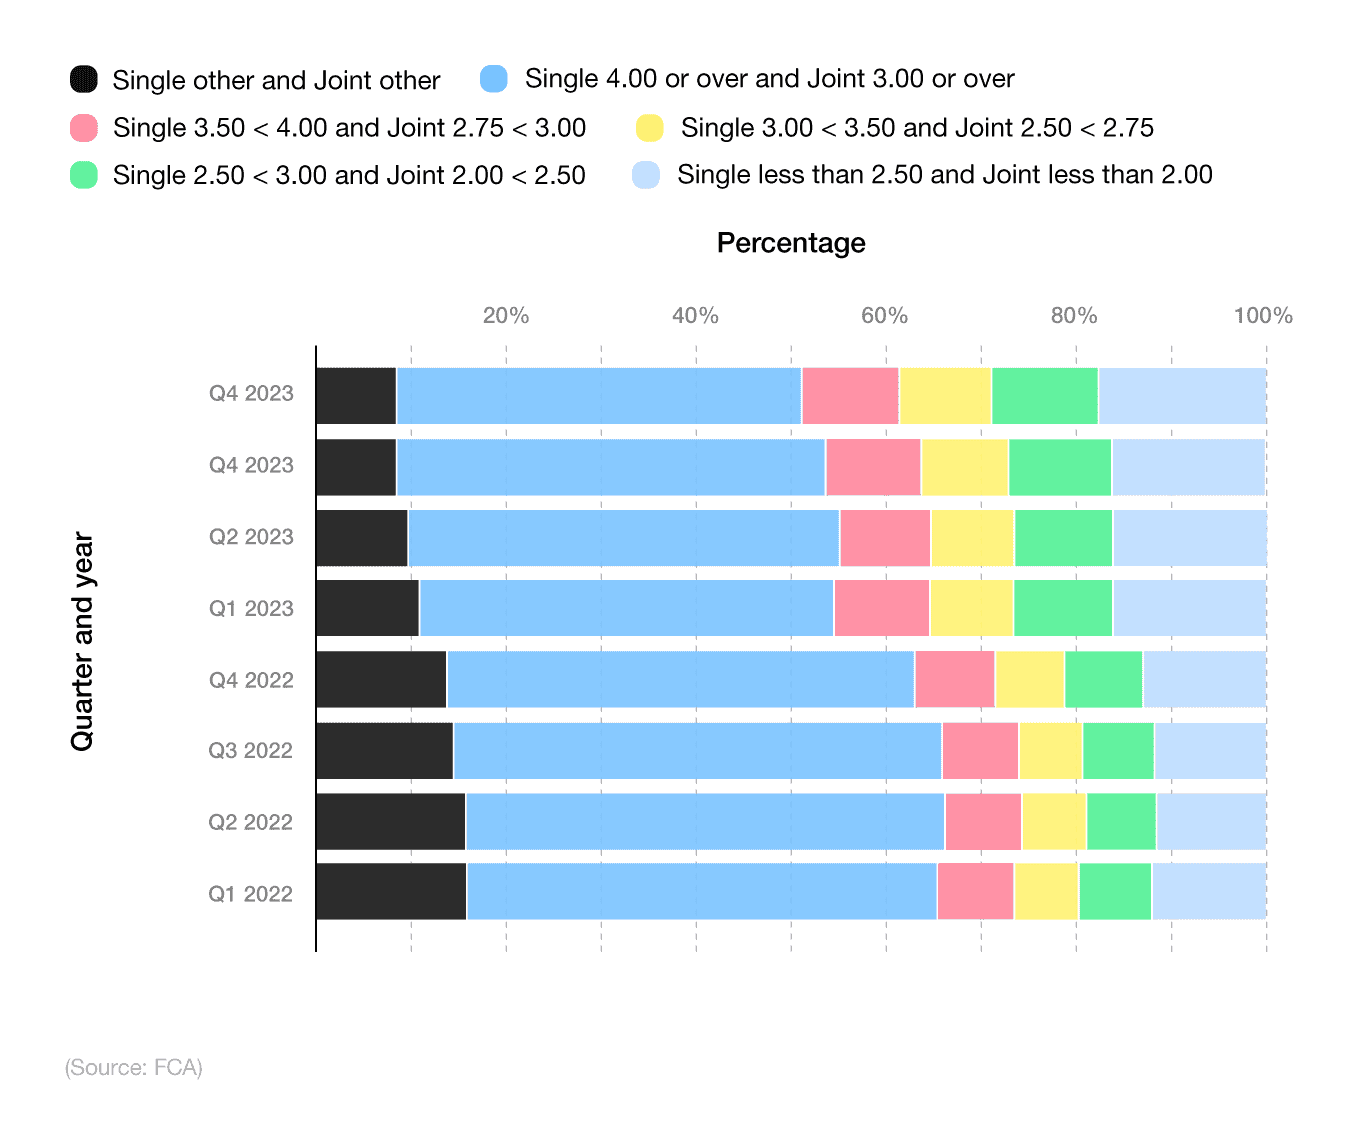
As of Q3 2022, just over half (51.5%) of lending was to borrowers with a high loan-to-income (LTI) ratio. These people are defined as single-income households with an LTI ratio of four or above, or joint-income households with an LTI ratio of three or above. This percentage figure dropped quarter-on-quarter throughout 2023, down to just over two-fifths (42.7%) of the UK mortgage market by Q4.
Single-income borrowers with an LTI ratio between 3-3.5, and joint-income borrowers with an LTI ratio between 2.50-2.75, occupied the smallest group in the mortgage lending statistics for 2022. Yet, by the end of 2023, this accolade had moved to single other and joint other mortgages, which accounted for 8.4% of the UK market in Q4 2023.
If you have a 20% deposit, then an 80% LTV mortgage may be the best option for you. Alternatively, if you’re able to save a deposit worth 15%, then there are 85% LTV mortgages available in the mortgage market.
UK mortgage repayment statistics
Average mortgage repayment in the UK
As of Q1 2024, the UK average mortgage repayment is around £1,176 per month. This is based on an average mortgage of £184,445 taken out over 25 years at the average 2-year fixed rate of 75% LTV of 5.89% (at the time of writing).
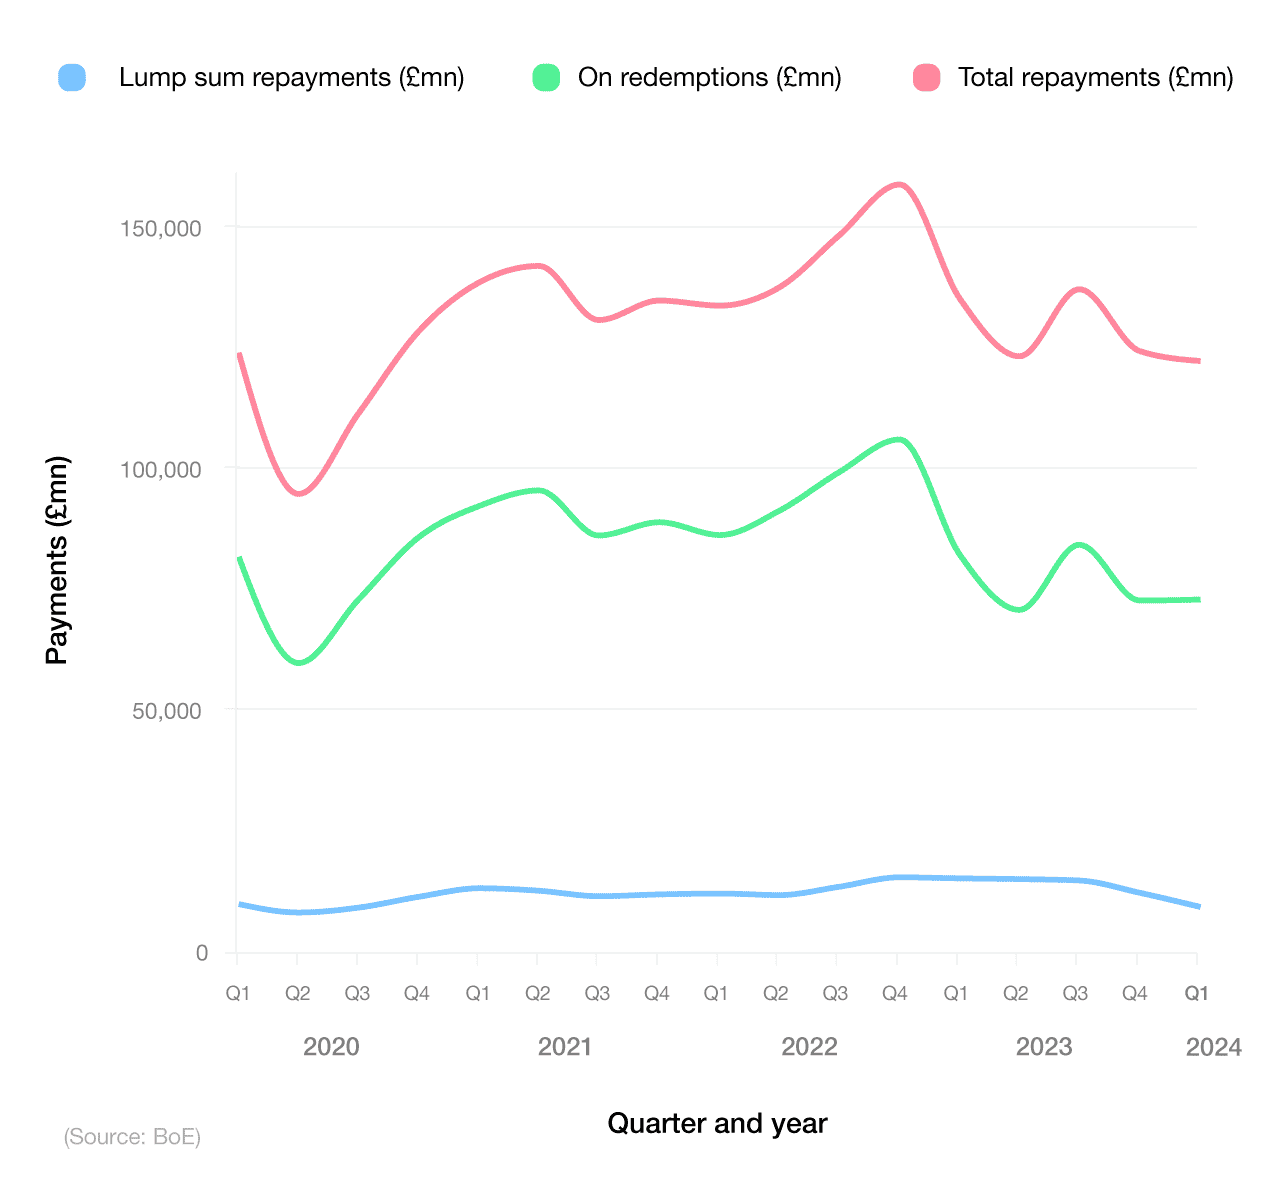
Between 2020-24, quarterly total repayments on secured loans for UK dwellings fluctuated significantly between almost £38.4 billion in Q2 2020 and just over £64 billion in Q4 2022. By Q1 2024, the respective figure for total mortgage repayments stood at approximately £49.4 billion – a decrease of more than a fifth (22.9%) in almost 18 months.
UK mortgage repayments on redemption fees
Redemption charges refer to the early repayment fees that a borrower must pay if they wish to repay their loan back earlier than the final repayment date. Between 2020-24, the value of repayments on the redemption of secured loans for UK dwellings altered dramatically between £24.4 billion in Q2 2020 and £42.9 billion in Q4 2022.
As of Q1 2024, this value stood at £29.6 billion. Back in Q1 2012, £20.8 billion was paid in early repayment charges, rising to a peak of £43.2 billion in 2018 (an increase of over 50%). Largely due to Covid-19, the amount repaid decreased in Q2 2020 by approximately £10 billion less than the same period in 2019.
Lump sum repayments on UK mortgages
Lump sum repayments are when a mortgage borrower decides to pay extra off their mortgage, in addition to the standard monthly payment. Since 2012, the value of mortgage repayments in the UK has generally increased, in between periods of stagnation or fluctuation. As of Q1 2024, the amount of lump sum mortgage repayments stood at almost £4.2 billion, a drop of almost two-fifths (37.1%) from a peak of £6.6 billion in Q4 2022.
An expected drop occurred in Q2 2020 to £3.7 billion but soon picked up again over the subsequent months of 2020 at rates not experienced since 2015-16.
Average age to pay off a mortgage in the UK
According to survey data from Just Group, the average age to pay off a mortgage in the UK is now 65. More than a quarter (27%) of those born between 1965 and 1980 aren’t confident they will pay their mortgage off before they turn 67, with almost half of these (13%) firmly believing they won’t.
This figure rises to more than a quarter (26%) for London residents, indicating the impact of higher house prices in the capital on people’s mortgage repayment expectations.
The study also highlights that:
Almost half (45%) of the Gen X mortgage population admitted it was taking longer to pay off their mortgage than they had hoped.
More than a third (34%) had extended their mortgage in order to reduce monthly payments.
A further third (32%) said they had to extend their mortgage to allow them to fund home improvements, with around one in four (23%) claiming it was in direct response to rising interest rates.
UK mortgage arrears statistics
Mortgage arrear statistics from UK Finance suggest the amount of money owed by UK homeowners has decreased slightly between 2021-24, reaching a low of £8.7 billion in Q1 2024. This represents a drop of around 3% from a peak of almost £9 billion at the start of 2021.
A breakdown of UK mortgage arrears statistics over time
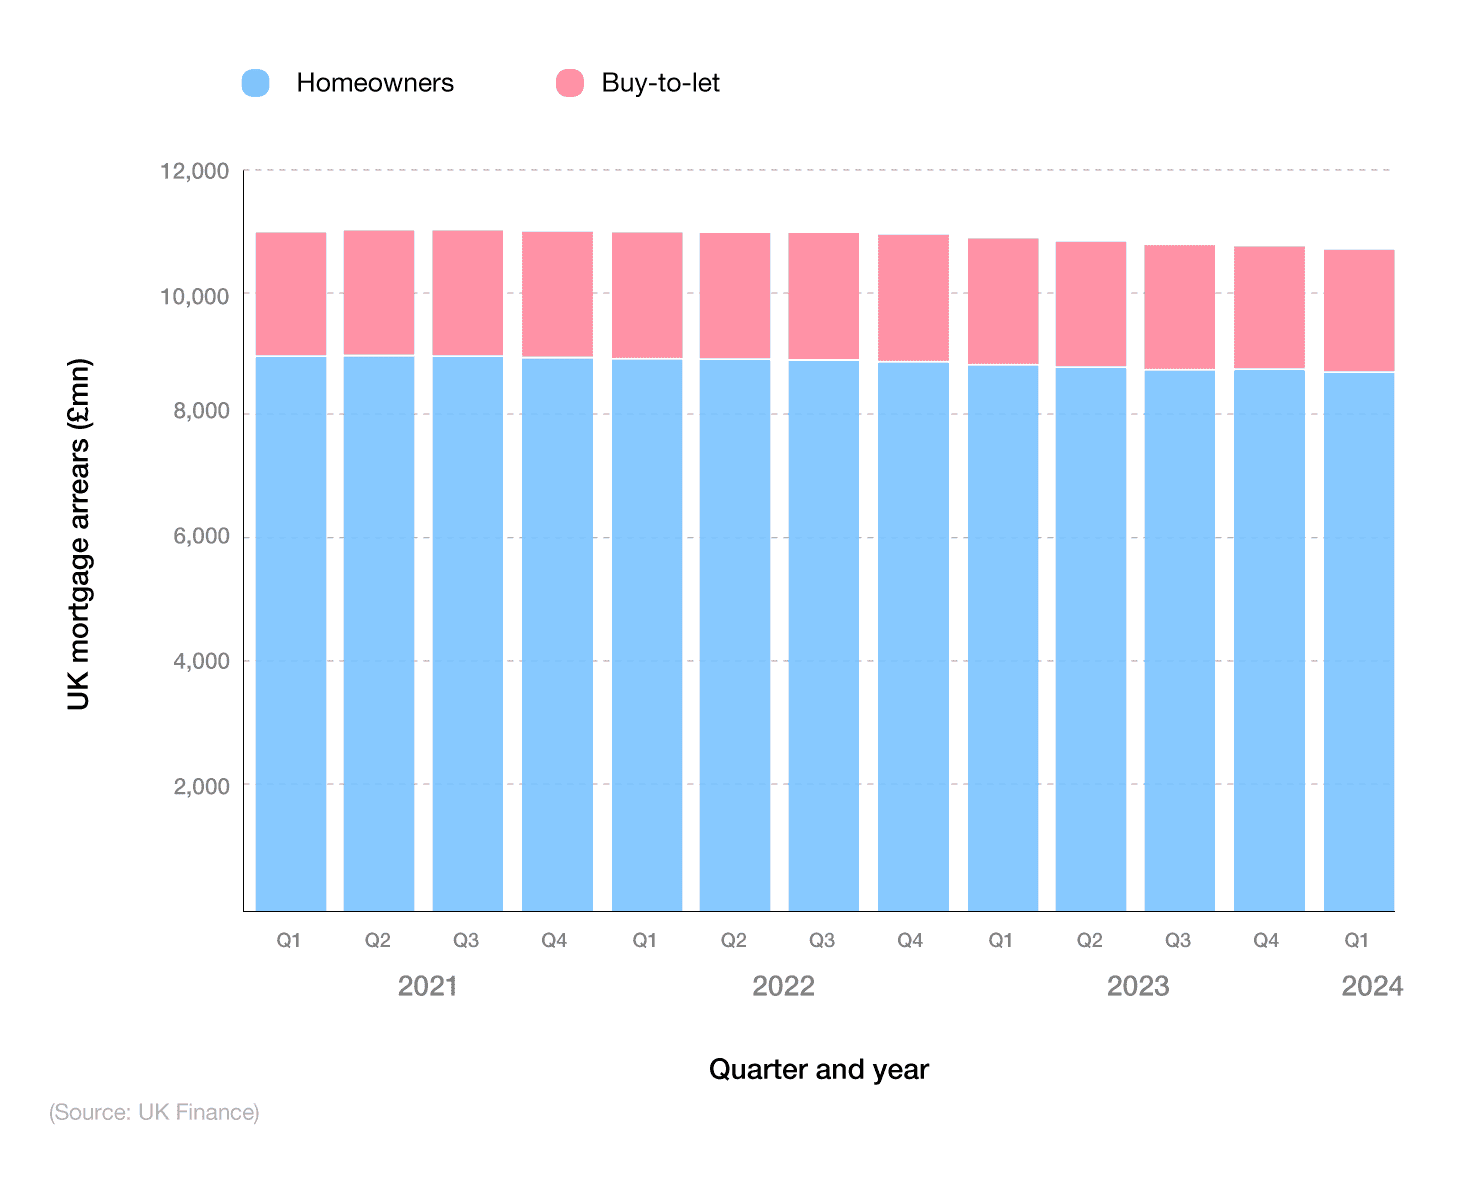
UK homeowners tend to have arrears around four times greater than those with a buy-to-let mortgage. This respective figure fluctuated around the £2 billion mark between Q1 2021 and Q2 2023 before dipping to £1.98 billion in Q4 2023 and Q1 2024.
A breakdown of the number of UK mortgage arrears 2.5% and above the outstanding balance
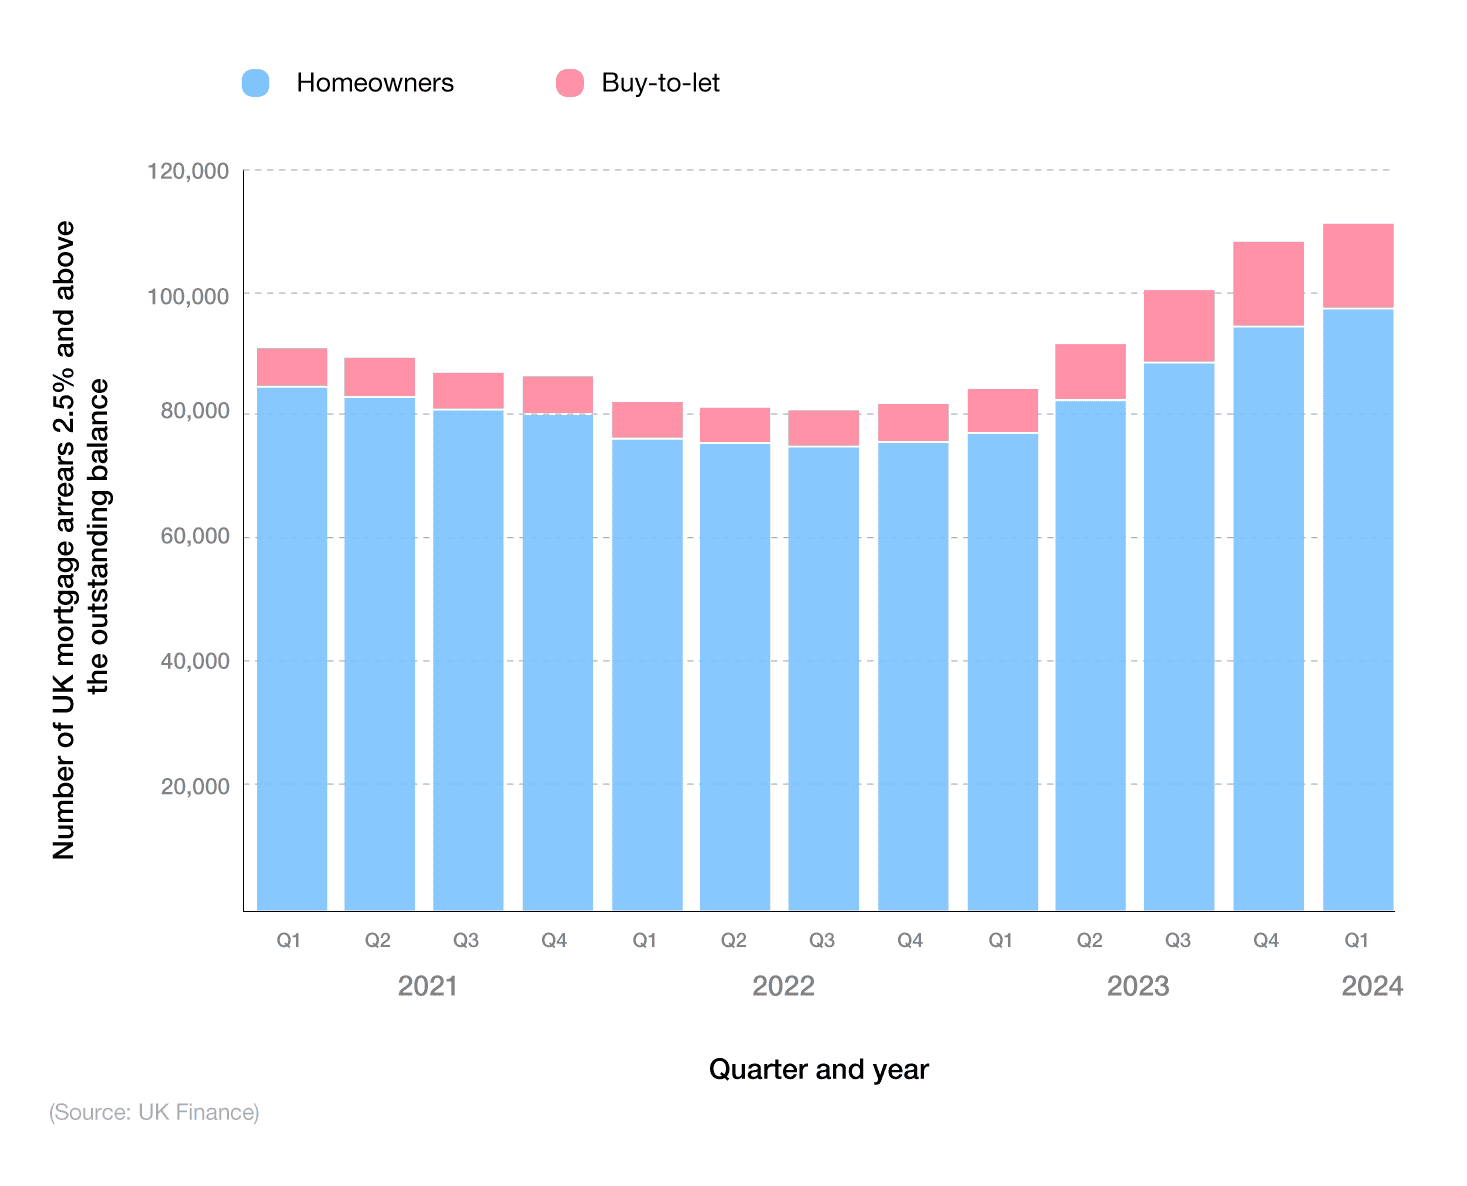
As of Q1 2024, the number of UK mortgages with arrears of 2.5% and above the outstanding balance stood at 110,150, with almost 90% of these belonging to homeowners (96,580).
This figure has risen quarter-on-quarter since the low of 74,420 in Q3 2022, representing an increase of almost a third (29.8%) in around 18 months.
Mortgage arrear statistics show these figures for buy-to-let mortgages have more than doubled (+119%) since the start of 2021 to a peak of 13,750 in Q4 2023 and Q1 2024.
A breakdown of UK mortgage arrear statistics, by homeowner or buy-to-let in Q1 2024
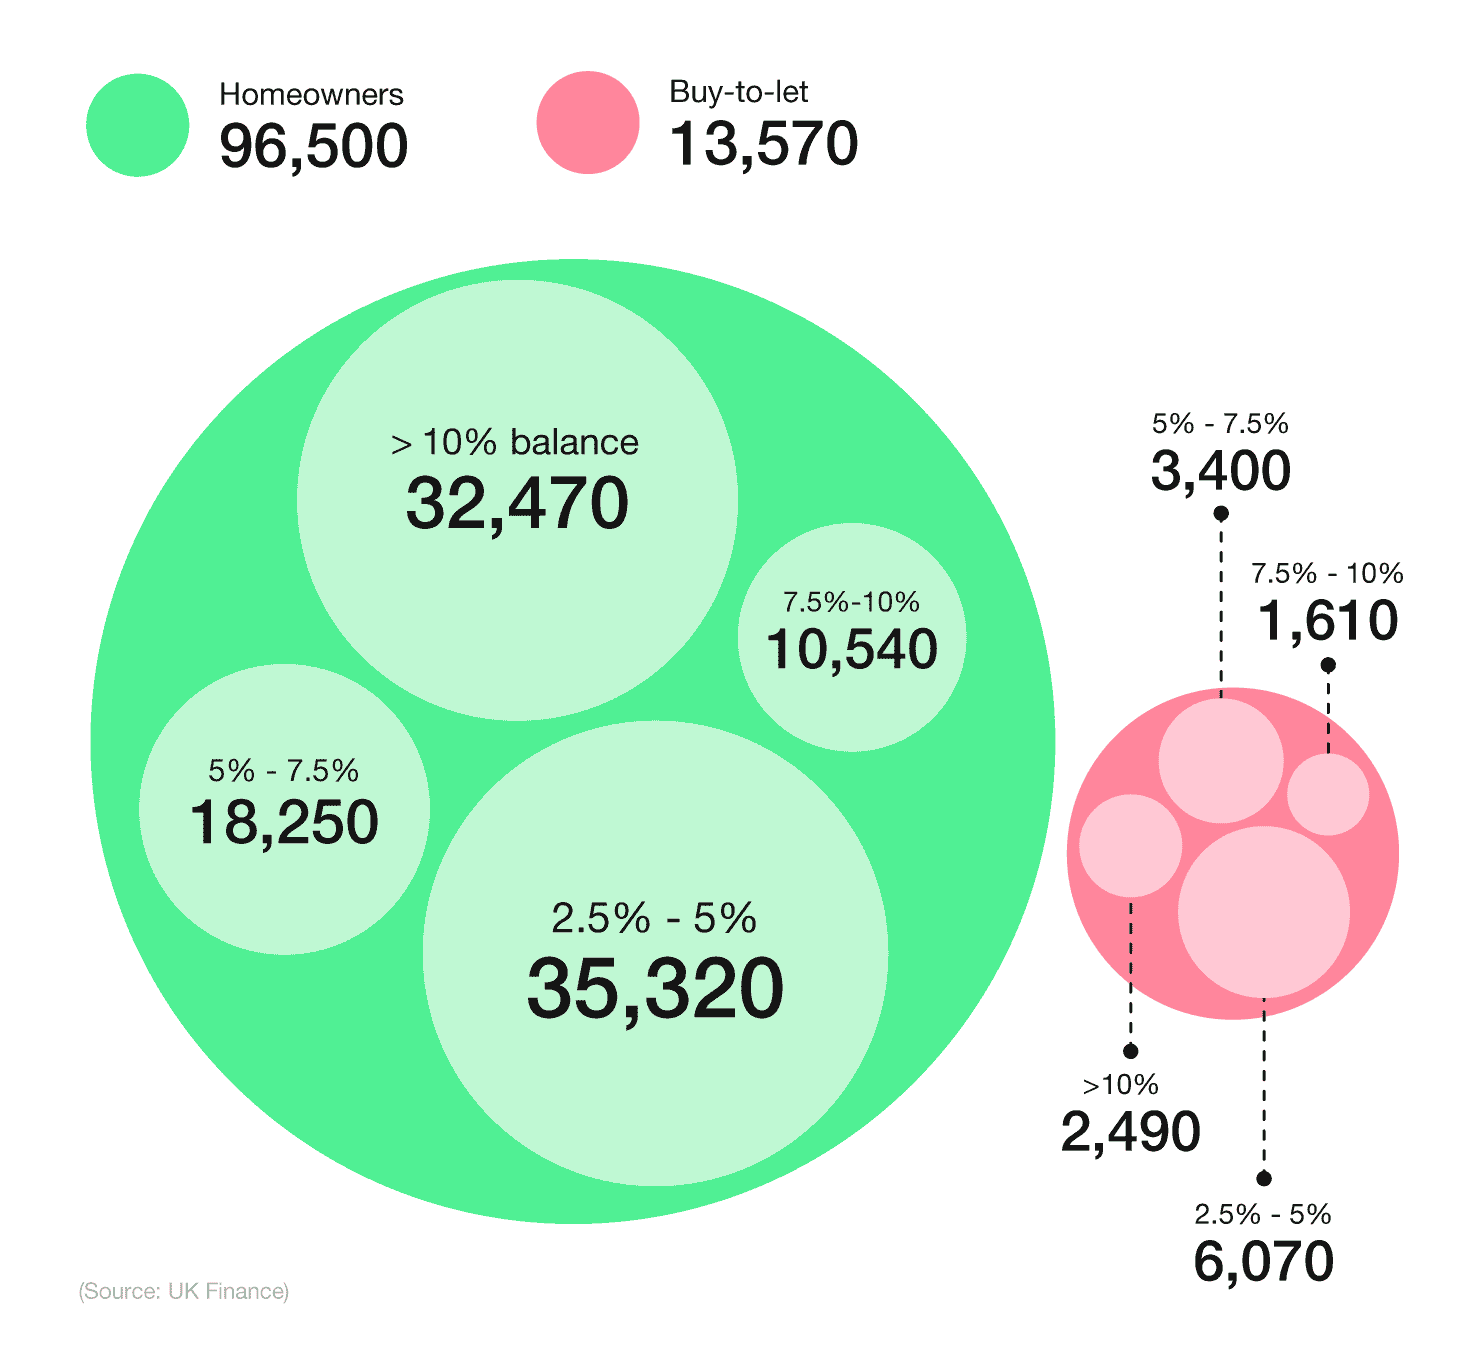
| Arrears of 2.5% - 5% of balance | Arrears of 5% - 7.5% of balance | Arrears of 7.5% - 10% of balance | Arrears of over 10% of balance | |||||
|---|---|---|---|---|---|---|---|---|
| Quarter and year | Homeowners | Buy-to-let | Homeowners | Buy-to-let | Homeowners | Buy-to-let | Homeowners | Buy-to-let |
| Q1 2021 | 30,920 | 2,820 | 15,050 | 1,170 | 9,340 | 580 | 28,700 | 1,610 |
| Q2 2021 | 29,170 | 2,730 | 14,770 | 1,200 | 9,070 | 590 | 29,370 | 1,740 |
| Q3 2021 | 27,530 | 2,440 | 14,310 | 1,130 | 8,870 | 610 | 29,650 | 1,700 |
| Q4 2021 | 26,860 | 2,470 | 13,980 | 1,200 | 8,790 | 610 | 30,010 | 1,730 |
| Q1 2022 | 25,000 | 2,380 | 13,200 | 1,130 | 8,150 | 600 | 29,350 | 1,760 |
| Q2 2022 | 25,250 | 2,130 | 12,740 | 1,120 | 7,980 | 600 | 29,030 | 1,790 |
| Q3 2022 | 25,170 | 2,290 | 12,590 | 1,090 | 7,760 | 600 | 28,900 | 1,780 |
| Q4 2022 | 26,390 | 2,570 | 12,640 | 1,080 | 7,750 | 640 | 28,390 | 1,770 |
| Q1 2023 | 27,690 | 3,400 | 12,910 | 1,200 | 7,840 | 660 | 28,180 | 1,760 |
| Q2 2023 | 30,920 | 4,730 | 14,070 | 1,510 | 8,200 | 810 | 28,690 | 1,910 |
| Q3 2023 | 34,110 | 6,270 | 15,670 | 2,240 | 8,680 | 950 | 29,470 | 2,080 |
| Q4 2023 | 35,940 | 6,800 | 17,270 | 3,220 | 9,720 | 1,270 | 30,750 | 2,280 |
| Q1 2024 | 35,320 | 6,070 | 18,250 | 3,400 | 10,540 | 1,610 | 32,470 | 2,490 |
(Source: UK Finance)
Mortgage arrears statistics show that the total number of homeowners behind on their mortgage payments stood at 110,150 in Q1 2024 – a 2.7% increase from the previous quarter.
When broken down by type of arrears, most UK homeowners behind on their monthly mortgage payments in Q1 2024 were down between 2.5-5% of their outstanding balance. With more than 35,000 homeowners in this position, this accounted for almost a third (31.8%) of the overall total for the quarter, and more than a third (36.6%) of the homeowner population behind on their mortgage.
Just behind those are homeowners in arrears of over 10% of their outstanding balance, representing less than one in three (29.2%) of all mortgage arrears and a third (33.6%) of the homeowner population in arrears.
In terms of buy-to-let statistics, more than 6,000 landlords behind on their mortgage in Q1 2024 were in arrears between 2-2.5% of their outstanding balance. This represented 5% of all mortgage arrears, and more than two-fifths (44.2%) of the total landlord population in arrears, for the quarter.
A breakdown of forecasted mortgage arrears in the UK, 2024-25
| Year | Total number of mortgages in arrears |
|---|---|
| Q1 2024 | 135,371 |
| Q2 2024 | 136,477 |
| Q3 2024 | 137,952 |
| Q4 2024 | 137,766 |
| Q1 2025 | 144,465 |
| Q2 2025 | 145,571 |
| Q3 2025 | 147,046 |
| Q4 2025 | 146,860 |
(Source: Uswitch)
New data from Uswitch shows a sharp increase in mortgage arrears figures for 2024 and 2025. According to mortgage arrears statistics, approximately 1.4 million homeowners refixed their mortgages in 2023, with interest rates between 4% and 6% above that of 2021. With the vast majority of mortgage holders on a two-year fixed-term policy, many will need to remortgage in the coming years.
Due to this, the rate of remortgage arrears may increase dramatically in 2024, to 137,766 households by Q4. The arrears figure in 2025 is expected to rise once more, going up to 146,860 UK homes in total by the end of the year – a rise of 8.5% from Q1 2024.
UK mortgage debt statistics over time
According to The Money Charity, the number of UK mortgages with arrears of over 2.5% of the remaining balance rose by an average of 53 per day in the year to December 2023.
For those unable to keep up with mortgage payments, this resulted in an average of 56.9 mortgage possession claims and 34 mortgage possession orders per day across England and Wales in Q1 2024.
By the end of March 2024, total UK mortgage debt stood at approximately £1.6 trillion – an increase of £553 million (or 0.06%) from the previous year. For the 10.75 million households across the country, this resulted in an average mortgage debt of £150,719.
With an average mortgage interest rate for this period of 3.51%, this means UK households with a mortgage would pay an average of £5,290 in mortgage-related interest across the year.
A breakdown of total money secured on UK dwellings between 2020 and 2023
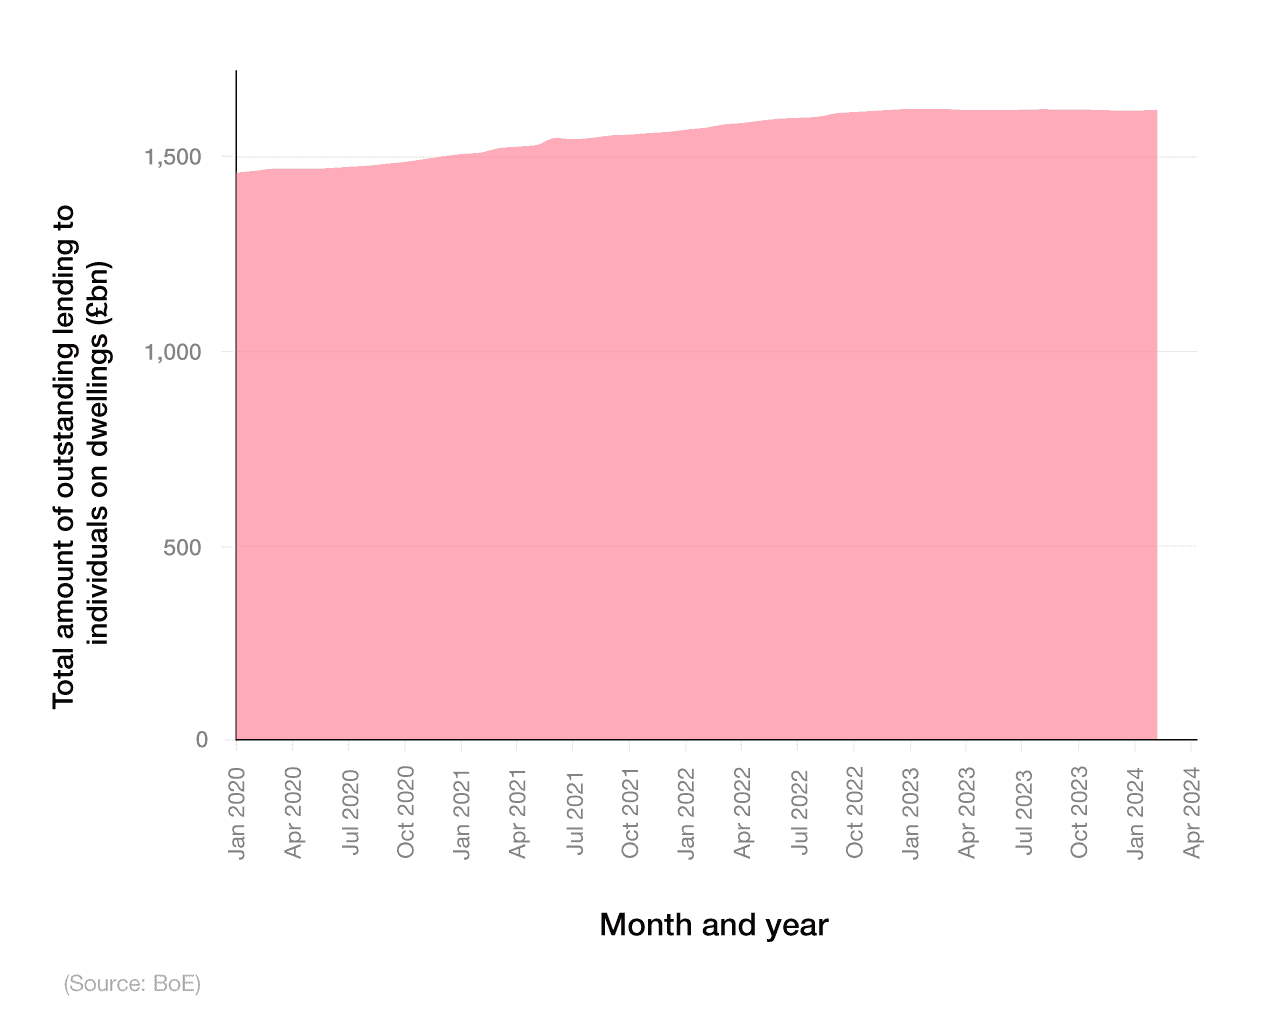
The amount of money secured on dwellings in the UK has slowly increased over time. In January 2020, this figure stood at almost £1.46 trillion, increasing month-on-month to a peak of £1.62 trillion in January 2023 – an 11.3% rise in the space of three years.
Throughout 2023 and the start of 2024, the value of outstanding lending on UK properties stagnated around the £1.62 trillion mark.
Outstanding mortgage balances with arrears
BoE mortgage statistics show that, as of Q4 2023, the total value of outstanding mortgages with arrears was over £54 billion – a reduction of £8.3 billion (or 13.3%) from the previous quarter and £31.9 billion less (or 37.1%) compared to the peak of Q3 2022.
A breakdown of UK mortgage lending by total amount and type of mortgage borrower
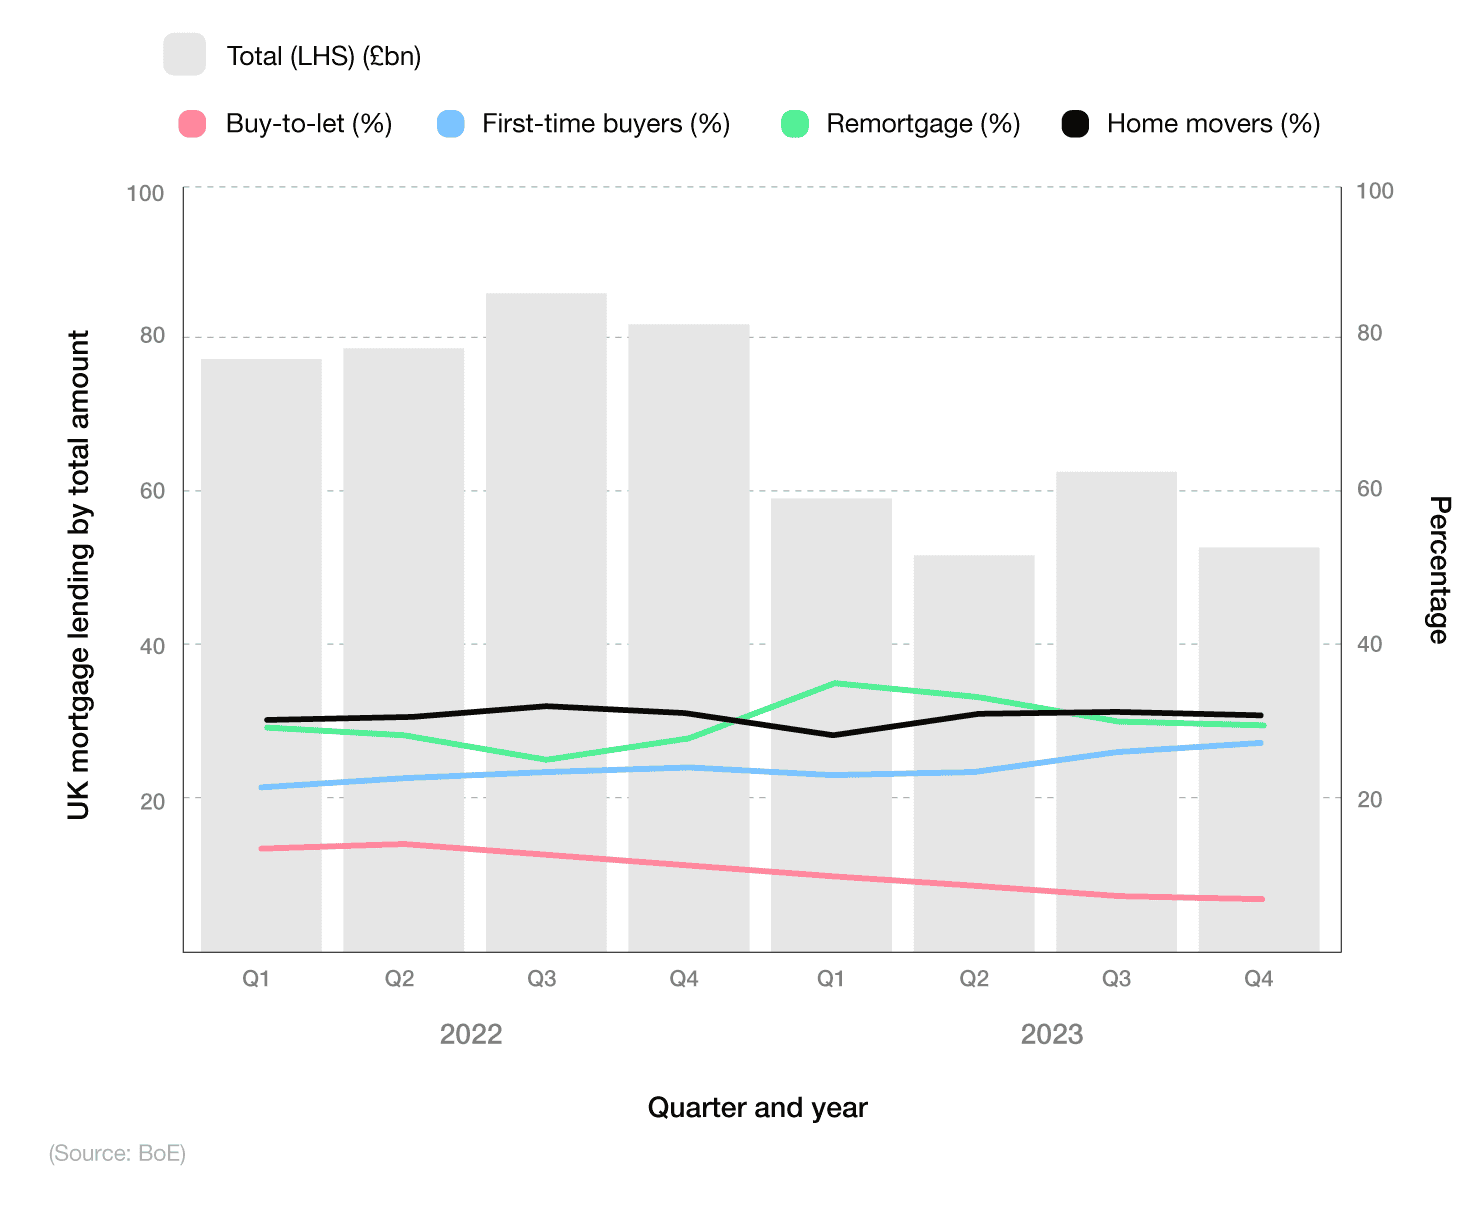
Key trends from the data show:
The share of gross mortgage advances for those moving home was just under a third (31.5%) in Q4 2023, narrowly ahead of those remortgaging (29.7%).
First-time buyers accounted for just over a quarter (27.1%) of mortgages during this time, with buy-to-let representing just 7% – the least popular option for Q4 2023.
Mortgage advances for remortgaging reached a peak of 34.8% in Q1 2023 but dipped almost 5% by the end of the year.
Contrary to this, advances for first-time buyer mortgages were just over a fifth (21.4%) of the total for Q1 2022, gradually rising to a peak of 27.1% by the end of 2023 (an increase of 5.7 percentage points in the space of two years).
Buy-to-let loans showed the inverse of first-time buyers, almost halving over the same period from 13.6% to 7%.
A breakdown of outstanding UK mortgage balances over time
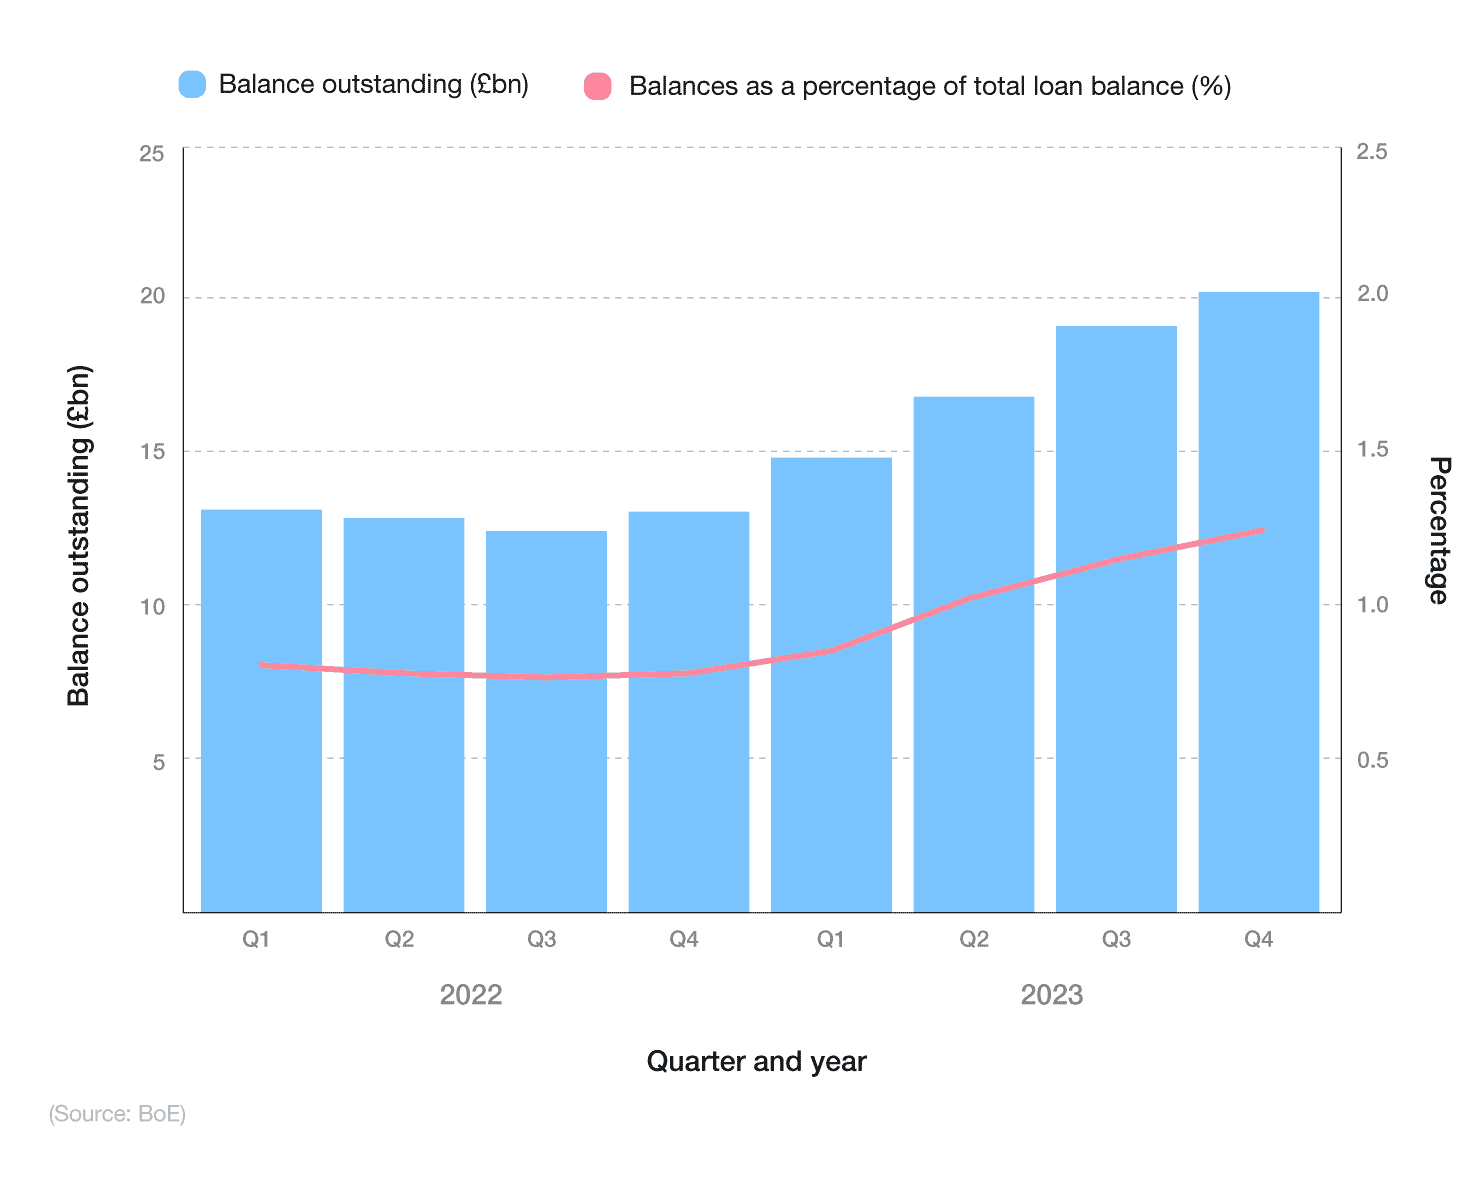
The value of outstanding balances with arrears refers to borrowers who fail to make their contractual (re)payments that are equivalent to at least 1.5% of the outstanding mortgage balance, or where the property is in possession.
At the beginning of 2022, the value of outstanding balances with arrears amounted to £13.3 billion. This represented a decrease of 1.1% since the previous quarter and a drop of 11% compared to the same period in 2021 (£15 billion).
However, that figure had increased by Q4 2022, rising up £300 million to £13.6 billion. As a percentage of total outstanding mortgage balances, this equated to 0.81%.
Between Q3 and Q4, the outstanding balances increased by £600 million, highlighting the market fluctuations felt as part of the fiscal recovery from the Covid-19 pandemic.
By Q4 2023, the UK had an outstanding mortgage balance to the tune of £20.3 billion – a figure that has increased quarter-on-quarter since Q3 2022. As a percentage of the total loan mortgage balance, this represented 1.23% (a 0.45 percentage point increase from Q3 2022).
A breakdown of forecasted mortgages by single-income households, 2023 - 2025
| Year | % of mortgages paid by a single-income |
|---|---|
| Q1 2023 | 33.92 |
| Q2 2023 | 33.13 |
| Q3 2023 | 32.45 |
| Q4 2023 | 32.84 |
| Q1 2024 | 32.97 |
| Q2 2024 | 32.18 |
| Q3 2024 | 31.49 |
| Q4 2024 | 31.89 |
| Q1 2025 | 32.01 |
| Q2 2025 | 31.22 |
| Q3 2025 | 30.53 |
| Q4 2025 | 30.93 |
(Source: Uswitch)
As the BoE base rate rises and inflation remains above 8%, homeowners are feeling the squeeze more and more. Original mortgage data from Uswitch show that the rate of single-income mortgages should drop consistently between 2023-25.
As of Q1 2023, just over one in three (33.92% of) UK mortgages were on single-income homes. However, from thereon in, the predicted figures begin to gradually reduce.
By Q4 2025, just 30.93% of all UK mortgages could be from single-income households, representing a drop of nearly 3% in a little over two-and-a-half years.
UK mortgage repossession statistics
Mortgage repossessions occur when a borrower fails to keep up with mortgage (re)payments, and the lender takes possession of the property. This is often used as a last resort, once all other options have been exhausted and individual financial circumstances have been taken into account.
UK properties can be taken into possession by the courts for failing to keep up with mortgage repayments.
As of 2023, almost 16,600 repossession claims were filed, with the vast majority (57%) ending up in court orders. Just 952 (or 5.7%) resulted in a repossession of the property.
Between 2013 and 2020, the number of repossession claims for UK properties decreased dramatically, from 53,659 to just over 5,500. Incidentally, the figure of 16,599 for 2023 represents more than double the combined numbers for 2020 and 2021.
A breakdown of UK mortgage repossessions over time
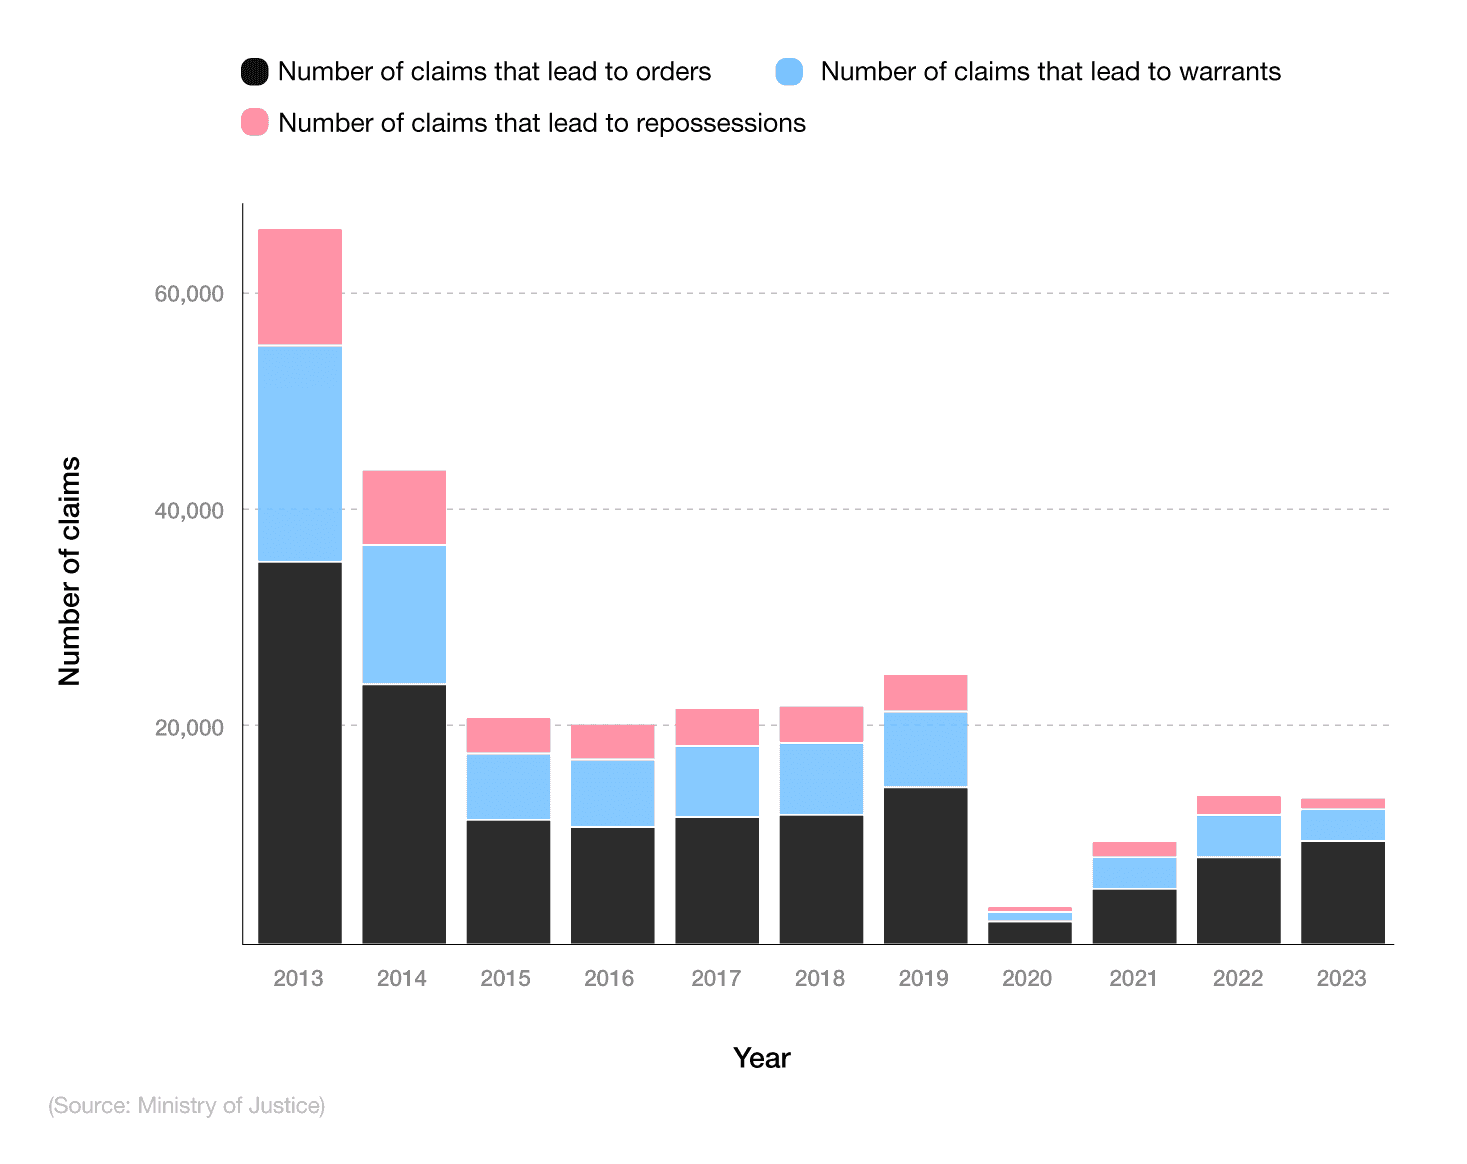
Between 2013 and 2023, the total number of property repossessions in the UK decreased from 10,729 to just 952.
According to mortgage arrears statistics, the fourth quarter of 2022 saw 733 completed repossessions out of a possible 3,160 possession claims. In Q4 2021, one year before, the number of completed repossessions was just 309, meaning a 237% year-on-year increase.
It’s worth noting that the rate of claims to completed repossession is the lowest since records began in 1999. Just 3.5% of all claims lead to homeowners losing their property, a far cry from the 29% average claim-to-repossession rate seen in 2010.
Lenders have facilities to discuss mortgage payment issues, be they mortgage repayment holidays or an extension in time to your current mortgage. Always contact your lender to discuss the best way to deal with your mortgage repayment concerns.
A breakdown of mortgage possession statistics between purpose of loan (homeowners vs. buy-to-let)
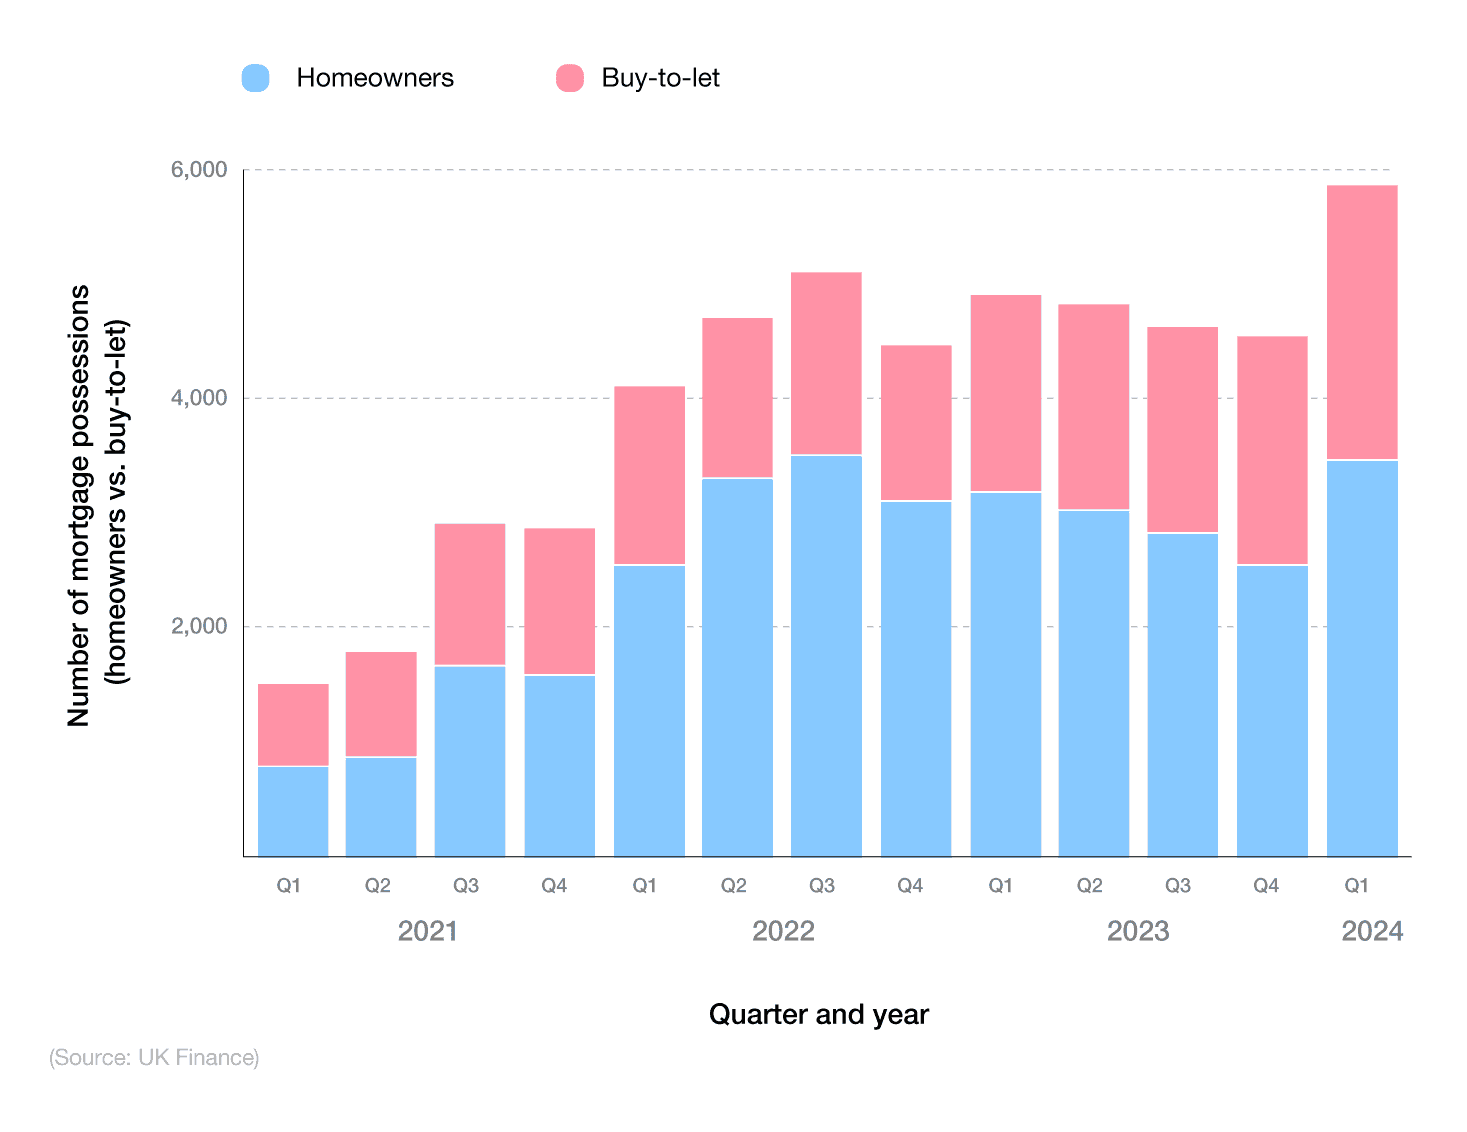
According to mortgage possession statistics from UK Finance, there were 1,470 properties taken into possession in Q1 2024. Approximately three-fifths (59.1%) of these were for homeowner properties, with the remaining two-fifths (41.9%) for buy-to-let landlords.
Since 2020, these figures have more than quadrupled for homeowners and more than tripled for those with a buy-to-let mortgage.
UK mortgage market statistics
In terms of building society assets, Nationwide dominates the UK mortgage lending market, with over £269 billion. This accounts for over half (54%) of all society assets on the market.
Yorkshire Building Society and Coventry Building Society are second and third, with £74.2 billion and £61.7 billion worth of assets, respectively. Skipton (£34.7 billion) and Leeds (£28.2 billion) complete the top five.
A breakdown of UK building societies by value of assets
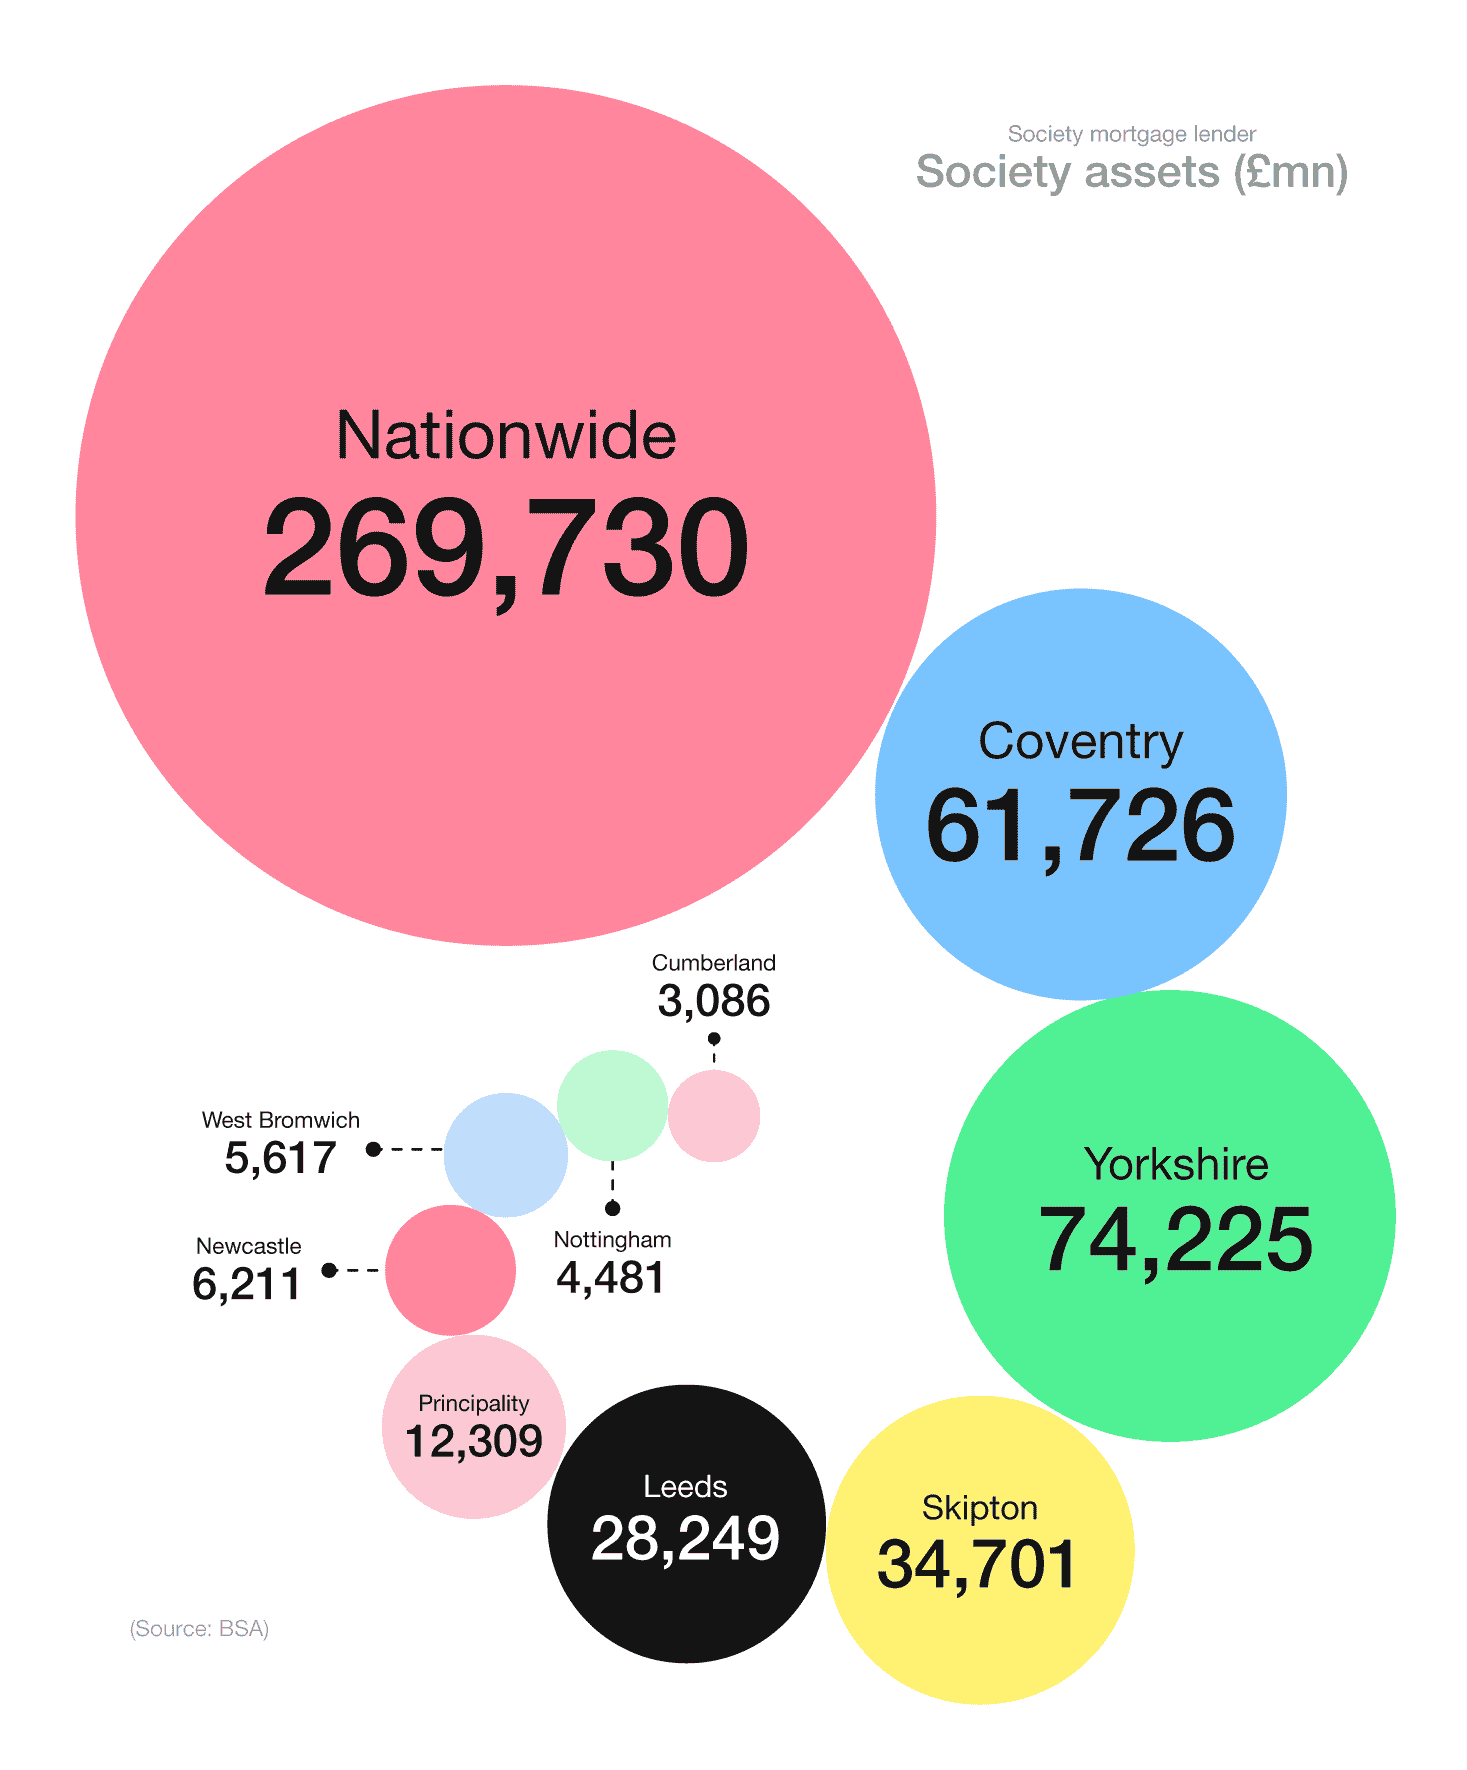
In all, Nationwide’s society assets are worth around £39 million more than the rest of the top 10 combined.
A breakdown of UK mortgage lenders by market share percentage and gross mortgage lending
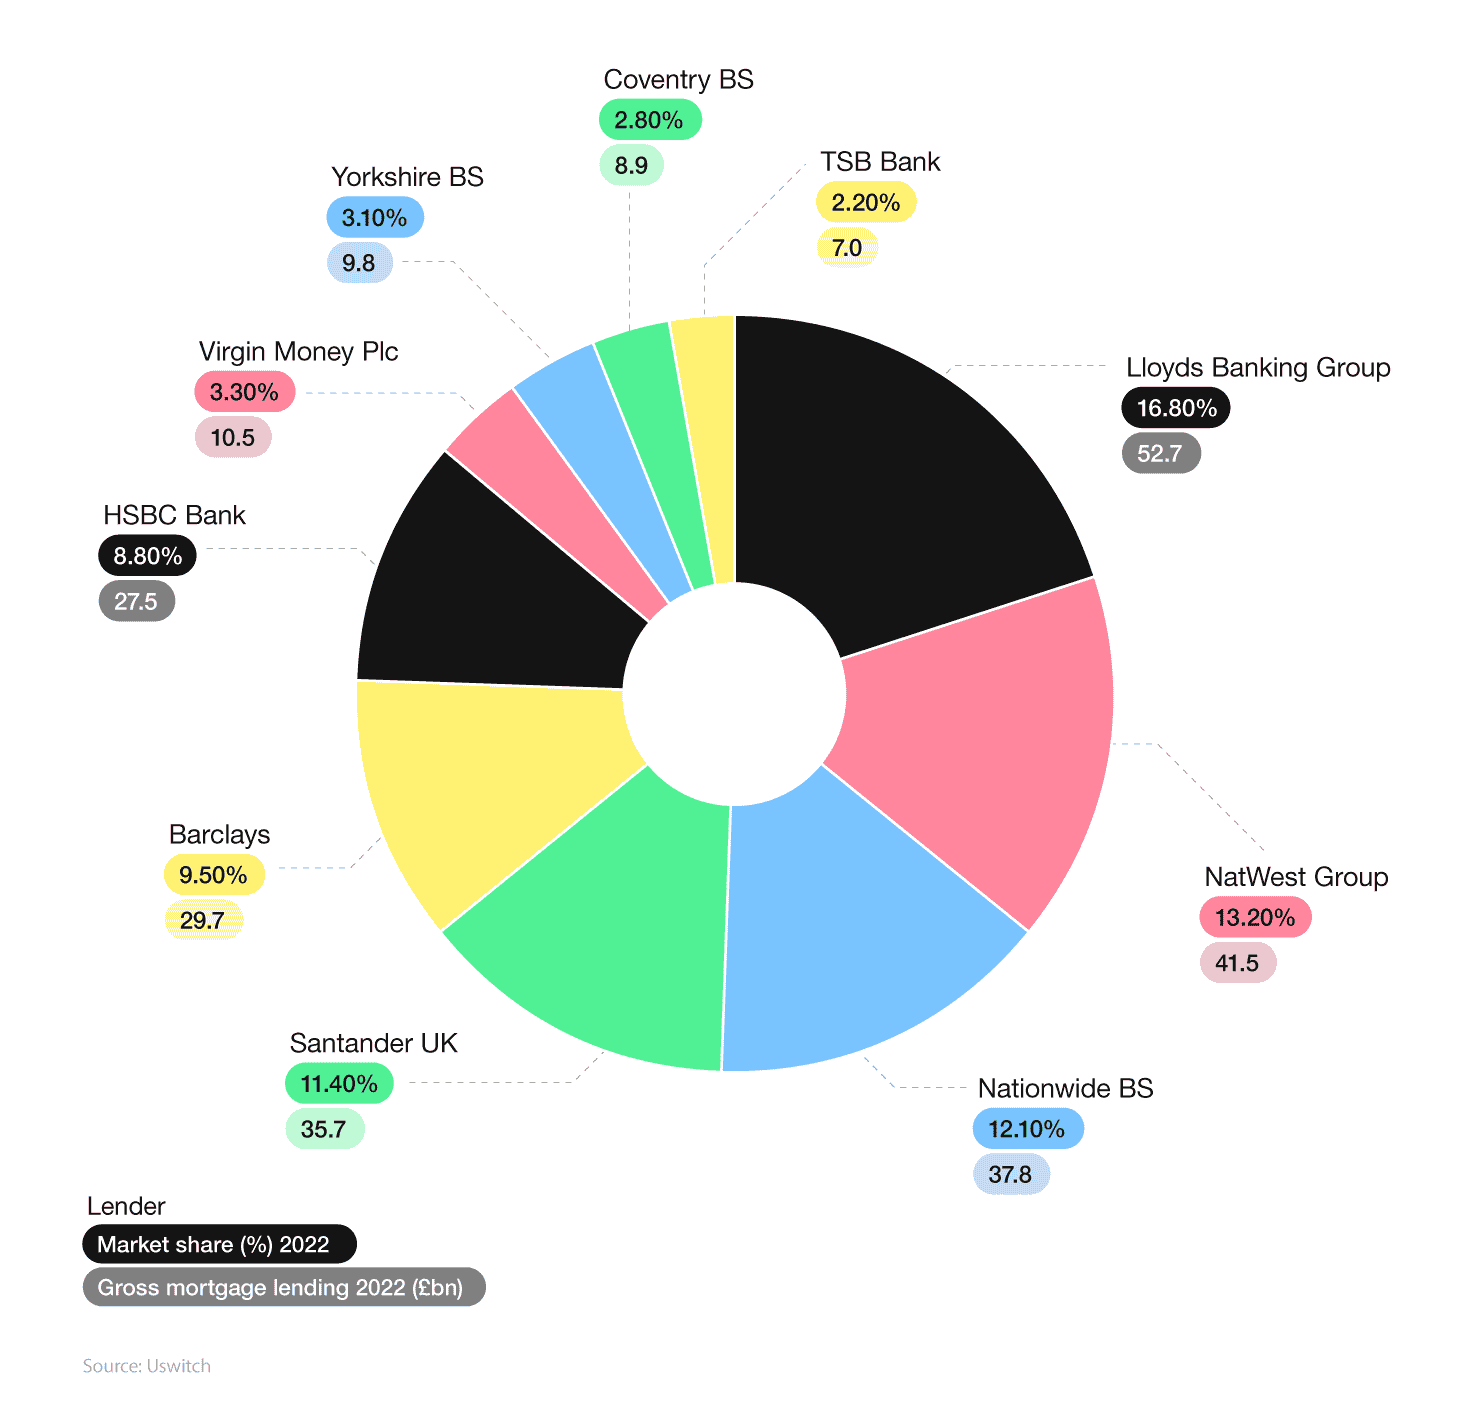
According to the most recent UK mortgage statistics available from UK Finance, Lloyds Banking Group had the largest percentage market share of mortgages in 2022. This accounted for around a sixth (16.8%) of the overall total, with a gross mortgage lending figure of £52.7 billion for a year – £11.2 billion more than second-placed Natwest Group.
This was followed by Nationwide Building Society in third, with a market share of 12.1% and gross mortgage lending of £37.8 billion for 2022 – around a third (32.9%) less than Lloyds Banking Group.
UK mortgage complaint statistics
Mortgage complaint statistics from the Financial Ombudsman show more than 9,500 grievances related to mortgages were registered between 2022-23.
A breakdown of UK mortgage complaint statistics by type of mortgage
| Type of mortgage | Number of complaints (2022-23) |
|---|---|
| Buy-to-let mortgages | 941 |
| Equity release | 468 |
| Non-mortgage residential finance | <10 |
| Residential mortgages | 8,125 |
| Total (all mortgages) | 9,540 |
(Source: Financial Ombudsman Service)
Of these, the vast majority (85%) were for residential mortgages, with around one in 10 (9.9%) relating to buy-to-let mortgages.
As of 2023, there were 8,421 customer complaints to the Financial Ombudsman with regard to mortgage products and services. This equated to almost nine in 10 (88%) of all complaints for the year. In all, just 2.2% of mortgage complaints related to products and services were specifically about mortgage endowments.
A breakdown of mortgage product complaints, between 2013 and 2023
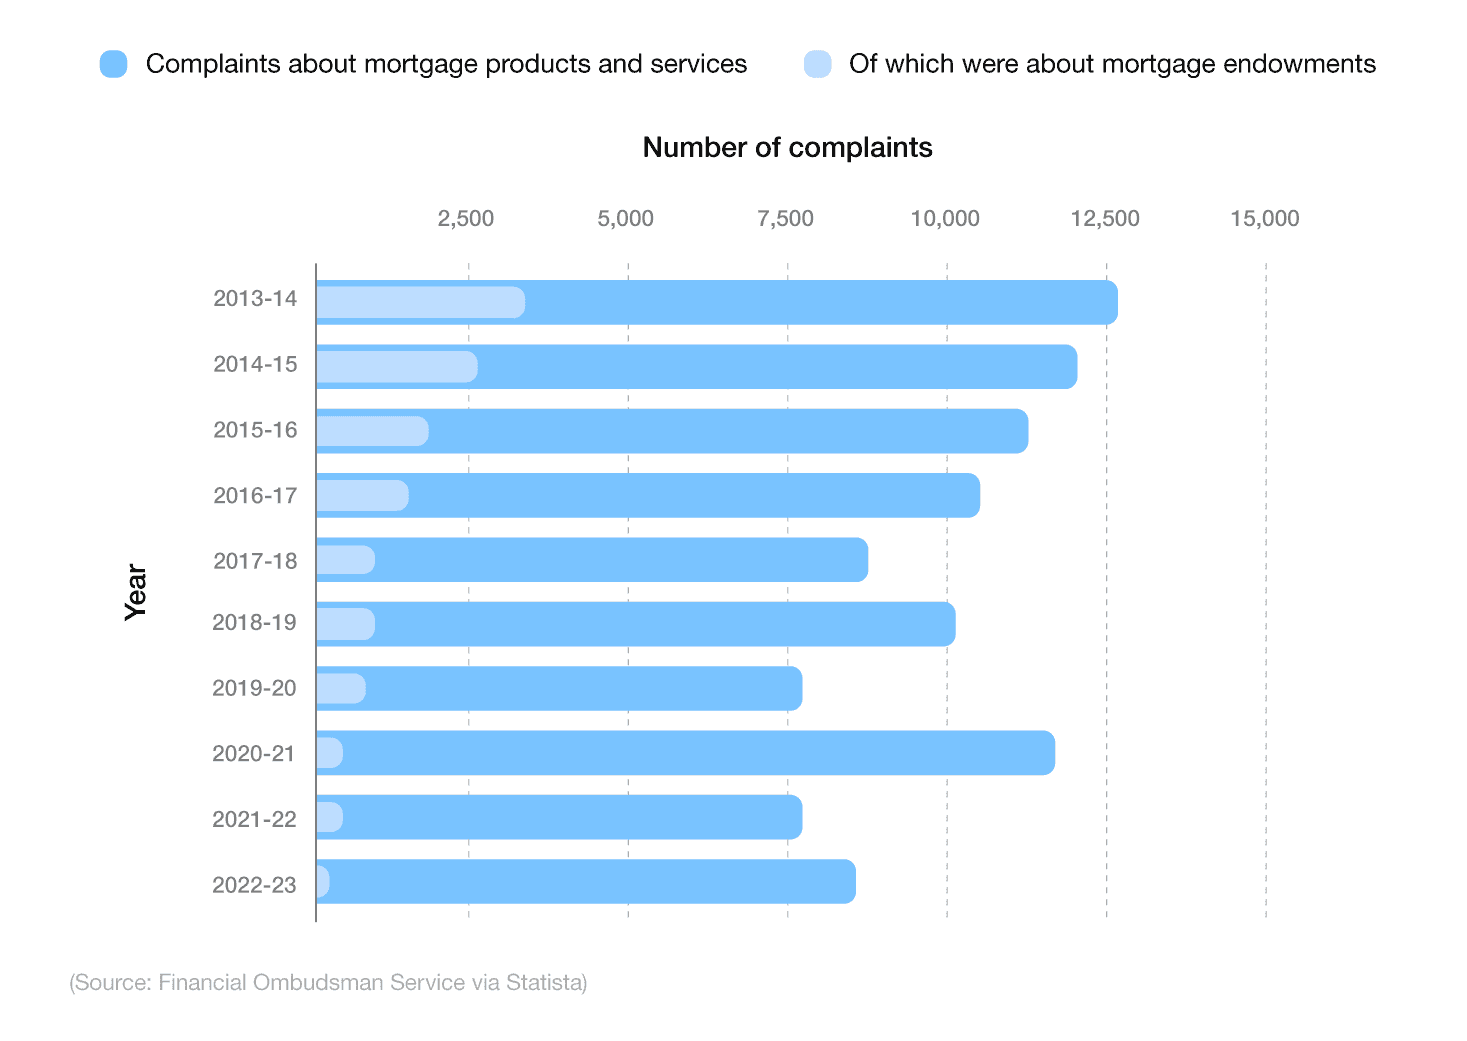
Between 2009 and 2020, the number of complaints to the Financial Ombudsman regarding mortgage products, services, and endowments fluctuated. In 2020/21, more than 12,600 new customer complaints were logged, with almost 94% of these regarding mortgage products and services.
Complaints regarding mortgage endowments have been historically low since 2009. They rose to a peak of over 4,600 in 2012, accounting for just over a quarter (28%) of all registered mortgage complaints for that year. However, in 2020, they were at a record low (only 769 for the year).
In 2021, total complaints started to decrease from the high of 2020. According to UK mortgage industry statistics, the Financial Ombudsman Service received 9,280 mortgage complaints and enquiries in 2021, almost 3,000 fewer than the preceding year.
Of those, just 352 were related to mortgage endowments – a 55% reduction from complaints made in 2020.
Remember, if you’re not happy with your current mortgage, then switching your mortgage provider could help find a better product and save you money.
UK mortgage fraud statistics
Mortgage fraud usually involves individual(s) or organised criminal gangs working in tandem with at least one corrupt associate, such as an accountant, solicitor, or surveyor.
This can take many forms, including:
Over-valuation of a property
Overstating a salary or income
Taking over genuine conveyancing processes
Committing identity theft (such as taking out a mortgage in someone else’s name without their knowledge, or that of a deceased person)
Taking out multiple mortgages with different lenders at one address
Manipulating or falsifying Land Registry data
Changing the deeds to a property without the owner’s knowledge and using this to then sell the property.
In January 2024, mortgage research by Cifas found that one in six (16%) of UK adults admitted that they (or someone they know) had deliberately misled mortgage companies about their salary in order to buy their perfect home.
The survey of 2,000 adults also reveals people are prepared to inflate their earnings by as much as £10,000 (and even forge payslips) in order to get the property of their dreams.
Key findings from the study show that:
Around one in seven (14%) of respondents didn’t think it was illegal to provide false information to a mortgage lender.
Nearly one in 10 (9%) believed it was ‘reasonable’ to exaggerate their income.
The most likely age group to commit this type of fraud was those aged 25-34 (16%).
Cifas also found a year-on-year increase in people committing first-party fraud, with around one in eight (12.5%) admitting they had done so in the last 12 months.
Research from Apex Bridging supports this notion, highlighting that mortgage-related fraud increased by around a third (32.8%) between 2022 and 2023. This represented the second-highest increase of all banking and credit industry fraud.
That said, there were 1,723 identified cases between April 2022 and March 2023. This equated to just 0.2% of total cases within the sector, which stood at 1.1 million during this period.
A breakdown of UK mortgage fraud by first and third-party fraud
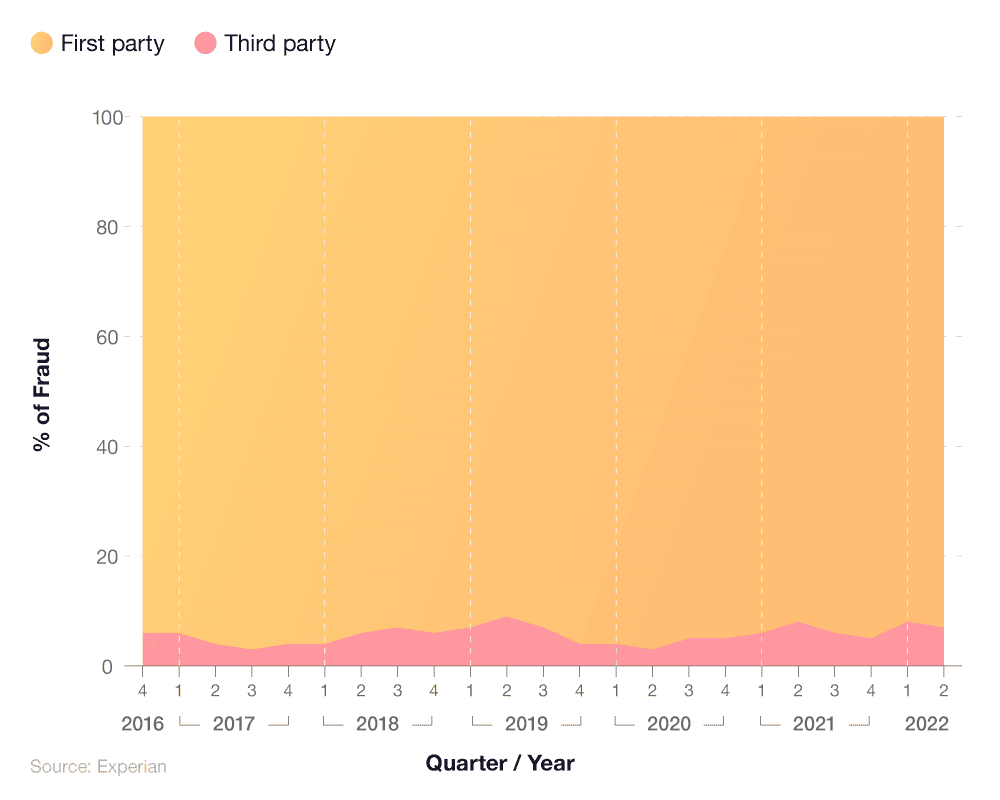
Between 2017 and 2022, the overwhelming majority of mortgage fraud has been first-party (meaning there is no abuse of identity details and the fraudster is indeed the person applying for the mortgage). Over this six-year period, this figure has remained over 90%, reaching highs of 97% in Q3 2017 and Q2 2020.
First-party fraud accounted for 93% of mortgage fraud in Q2 2022, which was the third lowest quarter after 91% in Q2 2019, according to UK mortgage fraud statistics. This means for Q2 2022, 7% was attributed to third-party fraud, whereby someone creates or uses accounts of other people without their consent. This is most commonly associated with identity fraud.
A breakdown of UK mortgage fraud rates over time
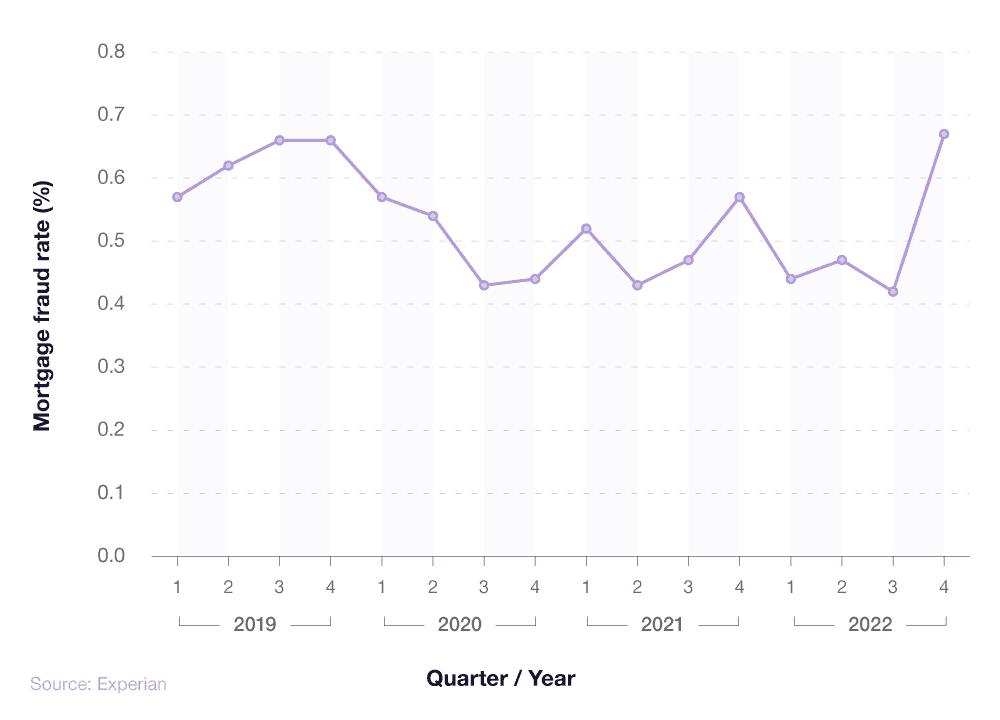
Between 2019 and 2021, the rate of mortgage fraud has generally remained very low, with some minor fluctuations. Q3 and Q4 2019 both saw rates of 0.66%, while Q4 2022 saw a fraud rate of 0.67%, the highest rate recorded in the last three years.
A breakdown of UK mortgage fraud rates in 2022

Based on a monthly breakdown of refreshed 2022 mortgage fraud statistics, the winter month of December sees the peak. Almost one in 100 (0.88%) mortgages issued in the UK commit some variant of fraud. As the UK base rate climbed during the end of 2022, from 1.25% up to 3.5% and beyond, so did mortgage fraud rates.
Meanwhile, at the start of 2022, mortgage fraud rates were just 0.52%. April’s 0.39% rate represented the lowest figure, with the following May (0.45%) and June (0.58%) showing a small uptick in UK mortgage fraud.
A breakdown of UK mortgage fraud by category
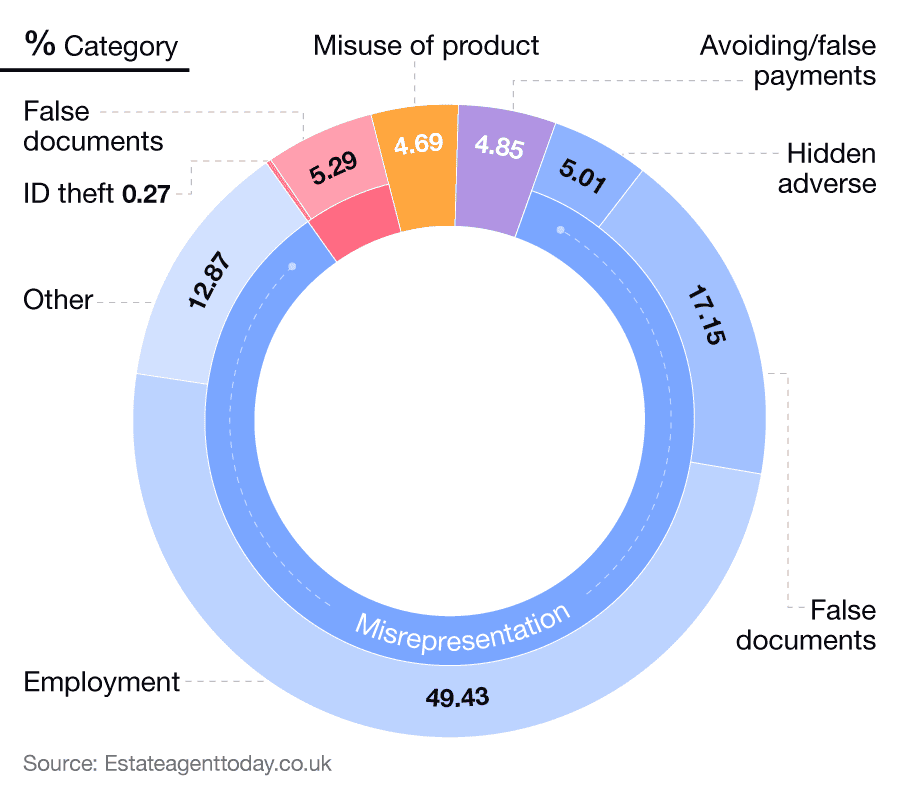
In terms of types of mortgage fraud, the vast majority experienced in the UK is down to misrepresentation of employment. This accounts for almost half of all fraudulent mortgage cases, whereby the applicant may lie or withhold information about who they work for and/or how much money they earn.
Misrepresentation through false documentation is the second most common cause of UK mortgage fraud, accounting for over 17% of all cases, followed by other forms of misrepresentation (almost 13%).
Direct identity theft accounts for less than 0.3% of mortgage fraud and is the least common cause, followed by misuse of a product and avoiding/falsifying payments, both occurring in just under 5% of cases.
Glossary
Mortgage
A mortgage is an agreement a prospective homeowner undertakes with a lending service, such as a bank, to purchase a home. The bank takes your deposit, purchases the property title, and then sets out the details of the repayment plan with the homeowner. In return for purchasing the property on the prospective homeowners behalf, the lender charges a rate of interest to the mortgage.
Mortgage arrears
Mortgage arrears are what happens when a homeowner, bound by their mortgage contract, ceases to continue paying their mortgage. This can either be not paying the mortgage on time, or having too little to pay the monthly instalments.
Loan-to-Value
Put simply, the loan-to-value ratio is the proportion of the property value borrowed, compared to the overall cost of the property. For example, on an average UK home of £300,000, a mortgage applicant may put down £30,000 as a deposit, which is 10% of the overall home value, leaving £270,000 to be paid off by mortgage.Therefore, the LTV ratio for that mortgage deal is 90%.
The higher the LTV ratio, the higher the interest rates lenders offer. If an applicant has just a 5% deposit saved, meaning a 95% LTV mortgage ratio, they are likely to be offered higher interest rate mortgages.
Repossessions
A repossession is where the bank takes back ownership of the home in full, thus evicting the tenant in situ. A repossession is nearly always due to being in mortgage arrears.
Standard Variable Rate
An SVR mortgage, or standard variable rate is the lender's standard rate if no deal term is entered, and typically borrowers fall onto this when a previously taken mortgage deal ends. For example, a homeowner might select a 2-year fixed term mortgage, in which they pay a set interest rate. Once those two years are up, the mortgage moves to a standard variable rate. Usually, a move onto the SVR yields higher interest rates than those on a fixed-term or variable rate mortgage deal. Homeowners can remortgage up to six months prior to the end of their deal in order to avoid their lender’s SVR .
Building society
A building society is similar to a bank, but the management of the group pays interest on investments by members. Therefore, building societies are run and part-owned by the members that use their services, whereas banks are traditionally owned by shareholders, who acquire partial ownership of the bank via the stock market.Like banks, building societies act as mortgage lenders for prospective homeowners, facilitating home purchases and offering mortgages.
Interest rates
Interest rates, in relation to mortgages, are the proportion that is charged as interest by the lender. Banks profit from issuing mortgages charging interest on top of the loan repayments. The rate of interest offered depends on your deal, whether the mortgage is fixed or variable, and your personal circumstances, as well as the Bank of England’s current base rate.
FAQs
How do I get a mortgage?
To apply for a mortgage, prospective homeowners should apply for a mortgage agreement in principle, to get an idea of whether they are able to qualify for the loan that they need. The lenders will look at annual income, employment type, credit history, current outgoings, and provide a preliminary offer - subject to confirmation at full application, once you’ve selected a property. Your loan size is dictated by how much deposit you are able to offer, to form the LTV ratio.
From there, investigate the best lender available to you. This can be down to interest rates offered, repayment terms that suit you, or benefits associated with taking out a specific mortgage from a lender. Be prepared for the mortgage process to take time: while it is possible for a mortgage to be approved in 14 days, most financial checks take considerably longer.
How much mortgage can I get?
The amount of mortgage you can get will depend on a number of factors, such as your income, monthly outgoings, credit score, and how much deposit you’ll be putting down. Generally speaking, the most you can borrow is usually capped at four-and-a-half times your annual income. However, it’s important to try and strike a balance between borrowing enough for your purchase as well as allowing for some flexibility should interest rates change across the duration of your deal.
How long does a mortgage application take?
The average mortgage application typically takes two to six weeks to process. However, this can vary between mortgage lenders and depends on numerous factors, such as your credit rating, income, size of deposit, and employment status, as well as the outcome of a mortgage valuation assessment.
Can I get a mortgage with no deposit?
Although rare, no deposit mortgages do exist. Skipton Building Society launched theirs in April 2023, offering prospective homeowners a 100% mortgage to get on the property ladder. After the financial crisis of 2008, banks are less inclined to offer 100% mortgages, and when they do there’s usually some conditions attached: for example, having a guarantor mortgage or family assisted mortgage.
What credit score do you need for a mortgage?
In order to get a mortgage, you don’t need to have a specific credit score. When applying for a mortgage, your lender will calculate a credit score for you, which helps them determine your eligibility for a mortgage. Each lender has their own parameters and ways of doing this, so it’s worth shopping around if you find yourself unsuccessful with one mortgage provider.
Does having a student loan affect your mortgage?
Yes, although not in the way something like credit card debt would. Student loans do not appear on credit checks, but your loan and repayment scheme will impact on your overall ability to borrow. Banks look through all finances, like monthly outgoings, and judge your ability to repay your mortgage consistently and on time. Student loan repayments reduce your monthly take-home pay, meaning it may be slightly harder for you to pass the bank’s financial stress tests for lending.
Can you have two mortgage applications at the same time?
Yes, you can have two mortgage applications at the same time with as many lenders as you want and there is no penalty for doing so. However, this could have a negative impact on your credit score as it may suggest you’re reckless with money. Therefore, searching for a mortgage using a qualified mortgage broker will allow you to assess the market as a whole and find the product that is right for you.
How long does a mortgage in principle last?
A mortgage in principle will typically last for between 30 and 90 days from the date it is issued by your potential mortgage lender. But this can vary between providers, so it’s worth checking with the lender, to know how long you have to view properties and find the home you desire.
Is it more difficult to get a mortgage now in the UK?
To some extent, yes. Rising mortgage rates throughout 2022-23 have made it more difficult to get a mortgage compared to previous years. Coupled with a cost of living crisis, it means people’s money is having to be stretched further than before. That said, a rise in the number of mortgage approvals in 2024 suggests people are starting to return to the UK property market and buy houses once again.
When will mortgage rates go down?
Mortgage rates are expected to go down in 2024, though this may take longer than previously anticipated. Rates on fixed-rate mortgages increased during May 2024, despite continued months of where they were falling. On 9 May 2024, the BoE announced the base rate would stay at 5.25% for the sixth time in a row. Financial markets are predicting the first cut in interest rates will be in June or August 2024. However, no one can know for sure as it depends on many factors, notably inflation.
How much will my mortgage go up?
How much your mortgage will go up can depend on a number of factors, such as how much you’re borrowing, how long you’ll take to pay it back, and interest rates at the time you take out a mortgage. Using online tools, such as a mortgage affordability calculator, can help judge how much your mortgage could go up by and help with your financial planning.
What is a mortgage arrear?
A mortgage arrear is when you don’t keep up with your monthly mortgage repayments and your lender may apply charges for being behind (known as an arrear). Missed payments are recorded on your credit file, which can impact your credit score and future borrowing. If you don’t keep up with your mortgage payments over time, then you run the risk of your house being repossessed in order to clear any outstanding debt.
What happens when your house is repossessed?
During a repossession, lenders will firstly have the occupants removed from the property. This is known as an eviction. Then, they will formally repossess the home, and seek to re-sell immediately. Sometimes, houses that have been repossessed can be sold through auction, but the majority are sold through traditional means.
Once the property is sold, the lenders will take everything they’re owed from the sale. Then, deduct legal fees and estate agent fees too, before giving the homeowner what’s left over (if anything).
How much does the average house cost in the UK?
Across the UK, the average home cost £290,381 in Q1 2023, about £2,500 less than that of Q4 2022’s prices. For England, but excluding London, the average home cost £288,736, and in Wales, the average home cost just £207,789.
What is the average mortgage for a 40-year-old in the UK?
According to Uswitch customer data, the average mortgage of a 40-year-old in 2023 was £185,933?
What is the average mortgage for a 55-year-old in the UK?
According to Uswitch consumer data, the average mortgage of a 55-year-old in 2023 was £154,016?
Methodology and sources
https://tradingeconomics.com/united-kingdom/mortgage-approvals
https://www.fca.org.uk/data/mortgage-lending-statistics
https://www.bankofengland.co.uk/statistics/mortgage-lenders-and-administrators/2023/2023-q4
https://www.ukfinance.org.uk/data-and-research/data/arrears-and-possessions
https://themoneycharity.org.uk/media/May-2024-Money-Statistics.pdf
https://www.bsa.org.uk/information/consumer-factsheets/general-information/building-society-assets
https://www.ukfinance.org.uk/data-and-research/data/largest-mortgage-lenders
https://www.statista.com/statistics/418973/mortages-products-complaints-to-ombudsman-in-uk/
https://www.cifas.org.uk/newsroom/1-in-6-uk-adults-mortgage
https://www.ftadviser.com/mortgages/2023/09/06/mortgage-related-fraud-grows-by-a-third/
https://www.experian.co.uk/blogs/latest-thinking/fraud-prevention/fraud-statistics/
https://www.moneyhelper.org.uk/en/homes/buying-a-home/mortgage-affordability-calculator
https://hoa.org.uk/advice/guides-for-homeowners/i-am-managing-2/mortgage-rate-forecast/


