- Uswitch.com>
- Mortgages>
- Studies>
- UK Remortgage Statistics 2024
UK remortgage statistics 2024

This page includes relevant UK remortgage statistics for 2024, such as how UK remortgage market figures have changed recently, the number of UK remortgage approvals and gross remortgage advances by purpose of loan. It also covers UK remortgage interest rate statistics and associated costs with remortgaging in 2024.

According to UK remortgage statistics from the ONS, more than 600,000 households face the prospect of interest rate rises when they renew their fixed-rate mortgages in the first half of 2024 alone. As a result of this, more than 30% of those surveyed fear they will struggle to keep up with mortgage repayments.
Deals due to mature throughout 2024 will be from two-year fixed-rate offers made in 2022, and five-year fixed-rate deals made in 2019, at a time when mortgage rates were generally much lower than they are expected to be in 2024.
Our research has collated various UK remortgage facts and stats for 2024, by analysing and comparing remortgaging data over time. This allows us to judge the UK remortgage market size, how it has evolved, and make predictions about the potential future of remortgaging in the UK.
Looking to remortgage?
Book a call with our trusted partner, Mojo Mortgages, to discuss your remortgage options. They'll compare thousands of remortgage deals to recommend the best one for your circumstances.
Overview of UK remortgage market statistics for 2024
ONS figures show that in the first three quarters of 2024, 884,999 UK mortgages will be up for renewal.
More than two in five (43%) UK mortgages due for renewal in Q1 2024 were initially fixed at below 2%, with over half (55%) between 2% to 2.5%.
The BoE’s base rate is currently 5.25%, as of Q1 2024.
Average monthly remortgage payments on a £100,000 mortgage were £520 in January 2024 – a fall from £563 in December 2022.
In Q3 2023, nearly three in 10 (29%) UK mortgages were remortgages.
The UK mortgage market is expected to be worth £216 billion in 2025, of which £58 billion will be dedicated to remortgaging, accounting for just over a quarter (26.9%) of the gross market value.
Those aged 30-39 accounted for the highest percentage (36.9%) of Uswitch customers making remortgaging enquiries.
Number of UK remortgages by initial interest rate
UK remortgage stats show that in Q1 2024, around 316,000 fixed-rate mortgages will be up for renewal. Data from the ONS shows that this figure peaked in Q2 2023, hitting 371,000, before decreasing to around 340,000 by the end of the year.
By Q3 2024, forecasts suggest just over 283,000 UK mortgages will need refixing—around 88,000 less than the height of Q2 2023.
A breakdown of UK remortgages by initial interest rates between 2022 and 2024

Bank of England (BoE) data shows that most mortgages are agreed at a fixed interest rate, with this figure standing at 86% of all UK outstanding mortgages in Q3 2022. This is up from 51% in Q1 2016.
Despite interest rates rising since the beginning of 2022, many fixed-rate borrowers have been shielded from these increases until this year. According to UK mortgage statistics, as of Q1 2024, more than two-fifths (43.9%) of homeowners had fixed-rate mortgages that were under 2%. In addition to this, more than half (55%) had a fixed-rate mortgage that rose between 2 to 2.5%. Only 1% had an initial fixed rate that was above 2.5%.
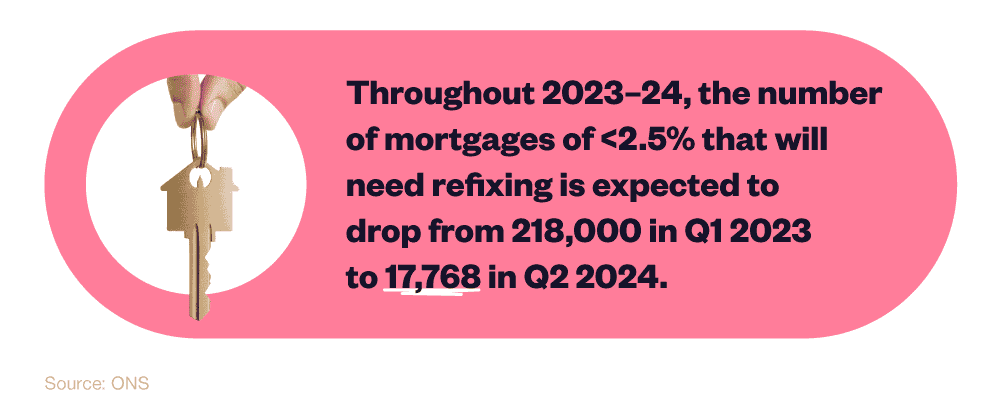
This was a different story in 2023. Throughout the year, the number of fixed-rate mortgages up for renewal at 2% dropped by almost a fifth (19%) from 217,000 to 176,000. The number of mortgages between 2-2.5% that were up for renewal increased from 130,000 in Q1 2023 to approximately 159,000 in Q4 2023. This is expected to hit 174,000 in Q1 2024 – a rise of 33% from Q1 2023.
By Q3 2024, the percentage of UK mortgages on initial rates of <2% will represent just 6% of total mortgages up for renewal, whereas more than half (54%) will be mortgages between 2-2.5%.
The biggest jump is expected in UK mortgages with initial rates of over 2.5%. Prior to 2023, there were no mortgages that fell into this category. In Q1 2023, this rose to just under 5,000, representing around 1% of the total UK remortgages required in that quarter. By Q4 2024, this is forecast to exceed 111,000, and represent over one in three (39%) of all UK mortgages up for renewal.
Compare remortgage rates
If your mortgage deal is ending within six months, now's a good time to speak to a broker. Tell our broker partner, Mojo Mortgages, a bit about you to get your personalised remortgage recommendations.
Distribution of UK outstanding mortgages
According to a remortgaging report by the BoE, over half (52.3%) of outstanding UK mortgages in Q3 2022 were five-year fixed rate mortgages, with virtually a quarter (24.7%) under a two-year fixed deal.
A breakdown showing the distribution of UK outstanding mortgages held by UK Monetary Financial Institutions (MFIs) by type and period of initial interest rate between 2016-2022
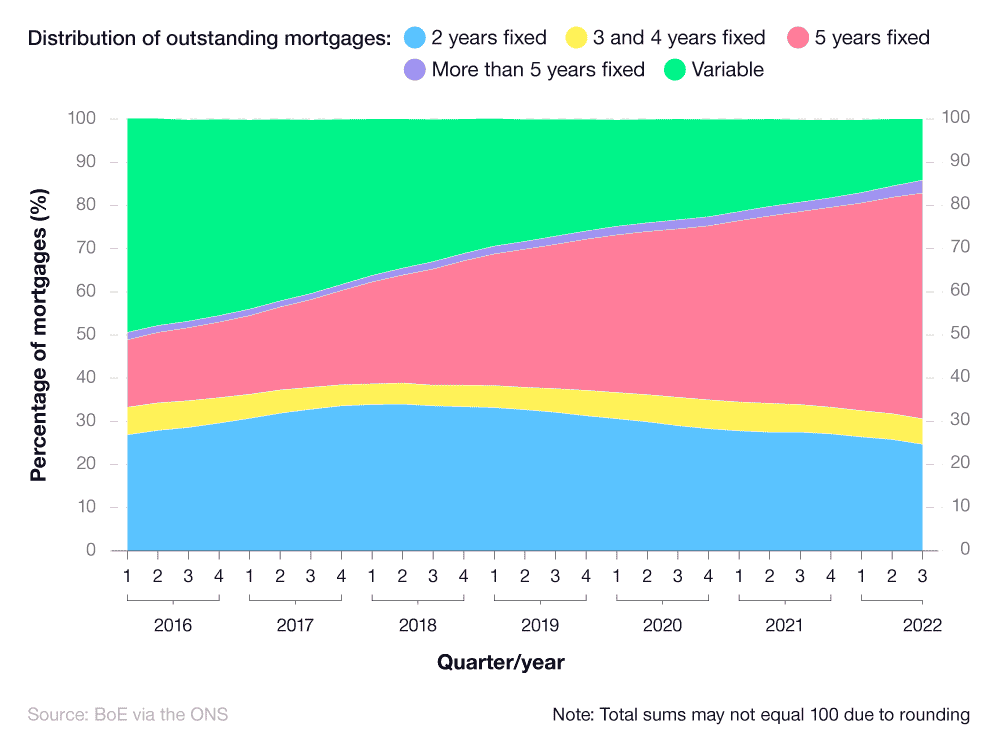
Mortgage statistics reveal that around 14% were subject to a variable rate, with just under 6% on three or four-year fixed packages, and just 3% on those above five years.
Key trends from BoE data show that:
The percentage of two-year fixed rate UK mortgages have steadily declined since Q2 2018, accounting for just over a third (34%) of all mortgages in that quarter.
UK mortgages on a three or four-year fixed rate have fluctuated in recent years, reaching a peak of 6.7% in the period between Q4 2020 and Q2 2021.
The percentage of five-year fixed rate UK mortgages steadily increased from Q1 2016, going from 15.6% to more than half (52%) of all mortgages within the last six years.
UK mortgages exceeding a five-year rate fluctuated, but remained low, from 2016. Prior to 2020, this figure was consistently below 2%, however, since then it has increased gradually to a peak of 3% in Q3 2022.
Variable rate UK mortgages have declined since 2016, when they accounted for almost half (49.6%) of all UK mortgages. A quarter-on-quarter decrease since saw them reach 14%, accounting for approximately one in seven UK mortgages in 2022.
Historically, homeowners with a mortgage have increasingly tied themselves into long-term deals, at a time when mortgage interest rates were attractively low. When borrowers come to remortgage in 2023, this is likely to be at a higher interest rate than when they took out their original mortgage deal.
UK remortgage statistics by property type
In 2023, the average Uswitch customer had a mortgage balance of almost £172,510 across nearly 17,800 quotes. This was compared to £175,188 in 2022. The largest outstanding mortgage balance in 2023 was for properties listed as other (£185,436). However, this only accounted for less than 1% of quotes during this period.
It’s a different story in 2024, with the highest average mortgage balance coming from houses at £178,827. This is around 6% higher than the average balance of homes listed as other (£168,646).
A breakdown of UK remortgage statistics by different types of property
| Property type | % of total quotes | Avg mortgage balance (2023) | Avg mortgage balance (2024) |
|---|---|---|---|
| Flat | 16.84% | £164,780 | £167,483 |
| House | 82.01% | £173,973 | £178,827 |
| Maisonette | 0.89% | £165,850 | £166,312 |
| Other | 0.26% | £185,436 | £168,646 |
(Source: Uswitch)
Houses represented 82% of remortgage quotes in 2024, with around 17% coming from flats. Flats’ average mortgage balance of £167,483 was around 6% lower than houses but nearly 1% higher than maisonettes (£166,312) – the property type with the lowest average balance.
A breakdown of UK remortgage statistics by number of bedrooms
| Number of bedrooms | % of total quotes | Average mortgage balance (2022) | Average mortgage balance (2023) |
|---|---|---|---|
| 1 | 6.35% | £139,600 | £137,423 |
| 2 | 23.08% | £139,144 | £146,034 |
| 3 | 42.00% | £153,556 | £157,485 |
| 4 | 21.98% | £211,308 | £208,968 |
| 5 | 5.49% | £273,311 | £262,958 |
| 6 | 0.99% | £341,85 | £300,637 |
| 7+ | 0.11% | £271,693 | £205,857 |
(Source: Uswitch)
According to property remortgage statistics by number of bedrooms, larger properties tend to have a higher average mortgage balance in 2023.
Based on 2023 quote data, the average Uswitch customer with a 6-bedroom property had an average mortgage balance of just over £300,000 (around £41,000 less than respective customers in 2022).
The most common type of property quote across 2022-23 was for those with three bedrooms, accounting for almost two in five (42%) of quotes during this period. On average, customers with a three-bedroom house had an average mortgage balance of £157,485 in 2023 (about £4,000 more than the respective average for 2022).
On the other hand, one-bedroom properties accounted for 6% of quotes in 2022-23, with the lowest average mortgage balance of all properties (£137,423 in 2023).
A breakdown of UK remortgage statistics by property type and bedroom
| Property type | % of total quotes | Current mortgage balance (total) |
|---|---|---|
| 1-bed flat | 4.85% | £122,976,067 |
| 2-bed flat | 8.09% | £241,532,726 |
| 3-bed flat | 1.31% | £52,392,348 |
| 4-bed flat | 0.14% | £7,271,661 |
| 1-bed house | 1.31% | £28,733,679 |
| 2-bed house | 14.20% | £324,898,194 |
| 3-bed house | 40.23% | £1,096,730,409 |
| 4-bed house | 21.75% | £807,675,657 |
| 5-bed house | 5.45% | £259,350,422 |
| 6-bed house | 0.97% | £54,158,121 |
| 7+ bed house | 0.21% | £13,019,386 |
| 1-bed maisonette | 0.16% | £3,761,703 |
| 2-bed maisonette | 0.63% | £18,260,018 |
| 3-bed maisonette | 0.30% | £10,893,846 |
| Other | 0.41% | £13,413,731 |
(Source: Uswitch)
Based on property type and the number of bedrooms, three-bedroom houses have the largest total mortgage balance in the UK, at just over £1 billion. This also happened to be the most requested quote during this period, accounting for more than 40% of the overall total.
This was followed by four-bedroom and five-bedroom houses, at £807.6 million and £250.4 million, respectively.
The smallest total mortgage balance for UK properties in 2022-23 was for one-bedroom maisonettes (£3.76 million).
UK remortgage statistics by age band
Throughout 2023, close to two in five (36.9%) quotes from Uswitch customers were for people aged between 30 and 39. The next most prevalent were those aged 40-49, which made up close to a third (32.3%) of all quotes. People in the 60-69 age group made up 3.1% of all quotes for the year.
A breakdown of UK remortgage statistics by age group
| Age group | % of total quotes | Average loan amount by age |
|---|---|---|
| 30-39 | 36.94% | £186,667 |
| 40-49 | 32.29% | £185,043 |
| 20-29 | 10.00% | £166,656 |
| 50-59 | 17.30% | £151,737 |
| 60-69 | 3.11% | £148,694 |
| 70-79 | 0.33% | £148,517 |
(Source: Uswitch)
The average remortgage balance was also the highest for those in their thirties, with an average balance of £186,667. This means the remortgage balance for those aged 30-39 was over a fifth (22%) more than the balance for people in their sixties.
Those aged between 70 and 79 had the lowest average remortgage balance of 2023, at £148,517. However, they made up just 0.3% of total quotes for the year.
According to Nuts About Money, young first time buyers may need to remortgage as much as 8 more times during their lifetime (20 times), versus previous generations (12 times), with data showing 42% of all new mortgages taken out being 35-40 year mortgage terms, rather than the typical historical average of 25 years.
UK remortgage cost statistics
Home-buying costs go beyond having the initial deposit and covering the monthly repayments, they also include mortgage fees and tax, plus any associated costs with moving home and/or decorating the property. It should also cover any additional costs you may face in the future when it comes to remortgaging. Today’s UK mortgage rates are liable to change over time, thus impacting your monthly repayment costs.
Arrangement fees average between £1,000 and £2,000, but can vary depending on the value of your property and the size of the loan you wish to borrow. For more information, check out our low-fee mortgage guide to see how you can potentially save money when taking out a mortgage.
In a series of moves, the BoE raised interest rates from 0.25% at the start of 2022 to 4% on 2 February 2023, in a bid to slow down rising inflation nationally. This was then increased to 5.25% in August 2023. Thanks to a marked rise in interest rates in 2023, 2024 may prove to be a challenging year for those looking to apply for a mortgage or remortgage an existing property.
According to the BoE, the average interest rate on a UK two-year fixed rate mortgage in January 2022 was 2.3%, with inflation standing at 5.4%. However, a year later, that same mortgage was affected by interest rates to the tune of 5.75%, with UK inflation rocketing up to 10.7%.
By December 2023, the average interest rate on a two-year fixed rate mortgage dropped to 3.78%, while the overall rate of UK inflation stood at 4.2%.
In December 2023, the effective interest rate on existing UK mortgages with a fixed rate was 2.86%, according to the BoE. This contrasted with an average rate of 6.83% on variable rate mortgages and quoted household interest rates on new fixed rate mortgages of 5.21%.
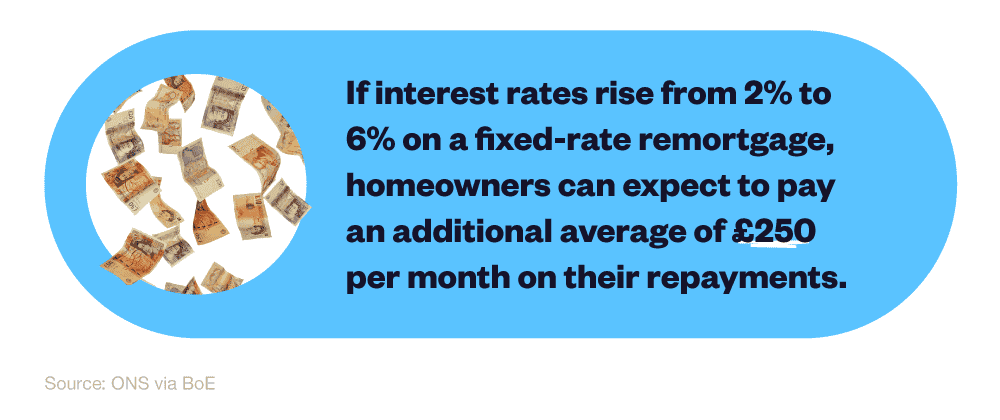
For those looking to remortgage to a fixed rate option, monthly repayments are likely to increase drastically. During a remortgage, if interest rates rise from 2% to 6% on a fixed rate remortgage, homeowners can expect to pay an average of £250 more per month.
A breakdown of monthly mortgage repayment costs for differing amounts of borrowing and different fixed interest rates
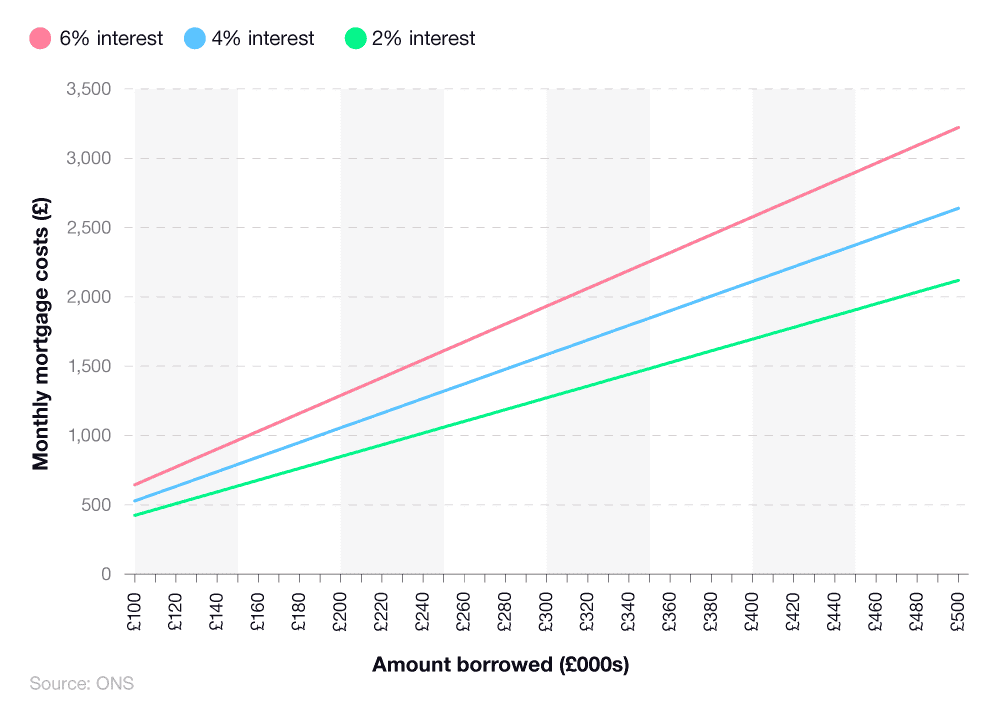
UK remortgage stats from the ONS show that for those who borrowed £100,000 to finance a property purchase, their monthly remortgage payments could rise from £424 to £644 if interest rates rose to 6% (compared to a 2% interest rate when their original mortgage deal was taken out).
With the average property price in the UK standing at nearly £300,000, those who have remortgaged onto a 6% fixed rate loan can expect their payments to go from £1,272 per month to £1,933 per month—an increase of £661 on an existing 2% rate.
The increase in the BoE base rate from 3.5% to 4% on 2 February 2023 meant that those on a tracker mortgage will pay around £49 a month more, compared to an increase of £31 a month for those on a SVR. This is on top of increases following previous rate rises and is likely to have increased further since the base rate’s increase to 5.25% in August 2023.
Compared to December 2021, the average tracker mortgage customer in February 2023 was paying about £382 more per month more, with variable mortgage holders seeing a monthly increase of around £240.
Early repayment charges associated with remortgaging
If a homeowner decides to remortgage before their initial two, five, or 10 year fixed/tracker period is over, then penalties may be applied. Early Repayment Charges (ERCs) are a fee relating to the loss of interest earned by the bank, meaning they don’t lose out on income otherwise received during the fixed/tracker mortgage period.
The size of the ERC payment set by a lender relates to the amount of mortgage the homeowner has left to pay, and how early into the mortgage agreement they decided to leave.
A breakdown of early repayment charges for different stages of a mortgage period and different size mortgages (exclusive data)
| £100,000 | £200,000 | £300,000 | £400,000 | £500,000 | |
|---|---|---|---|---|---|
| Year 1 (5%) | £5,000 | £10,000 | £15,000 | £20,000 | £25,000 |
| Year 2 (4%) | £4,000 | £8,000 | £12,000 | £16,000 | £20,000 |
| Year 3 (3%) | £3,000 | £6,000 | £9,000 | £12,000 | £15,000 |
| Year 4 (2%) | £2,000 | £4,000 | £6,000 | £8,000 | £10,000 |
| Year 5 (1%) | £1,000 | £2,000 | £3,000 | £4,000 | £5,000 |
(Source: Uswitch)
(Note: Early Repayment Charges (ERCs) applied during an early remortgage can differ based on a lender’s terms and conditions. The figures above are a general illustration of ERC charges, and do not represent each lender’s specific fees. For a full breakdown of payments, it is advisable to contact your lender or a mortgage broker.)
UK remortgage stats suggest that if a homeowner (with an average UK home value of £300,000) terminates their mortgage agreement early, they’re likely to owe £15,000 as an Early Repayment Charge if they leave the deal within the first year.
However, if the same homeowner waits until the fifth year of their fixed mortgage term, then the repayment is expected to be considerably less. In this instance, around £3,000.
It’s important to know that not all lenders share the same ERC policies, and that seeking financial advice before exiting a mortgage prematurely is the best thing to do. If the homeowner decides instead to remortgage at the end of their fixed term, they will not be liable for any Early Repayment Charges.
Additional UK remortgage cost statistics by loan amount (exclusive data)
The average UK mortgage length is 25-30 years, although some can be shorter.
With average mortgage interest rates falling from 5.43% in December 2022 to 4.73% in January 2024, Uswitch analysis reveals the financial impact of rising rates on UK homeowners. This was achieved using monthly mortgage data between 2022-24, across different loan amounts.
A breakdown of UK monthly price increases in mortgage payments between December 2022-24 for different loan amounts
| Loan amount (£) | Term (yrs) | Monthly payment on Dec 2022 rate (5.43%) (£) | Monthly payment on Jan 2024 rate (4.73%) (£) | Monthly price decrease(£) |
|---|---|---|---|---|
| 100,000 | 30 | 563 | 520 | 43 |
| 200,000 | 30 | 1,127 | 1,041 | 86 |
| 300,000 | 30 | 1,690 | 1,561 | 129 |
| 500,000 | 30 | 2,817 | 2,602 | 215 |
| 1,000,000 | 30 | 5,634 | 5,204 | 430 |
(Source: Uswitch via Google Mortgage Calculator)
*Note: All data is based on mortgage figures for a two-year 75% LTV fixed-rate mortgage)
At the height of the pandemic in December 2020, the monthly repayment rate on a £100,000 loan stood at just £363. However, exactly two years later, the monthly repayment figure rose to £563—a leap of £200 per month on mortgage repayments. However, the recent drop in mortgage rates resulted in this repayment figure falling to £520 in January 2024 – a fall of £43 (-7.6%) from December 2022.
With the average UK house price being £285,000, an average mortgage for £300,000 (not including deposit) would see monthly payments rise from £1,088 in December 2020 to £1,690 in December 2022 – an increase of more than £600. The fall in interest rates in 2023 means that the average monthly payments for January 2024 are £1,561 – down £129 from 13 months earlier.
For those with a million-pound mortgage, monthly repayments of £3,627 in December 2020 rose enormously to £5,634 per month—an increase of over £2,000. Since then, monthly repayments have fallen by over £400, reaching an average of £5,204 in January 2024.
BoE forecasts suggest the base rate will remain at 5.25% until the second half of 2024, with reductions expected later in the year.
UK remortgage cost statistics by nation 2023 (exclusive data)
UK remortgage cost statistics indicate a clear disparity in average house prices between the UK's four nations. With average monthly mortgage rates increasing from 1.86% to 5.43% between December 2020-22, and then falling to 4.73% in January 2024, all nations have experienced fluctuations in their mortgage repayment costs.
England has the highest average house price across the four UK regions at £302,164, as of December 2023. In December 2020, typical monthly repayments on a house of this cost were £1,096. However, that rose by more than £600 in December 2022 (£1,702).
Since then, falling interest rates mean that average monthly payments fell to £1,573 in January 2024 – a decrease of £129 since December 2022.
A breakdown of UK monthly price increases in mortgage payments between December 2022 and January 2024 across UK nations
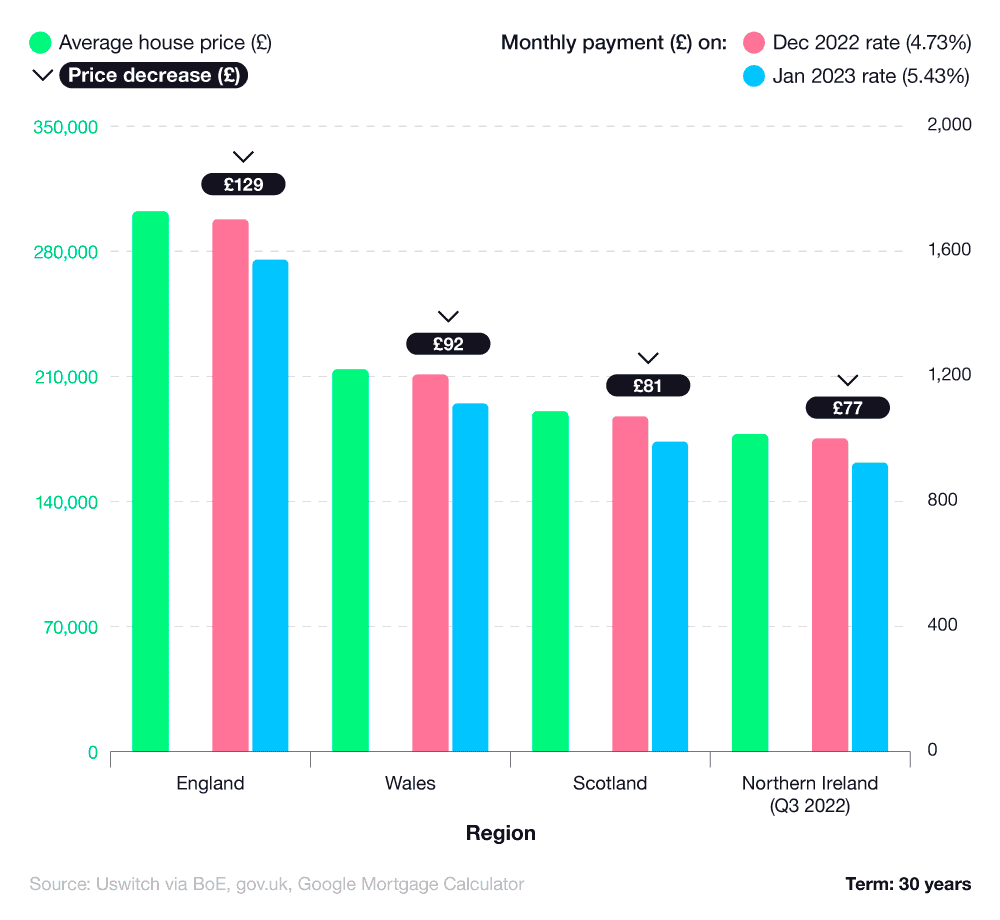
| Country and government office region | Average house price (£) | Term (yrs) | Monthly payment on Dec 2022 rate (5.43%) (£) | Monthly payment on Jan 2024 rate (4.73%) (£) | Price increase (£) |
|---|---|---|---|---|---|
| England | 302,164.00 | 30 | 1,702 | 1,573 | 129 |
| Wales | 213,816.00 | 30 | 1,205 | 1,113 | 92 |
| Scotland | 190,341.00 | 30 | 1,072 | 991 | 81 |
| Northern Ireland (Q3 2022) | 177,611.00 | 30 | 1,001 | 924 | 77 |
(Source: Uswitch via BoE, gov.uk, Google Mortgage Calculator)
Conversely, Northern Ireland mortgage holders received the lowest reductions in monthly repayments between 2022 and 2024. In Q4 2023, the average home in Northern Ireland cost £177,611. Monthly mortgage payments in December 2022 were £1,001, decreasing to £924 in January 2024. This represents a decrease of £77 per month, the lowest figure of the UK’s four regions.
Scotland’s decrease was slightly higher than Northern Ireland’s, falling £81 from £1,078 per month to £991. Wales endured the second-highest decrease between December 2022 and January 2024, with typical average monthly payments falling by £92 to £1,113.
UK remortgage cost statistics by region 2023 (exclusive data)
UK remortgage statistics show that the region with the highest average mortgage balance is Greater London. With an average balance of £265,937, Greater London’s total was a quarter (25%) higher than any other region.
The English capital is one of just three UK regions where the average mortgage balance is greater than £200,000 – the other two being the South East (£212,048) and East of England (£202,719).
A breakdown of average mortgage balance statistics by UK region

The average mortgage balance in Greater London is 91% higher than the equivalent in the East Midlands (£136,832), and more than double the average mortgage balance in Northern Ireland (£125,043).
Greater London also had the highest percentage of total quotes from Uswitch customers in 2023 at almost a fifth (17.5%). The South East, West Midlands, and North West were the only other regions which accounted for more than 10% of total quotes for 2023.
The region with the smallest percentage of quotes for the year was Northern Ireland (just under 1%).
A regional breakdown of the average monthly mortgage repayment rises across the UK between 2022 and 2024

| Country and government office region | Price (£) | Term (yrs) | Monthly payment on Dec 2022 rate (5.43%) (£) | Monthly payment on Jan 2024 rate (4.73%) (£) | Price decrease (£) |
|---|---|---|---|---|---|
| London | 508,037 | 30 | 2,862 | 2,644 | 218 |
| South East | 377,162 | 30 | 2,125 | 1,963 | 162 |
| East of England | 342,489 | 30 | 1,930 | 1,782 | 148 |
| South West | 318,996 | 30 | 1,797 | 1,660 | 137 |
| West Midlands Region | 342,489 | 30 | 1,423 | 1,314 | 109 |
| East Midlands | 248,390 | 30 | 1,399 | 1,293 | 106 |
| North West | 218,353 | 30 | 1,230 | 1,136 | 94 |
| Yorkshire and The Humber | 207,501 | 30 | 1,169 | 1,080 | 89 |
| North East | 157,557 | 30 | 888 | 820 | 68 |
Homeowners living in London had the largest monthly mortgage payment decreases between December 2022 and January 2024. With the average home in London valued at £508,037 in December 2023, repayments on the average mortgage for December 2022 stood at £2,862 per month. However, in January 2024, interest rates fell, taking monthly mortgage repayments down to an average of £2,644.
In the West and East Midlands, monthly repayment decreases are comparable, with the neighbouring regions having similar house prices (£252,532 and £248,390, respectively). Falls in interest rates meant homeowners living in those two regions typically paid over £100 less per month in January 2024 compared to December 2022.
Those living in the North East accrued the smallest monthly mortgage payment decrease between 2022-24, thanks primarily to the low average house price of £157,557. In December 2022, monthly mortgage payments were £888, decreasing to £820 in January 2024. This represented an overall fall of £68 per month, on average.
The only other regions with monthly payment decreases below £100 were Yorkshire and the Humber and the North West, with average reductions of £89 and £94, respectively.
Additional UK remortgage costs by property type (exclusive data)
Based on UK mortgage figures for a two-year 75% LTV fixed rate mortgage, UK remortgage statistics were calculated by Uswitch to judge the relative increase in mortgage payments for different UK property types between December 2022 and January 2024.
A breakdown of monthly price increases in UK mortgage payments by property type (2022-2024)
| Property type | Average price (£) | Term (yrs) | Monthly payment on Dec 2022 rate (5.43%) (£) | Monthly payment on Jan 2024 rate (4.73%) (£) | Price decrease (£) increase (£) |
|---|---|---|---|---|---|
| Detached | 447,076 | 30 | 2,519 | 2,327 | 192 |
| Semi-detached | 280,024 | 30 | 1,578 | 1,457 | 123 |
| Terraced | 232,113 | 30 | 1,308 | 1,208 | 100 |
| Flats and maisonettes | 224,757 | 30 | 1,266 | 1,170 | 96 |
(Source: Uswitch via BoE and gov.uk, and Google Mortgage Calculator)
UK detached homes typically yield the highest average asking price (£447,076), which also represent the largest increase in monthly mortgage payments. In December 2022, average mortgage payments for a detached property were £2,519, whereas in January 2024 this fell to £2,327 per month. A decrease of 0.7% in the average interest rate resulted in an average monthly payment decrease of £192.
Semi-detached homes had the next biggest payment decrease, falling from £1,578 in December 2022 to just over £1,450 in January 2024 – a fall of £123 per month.
The average price disparity between UK terraced homes and flats is only £7,356 (£232,113 and £224,757, respectively), meaning the two property types share a similar monthly price decrease. For terraced homes, the average monthly payment in December 2022 was £1,308, falling by exactly £100 on average in January 2024 (£1,208).
For UK flats and maisonettes, the average monthly payment was £1,266 in December 2022, decreasing to £1,170 thirteen months later – a price drop of around £96 per month.
Number of UK monthly remortgage approvals over time
Monthly remortgage approval rates have fallen substantially since October 2022 when they stood at 50,845. By January 2023, this figure had dropped to 25,789 before falling as low as 20,493 in September. The latest figure of 30,833 for December 2023 marks the third consecutive month that remortgage approval rates increased.
Incidentally, as a percentage, more than two in five (42%) mortgages approved in October 2022 were for remortgaging purposes—the highest percentage figure across 2021-23. By December 2023, this had fallen to just over a third (35%).
According to the BoE’s remortgaging report for 2022, remortgages accounted for less than 30% of all UK mortgages approved between January and July 2021, dropping to as low as 23% at the beginning of the year. Between August 2021 and August 2023, remortgages accounted for almost a third (31%) of total UK mortgages for any given month, often standing above 35%. After falling below 30% in September 2023, the total increased beyond 30% again in the final months of that year.
A breakdown of UK monthly mortgage approvals by purpose between 2021 and 2023, according to the BoE
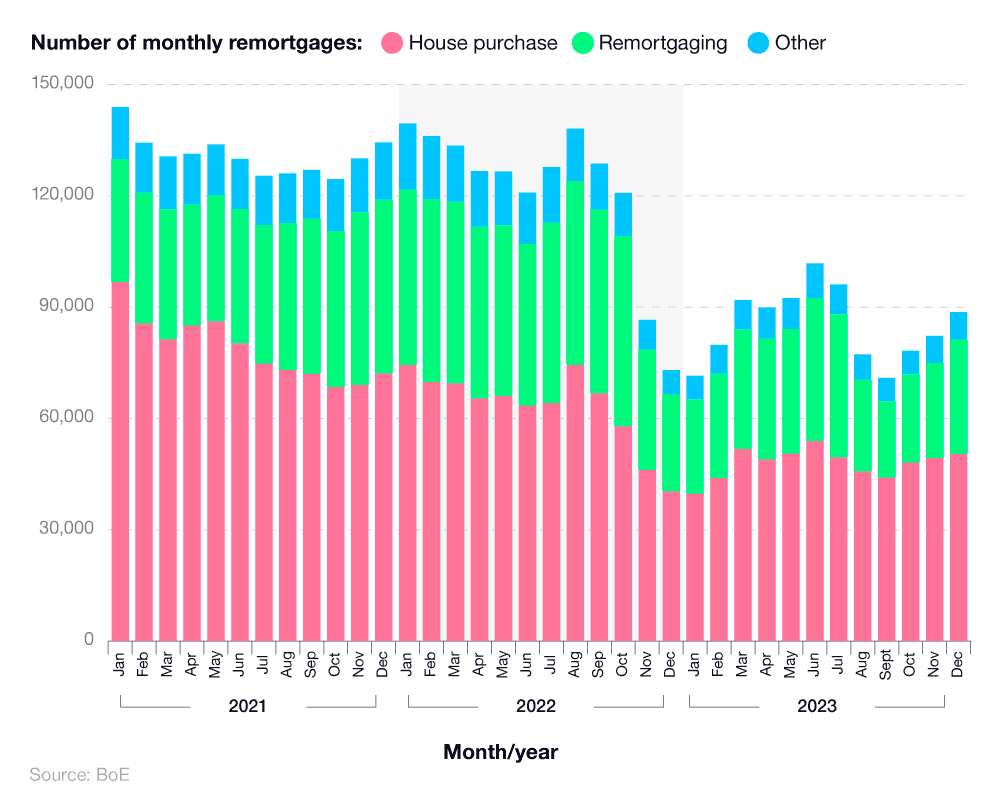
According to BoE remortgaging statistics, there were just over 33,500 remortgages approved in May 2023. This represented just over a third (36%) of total mortgages approved for the month, with over half (55%) attributed to those buying a house.
By November 2023, this figure declined to 25,659, representing around a quarter (-23%) less remortgage approvals compared to May. However, remortgage approvals rose by a fifth (20%) in December 2023, taking the approval rate past 30,000 for the first time since July.
This means that for December 2023, more than a third (35%) of all mortgages that were approved were remortgages.
By comparison, the number of UK mortgages approved each month has generally decreased over time, fluctuating between roughly 144,000 in January 2021 and 92,434 in May 2023.
This trend continued throughout the year. By August 2023, UK mortgage approvals were down as low as 77,110. By September 2023, mortgage approvals dropped by a further 7% to 70,991. From there, figures started to increase, with both the number of house purchases and remortgages going up.
Between September and October 2023, the total number of mortgage approvals increased by a tenth (10%), rising to 78,220. A further 7% increase followed, going up to 84,354 in November 2023 and then to 88,689 in December (+5%).
UK mortgage approval statistics by region
According to remortgage statistics from the FCA, more than 90,000 remortgages were issued to UK homeowners in Q4 2022 alone. The vast majority were located in London (13,644) and the South West (12,522), which represented 15% and 13.8% of total UK remortgages for the year, respectively.
This was followed by the South East and North West as the highest UK regions for remortgaging in Q4 2022, with 10,757 and 10,548 approved remortgages, respectively.
A breakdown of remortgage approval statistics for different regions of the UK

Monthly value of UK remortgages
Northern Ireland proved to be the UK region with the least number of remortgages in Q4 2022. Sitting at just 1,608 for the quarter, this represented less than 2% of the UK total, and around 13 times less compared to London-based remortgages, at the end of 2022.
Incidentally, Wales (3,713) and Scotland (5,347) were the next lowest UK regions for remortgages in 2022. Combined, this meant almost 88% of UK remortgages in Q4 2022 were for properties located in England.
UK remortgage approval statistics by annual value
Based on recent UK mortgage statistics, the average cost to UK lenders for mortgages has gradually increased year on year, starting at £138 billion in 2011 and rising to a peak of £322 billion pounds as of 2022.
A breakdown of the total UK remortgages by year (excluding Buy-to-Let remortgages) and their overall contribution to gross mortgage lending

According to UK Finance, the number of loans issued for remortgaging has also risen. In 2014, the gross lending of all homeowner remortgages (excluding buy-to-let remortgages) stood at £45 billion —a mere £5 billion more than in 2011. This indicates demand stability within the market.
However, as a percentage breakdown, in 2011 almost a third (32.6%) of loans approved by lenders were designated for remortgaging purposes. Aside from 2018 at 30.5%, UK Finance’s remortgage report indicates that 2011-22 all saw figures well below the highs of 32.6%, showing a shift in preference for first-time buyers as opposed to those looking to remortgage their property.
According to recent first-time buyer statistics, there were 874,000 recent first-time buyers in England in 2022-23.
In 2021, during the height of the Covid-19 pandemic, UK remortgage stats show a record low 21% of approved loans were for remortgaged properties. In that year, the UK’s gross mortgage market value stood at £310 billion, whereas the remortgage figure was only at £65 billion—the largest disparity between the two figures since records began.
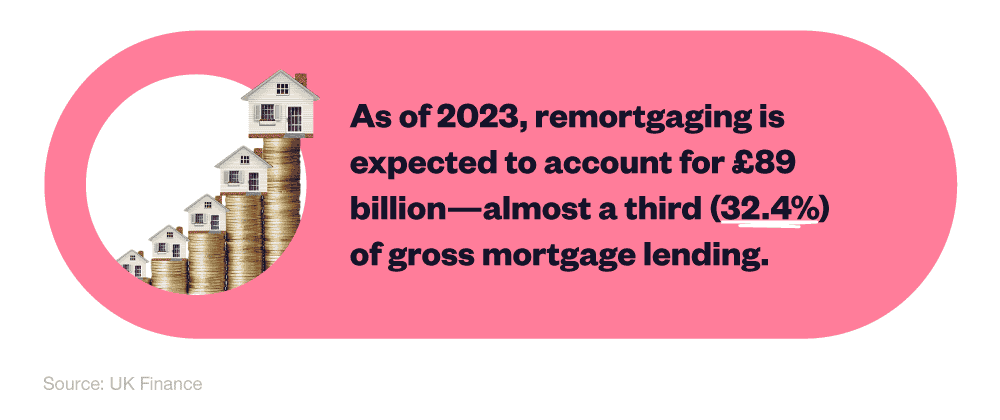
Prospective forecasting indicates a spike in the percentage of gross mortgage lending attributable to remortgaging. The 2023 mortgage market value is expected to be worth £236 billion, of which £65 billion will be dedicated to remortgaging—just under 29% of the gross mortgage market value for 2023.
Similar figures are forecasted for 2024 (27.9%), with the two-year period indicating an overall reduction in demand for first-time buyers. By 2025, gross mortgage lending is forecast to stand at £216 billion, with standard homeowner remortgages accounting for £58 billion (26.9%) of that total.
UK remortgage lending statistics
UK remortgage lending statistics reveal that gross figures for remortgaging to individuals fluctuated over the past three years. As of November 2022, this total stood at £8.3 billion, having reached a peak of £10.5 billion just a month earlier.
Figures like this had not been experienced in the UK remortgage lending market since January 2020, when secured gross lending for remortgaging reached almost £9.6 billion.
A breakdown of total secured gross lending for UK remortgaging to individuals between 2021 and 2023
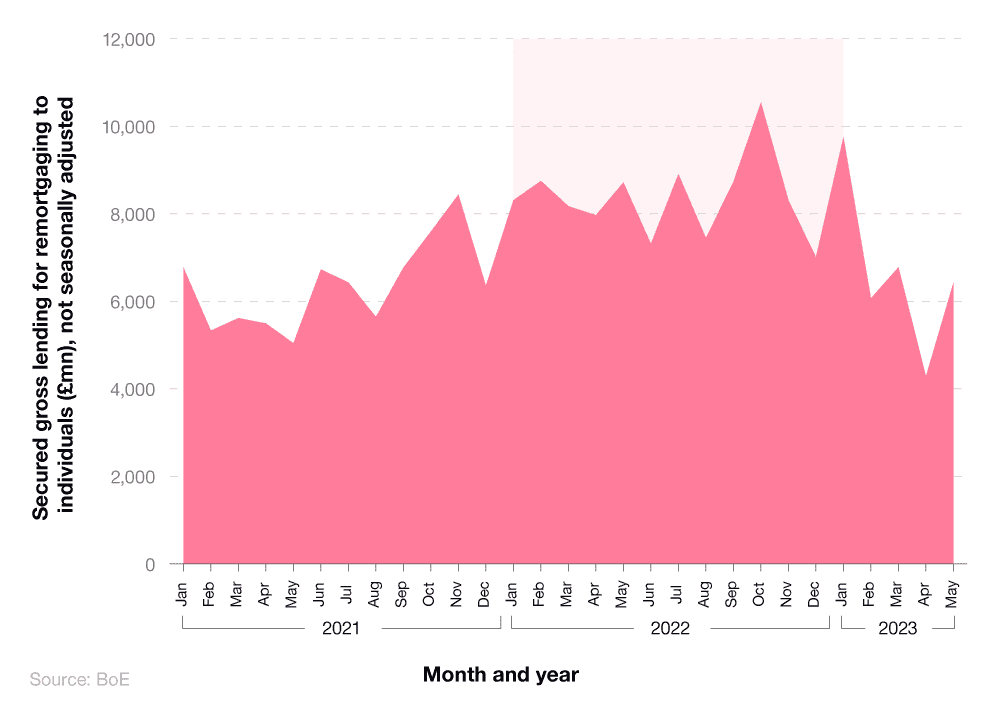
Throughout the first half of 2021, gross lending for UK remortgaging dropped to below £6 billion per month. In October 2021, the monthly total exceeded £7 billion for the first time since February 2020.
This remortgage report from the BoE highlights that secured gross lending for remortgaging to individuals in 2022 stayed somewhere between £7-9 billion, on a general upwards trajectory.
This gradual increase peaked in January 2023, when the total gross lending for remortgages exceeded £9 billion for the first time in recent history, before decreasing by more than half to £4.2 billion in April 2023.
Throughout 2022-23, the value of monthly remortgages in the UK has seen some significant fluctuations. During much of 2022, this figure stood somewhere between £9-£10 billion, until a drop to around £6.5 billion in November 2022.
Monthly value of UK remortgages
The value of monthly UK remortgages in 2023 has remained low, but relatively stable compared to 2022. January 2023 saw the lowest recorded figure in recent years, at just over £5 billion for the month. Since then, it has slowly started to increase, exceeding £7 billion in May 2023.
A breakdown of UK remortgage statistics showing the monthly value of UK remortgages between 2022-23
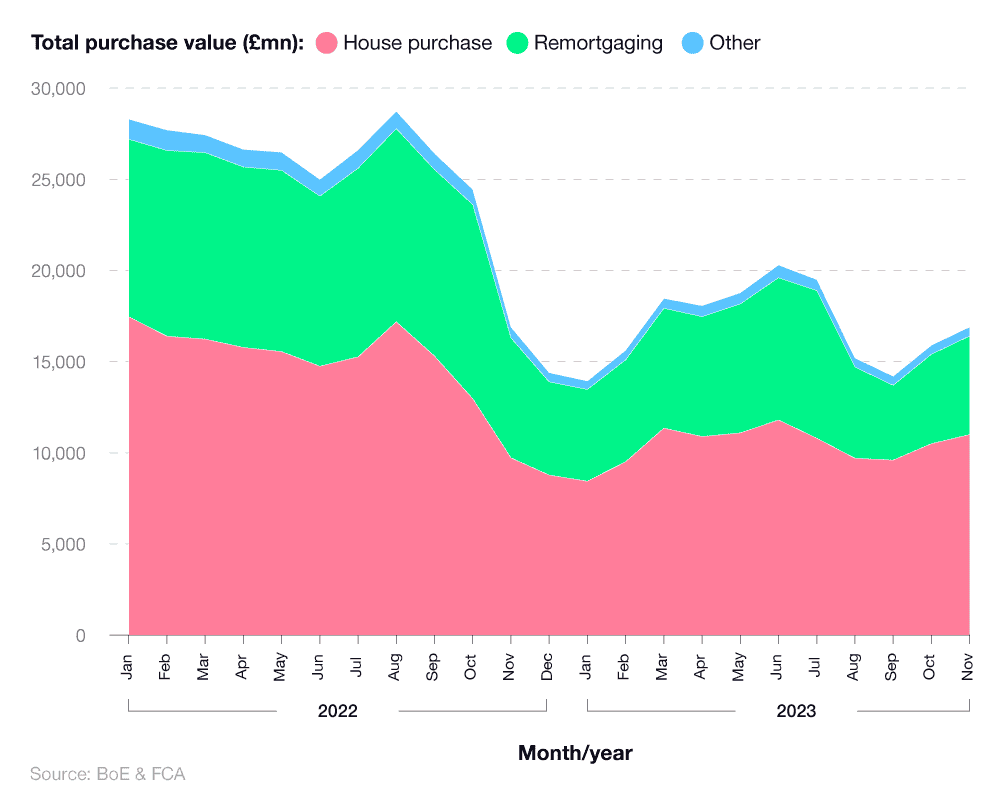
By comparison, UK house purchases followed a similar pattern over 2022-23. However, proportionally each month, these now account for a greater percentage of total lending compared to remortgaging.
In May 2023, the value of house purchase mortgages exceeded £11 billion, accounting for 60% of the total monthly value. By contrast, remortgaging was responsible for almost 38%, with the remaining 2% down to other purchases.
The value of UK remortgages has continued to fluctuate since, reaching a peak of £5 billion in August 2023 before dropping by almost a fifth (-18%) to £4.1 billion in September. The UK remortgage value hit £4.9 billion in October 2023, before rising by over a tenth (+10.2%) to £5.4 billion the following month.
For August 2023, remortgages made up a third (33.3%) of the total value of all UK mortgages. By September 2023, this had decreased to 29.3%. In November 2023, the percentage returned close to its August 2023 peak, with remortgages making up 31.7% of the total value of all UK mortgages.
Gross mortgage advance statistics by purpose of loan
In terms of total market value, mortgage lending was valued at £85.9 billion in Q3 2022, with only Q2 2021 showing a higher overall value (£89.1 billion).
UK remortgage figures indicate mortgage lending in Q3 2022 was valued at £85.9 billion—£8 billion more than Q2 2022 and £12.5 billion less than Q3 2021—showing a marked uptick in mortgage values across the UK.
By the end of 2022, this value had dropped to £81.6 billion, before falling even further in the first quarter of 2023 to £58.8 billion.
A breakdown of gross mortgage advances for remortgaging compared to other loan purposes between 2020 and 2023
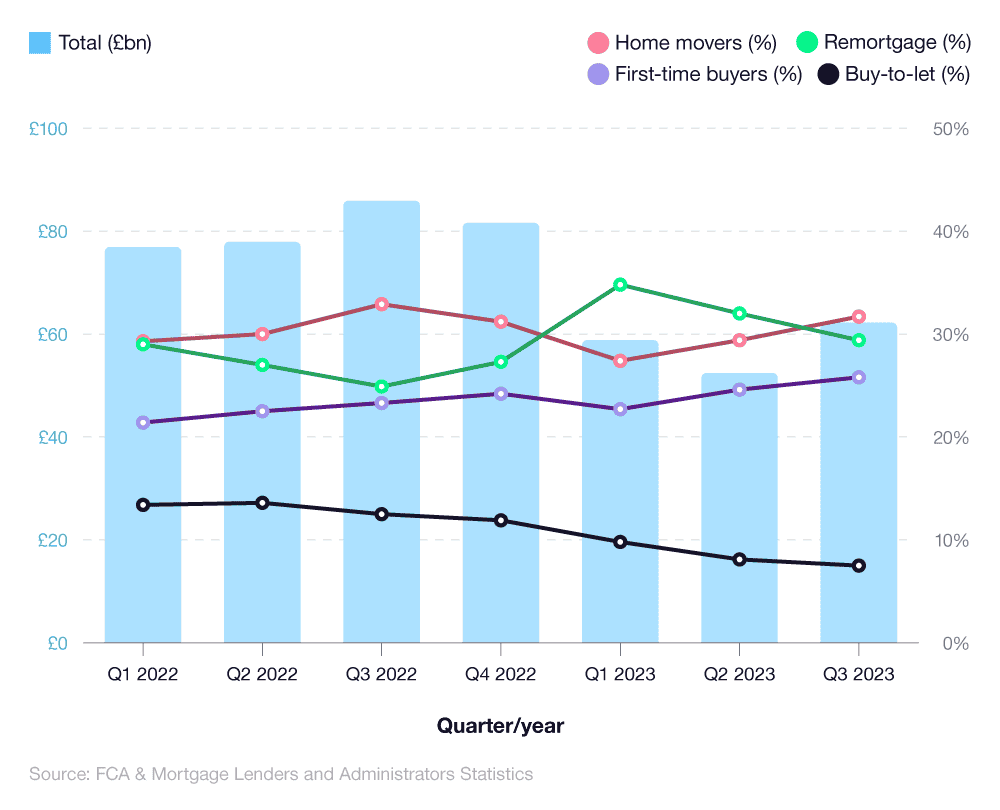
In Q3 2022, almost a quarter (24.9%) of all mortgages in the UK were for remortgaging purposes, with less than a quarter (23.3%) of loans dedicated to first-time buyers. Just 12.5% of the mortgages issued in this period were for buy-to-let properties—a 1.1% decrease from Q2 2022 and a 0.6% decrease from the same period the year before.
Respective figures for Q1 2023 were:
Almost 35% for remortgages.
More than a quarter (27.4%) for home movers.
More than a fifth (22.7%) for first-time buyers.
Less than 10% for buy-to-let purchases.
Just under a third (32.9%) of all mortgages in Q3 2022 were dedicated to people opting for a moving home mortgage. Each period between Q4 2020 to Q3 2021 inclusive showed a considerably higher rate of home movers, with an average of 39.5% (6.6% more than in Q3 2022). This can be attributed to the challenging, financial circumstances in the mortgage market caused by rising inflation and interest rates.
In Q2 2023, the total came to £52.4 billion, around a tenth (-10.8%) less than it was in the quarter before. Close to a third (32%) of this figure was made up of lending for remortgages.
This percentage dropped by three percentage points to 29% in Q3 2023, yet at the same time, the total gross lending went up by close to a fifth (18%) to £62.2 billion.
According to the FCA’s remortgage report, interest in buy-to-let properties peaked in Q2 2022, taking a 13.6% share in the overall mortgage market. This was a 2.2% increase from the same period one year earlier. However, Q3 2022 showed buy-to-let mortgages fell to 12.5% of gross mortgage advances—a 1.1% decrease in the space of a quarter.
Looking to move home? If so, porting your mortgage (as opposed to remortgaging) could be an alternative option to consider.
UK housing loans statistics by loan type between 2016 and 2023
According to a remortgage report by UK Finance, approximately £66 billion of UK housing loans were attributed to homeowners remortgaging in 2020. This accounted for more than a quarter (28%) of UK housing loans for that year.
A breakdown of the value of remortgage loans compared to other loan types between 2016 and 2023
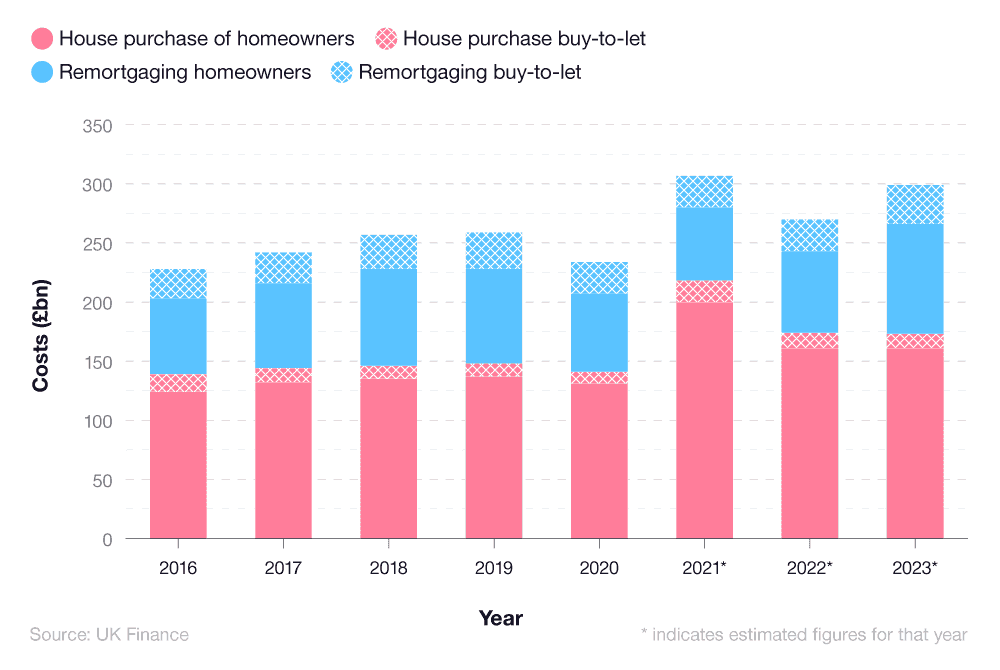
UK remortgage figures suggest this could rise to £69 billion in 2022, and £93 billion in 2023, at which point it could account for almost a third (31%) of UK housing loans for the year.
Incidentally, the value of buy-to-let remortgages in 2020 stood at £27 billion (almost 12% of all UK housing loans), and remained constant in 2022. In 2023, it’s forecast that buy-to-let remortgages will be worth an extra £6 billion compared to 2022, yet only 11% of total UK housing loans for the year.
UK buy-to-let remortgage statistics
According to UK buy-to-let statistics, £8.5 billion worth of properties were bought by UK landlords in 2022. This represented nearly 14% of the UK mortgage market for the year and equated to more than 211,000 properties.
There are many advantages of buy-to-let mortgages, including:
Lower monthly repayments – Most buy-to-let mortgages are interest-only mortgages, allowing for a better monthly rental income.
Growth in property value - Historically, UK properties have a habit of increasing in value, rather than decreasing. This is of benefit should you want to pay your mortgage off early and/or sell the property at a later stage.
Source of income - Buy-to-let properties are a good opportunity to generate some additional monthly earnings and supplement any other income streams you may have.
An opportunity to build a portfolio of properties – The average UK landlord owns eight properties, generating an average gross annual rental income of around £61,000 per property.
Whether it is a consumer buy-to-let mortgage or a traditional one, most lenders will offer a maximum of 75% loan-to-value (LTV), meaning you can borrow 75% of the property’s current cost.
Looking for ways to add value to your home? Check out our guide on the steps you can take to help ensure your property achieves its maximum potential value.
A breakdown of UK buy-to-let remortgage statistics compared to purchases in 2022
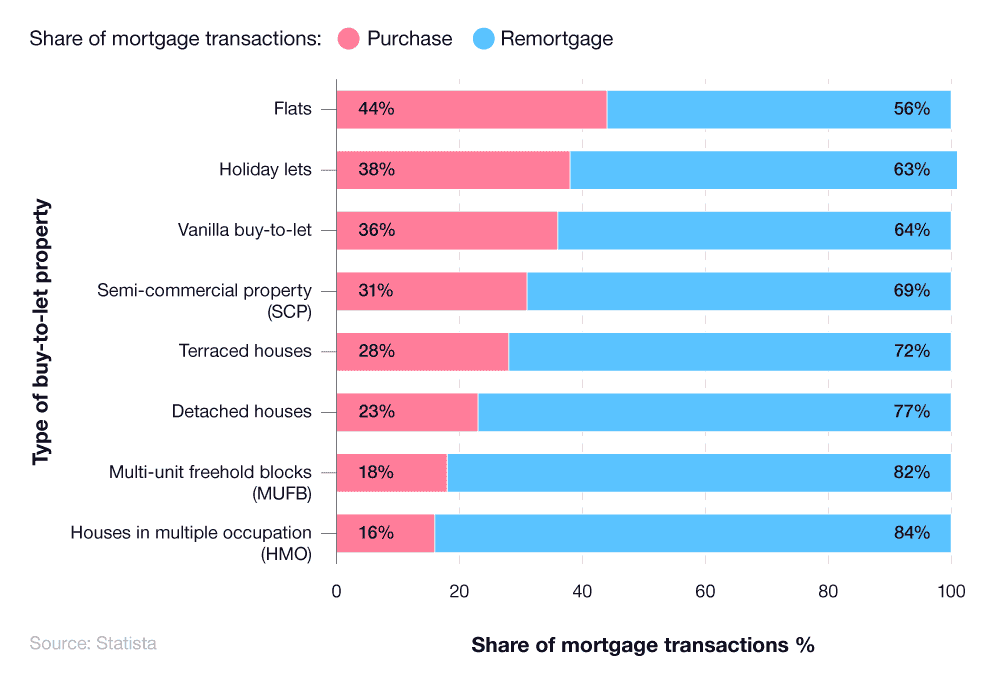
UK remortgage figures show, in Q2 2022, 84% of mortgage transactions for HMO purchases were for remortgages, representing the highest share of all property types in this study. Conversely, just 16% of buy-to-let loans represented HMO purchases. Similarly, multi-unit freehold blocks (MUFB) have a high remortgage rate of 82%, with a purchase rate of only 18%.
The buy-to-let remortgage of flats in Q2 2022 represents the smallest comparative difference between all UK property types, with 44% of flats purchased and 56% of flats remortgaged. However, the overall trend moves towards remortgaging, with holiday let mortgages showing a 63% remortgage rate as opposed to a 38% purchase rate, similarly with vanilla buy-to-lets (36% and 64%, respectively).
UK remortgaging during a cost of living crisis
According to remortgage statistics, 1.6 million of UK homeowners will be coming to the end of their fixed rate mortgage period in 2024.
Rising interest rates means remortgaging was more expensive than ever for households in 2023, with the first month of 2024 seeing a reduction in these rates.
Mortgage expenditure as a percentage of total household expenditure
Data from the ONS reveals that homeowners in the lowest 10% of earners across the UK will be hit hardest by mortgage interest rate rises.
A survey taken in Q4 2021 highlights how the lowest-income decile already spends 24% of their gross household income on mortgage payments, a figure that is likely to have increased in 2023 due to the rise in interest rates.
A breakdown of UK mortgage payments as a percentage of total household expenditure across different income groups
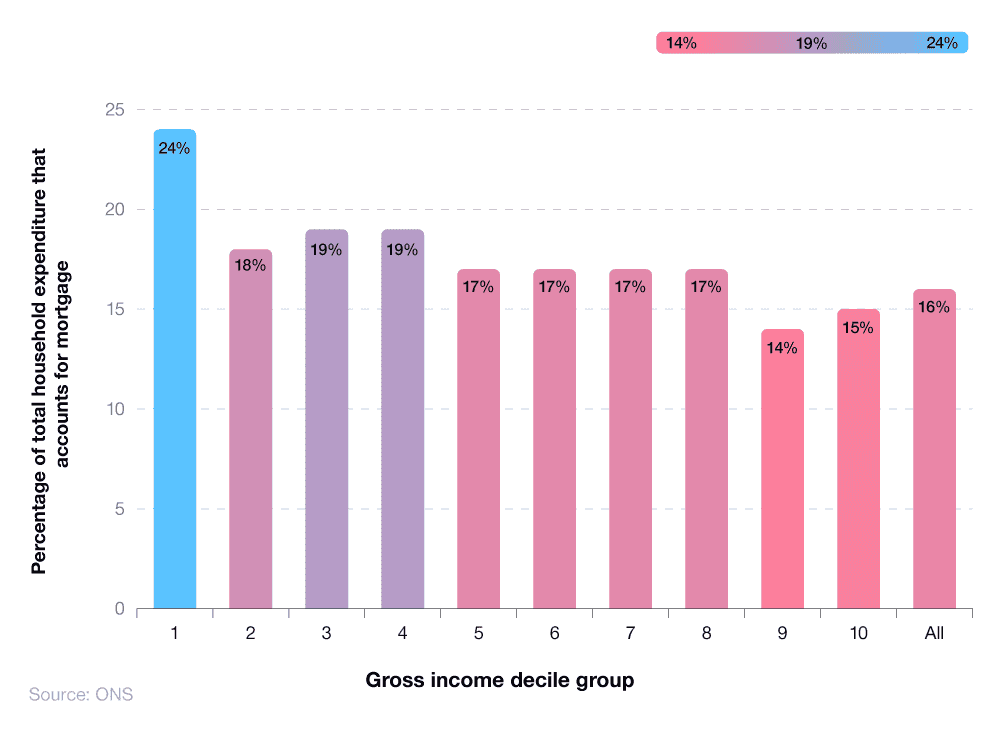
As household income increases, the percentage of total expenditure on mortgages generally drops, from 24% for the lowest income decile to 15% for the UK’s highest earners.
The overall average net spend per household on mortgage repayments is 16%, a full 8% less than those that earn the least. This demonstrates how the increased interest rates during 2023’s cost of living crisis will disproportionately affect homeowners with the lowest income, particularly those looking to remortgage.
UK public opinions about remortgaging
A 2023 ONS survey revealed that, whilst inflation and interest rates remain high, less than one in three (29%) adults currently paying rent or a mortgage reported an increase in their payments between 21 December 2022 and 8 January 2023.
In addition, almost one in three (29%) of people paying rent or a mortgage admitted they’re finding it very or somewhat difficult to keep up with these payments. While that figure is high, the beginning of December 2022 generated the same results (29%), meaning that figure is currently stable.
Unfortunately, 2% of the respondents indicated they were behind on making rent or mortgage payments. The upside to this statistic is that, for the period before this survey, 4% were reporting the same struggles, indicating a 50% overall reduction in people struggling to make rent or mortgage payments. This is supported by data from the English Housing Survey, which showed that mortgage arrears across England have remained at or below 2% in the last 10 years.
Finally, in the period of 7-18 December 2022, less than half (45%) of UK adults with mortgages stated they were somewhat or very worried about the changes in mortgage interest rates during 2023.
Struggling with your mortgage repayments? Due to remortgage this year and think you might not be able to financially cope? There are a range of Government support measures and advice available for mortgage holders, in order to help ease the burden.
UK remortgage statistics sources & methodology
Sources and methodology
https://obr.uk/efo/economic-and-fiscal-outlook-march-2023/
https://www.theguardian.com/money/2023/feb/02/interest-rate-rise-tracker-mortgages-bank-of-england
https://www.bankofengland.co.uk/statistics/visual-summaries/effective-interest-rates
https://www.bankofengland.co.uk/boeapps/database/Bank-Rate.asp
https://www.bankofengland.co.uk/financial-stability-report/2022/december-2022
https://www.bankofengland.co.uk/statistics/visual-summaries/quoted-household-interest-rates
https://www.bbc.co.uk/news/business-63474582
https://www.fca.org.uk/data/product-sales-data/mortgages-dashboards
https://www.fca.org.uk/data/commentary-mortgage-lending-statistics-q1-2023)
https://www.forbes.com/uk/advisor/mortgages/2024/02/05/mortgage-updates/
https://www.ukfinance.org.uk/system/files/2023-12/Mortgage%20Market%20Forecasts%202024-2025.pdf
https://www.bankofengland.co.uk/statistics/tables
https://www.statista.com/statistics/429086/home-purchase-moving-remortgage-loans-value-uk/
https://www.ukfinance.org.uk/system/files/2022-04/Later-Life-Mortgage-Lending-Q4-2021.pdf
https://www.bankofengland.co.uk/statistics/mortgage-lenders-and-administrators/2023/2023-q3
Historical best month to remortgage
https://www.bankofengland.co.uk/statistics/tables
Additional UK remortgage cost statistics
https://www.bankofengland.co.uk/statistics/tables