According to UK car insurance statistics from the Bank of England (BoE), the private motor industry insurance market issued over £14.7 billion in gross written premiums (GWP) in 2023, with the commercial motor insurance industry issuing approximately £5.6 billion in the same year.
Although these figures are the most up-to-date available from the BoE, research collated from other sources suggests that this figure is likely to have risen substantially in subsequent years.
Our research gathered the most recent UK car insurance statistics for 2024, to include information on people’s average car insurance premiums, as well as demographic breakdowns such as age, gender, region, job type, and car type. By looking at past data and future projections, we were able to outline how the industry has evolved over time and make predictions about the future of car insurance in the UK.
*For legal purposes, motor vehicles are often identified within a number of vehicle classes including cars, buses, motorcycles, off-road vehicles, light trucks, and regular trucks. This means that these figures account for more than just car insurance.
Overview of UK car insurance statistics 2024
According to Global Data, the UK car insurance market issued more than £14.7 billion in gross written premiums (GWP) in 2023.
As of 2024, the car insurance industry is valued at £21.9 billion – a 14.6% increase from 2023.
Private motor insurance is expected to account for 80% of the total industry revenue in 2022-23.
The average cost of car insurance as of Q3 2022 is £511, a rise of around 7% from the start of 2023.
Men pay around 17% more on average for car insurance than women.
Younger drivers pay the highest insurance premiums, with 17-24-year-olds paying an average of £1,924 per year.
Drivers in Greater London pay more than £284 per year, on average, for car insurance than any other English region.
UK car insurance market statistics 2023
The latest UK car insurance statistics from Global Data found that the private motor industry insurance market issued over £14.7 billion in gross written premiums (GWP) in 2023. This is expected to rise by a further 3% each year through to 2026.
Motor insurance statistics from the AIB show that insurers paid out a total of £9.9 billion in 2023 to cover claims associated with car insurance. This included theft, vehicle repairs, cover cars, as well as accounting for personal injury. This represented an 18% upswing compared to the previous year, and was the highest figure since 2013.
Added to this, the cost of vehicle repairs in 2023 is the highest since records began, hitting £6.6 billion across the year. Rising by almost a third (31%) between the start of 2022 and 2023, with vehicle repair costs increasing by £1.4 billion.
Payouts for vehicle thefts have also increased to £669 million throughout 2023, which is almost a quarter (23%) more than in 2022.
UK car insurance market size
According to the latest UK car insurance statistics, the car insurance industry is valued at approximately £21.9 billion as of 2024. This is a 14.6% increase from 2023, and nearly 15% from 2022.
Market value of UK car insurance industry by year (2013-2024)
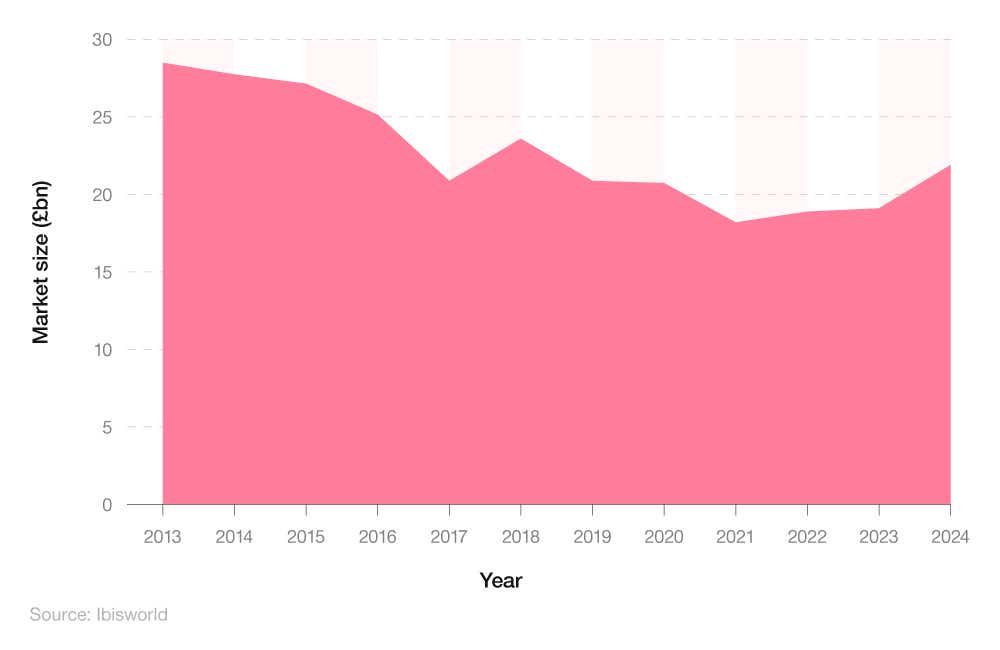
The upward trajectory of these figures suggests that the market is slowly recovering in value from the Covid-19 crisis where it suffered a value drop of over 10% - from £20.73 billion to £18.19 billion - between 2020 and 2021.
Despite this steady rise, the overall value of the car insurance market remains a far cry from 10 years ago, with the 2013 total of £28.49 billion around a quarter (23%) higher than the 2024 valuation.
While the Covid-19 crisis and the general decline in the UK economy were undeniable factors in this decline, these figures represent a steeper decline than the one faced by the overall UK economy during this period.
Private motor insurance is expected to account for 80% of the total revenue in 2022-23, with the four largest car insurance firms expected to be responsible for around 37.5% of the overall industry revenue.
UK car insurance market share statistics
The most recent statistics on the UK car insurance market share indicate that, as of 2023, the top 10 biggest UK car insurance providers accounted for around 70% of the total market.
Market share of UK car insurance firms by company (2021-23)
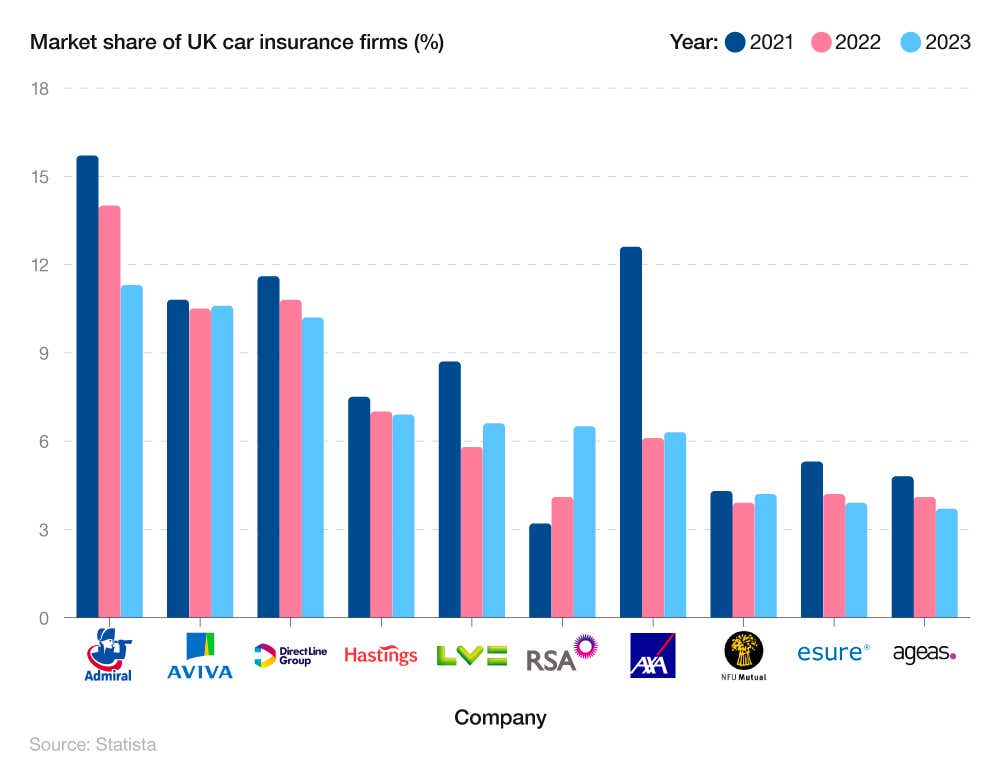
Of these companies, the Admiral group had the largest market share. The company, which includes established subsidiary brands like Bell, Diamond, Elephant, Gladiator, and Veygo, was found to have a market share of 11.3%. However, their market share has fallen by close to a 20th since 2022.
This figure was just 0.7% higher than Aviva and the Direct Line Group, which ranked second and third with market shares of 10.6% and 10.3%, respectively.
Nine of the top 10 car insurance companies saw their market share decrease between 2021 and 2023. The biggest fall was recorded by AXA, with its market share halving from 12.6% to 6.3% over this period.
The only company in the top 10 to record an increase was RSA, with their share more than doubling, increasing from 3.2% to 6.5%.
UK car insurance premiums statistics
The latest stats on UK car insurance premiums found that the industry incurred net combined ratios (NCR) of 90.3% and 96.6% in 2020 and 2021. By 2022, NCR had risen considerably to 109.5%. The net combined ratio is a measure of profitability and is used by insurance companies to indicate how well they are performing. It is calculated by dividing incurred losses from claims and expenses by the earned premiums.
A breakdown of the net combined ratio (NCR) for the UK car insurance industry between 2020 and 2023
| Year | Net combined ratio (NCR) |
|---|---|
| 2020 | 90.30% |
| 2021 | 96.60% |
| 2022 | 109.50% |
| 2023* | 108.50% |
(Source: Ernst & Young Global Limited) *Predicted figures
As both figures are below 100%, this indicates that the industry was operating at a significant profit in both of these years, suggesting that post-pandemic factors such as low levels of commuting and fewer insurance claims had a considerable effect on the premiums paid out.
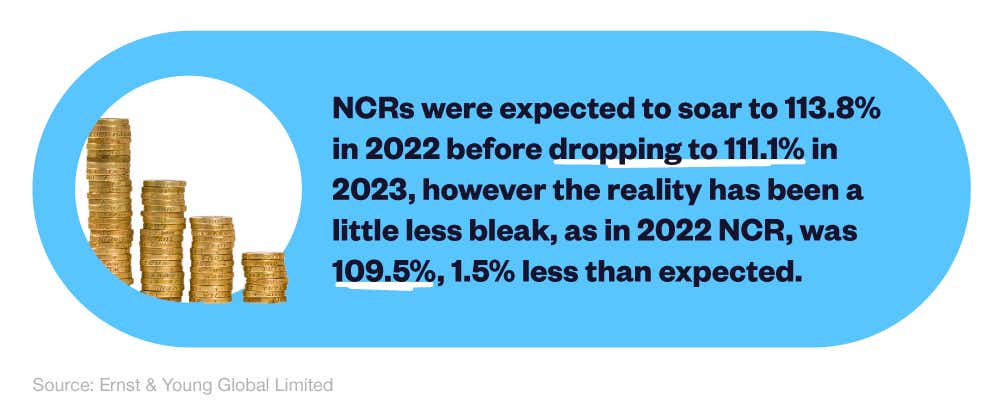
However, this trend had reversed as of 2022 and was expected to continue into 2023 as driving habits returned to pre-pandemic levels. NCRs were expected to soar to 113.8% in 2022 before dropping to 111.1% in 2023. However, the reality has been a little less bleak. In 2022, NCR was 109.5% – 1.5% less than expected – while the prediction for 2023 was at a slightly lower 108.5%. These predicted losses have been largely driven by increased inflation caused by rising costs of materials, labour, and energy prices.
The considerable losses anticipated across the industry are likely to have been a key factor in the sharp rise in insurance premiums predicted for many drivers in the coming year.
As for average driver premiums, they were set for a substantial rise of 16% (£74 per policy) in 2023 and 11% (£59 per policy) in 2024.
Average cost of UK car insurance
The latest statistics on the average cost of UK car insurance show the average price paid by motorists for their insurance increased by 12% between Q3 2023 and Q4 2023.
In the first quarter of 2024, the average premium paid for private motor insurance was £635 – up 1% compared to the previous quarter. This is only the second time the average price of car insurance has exceeded £600 since records began.
A breakdown of the average annual cost of car insurance by quarter and year (2018-23)
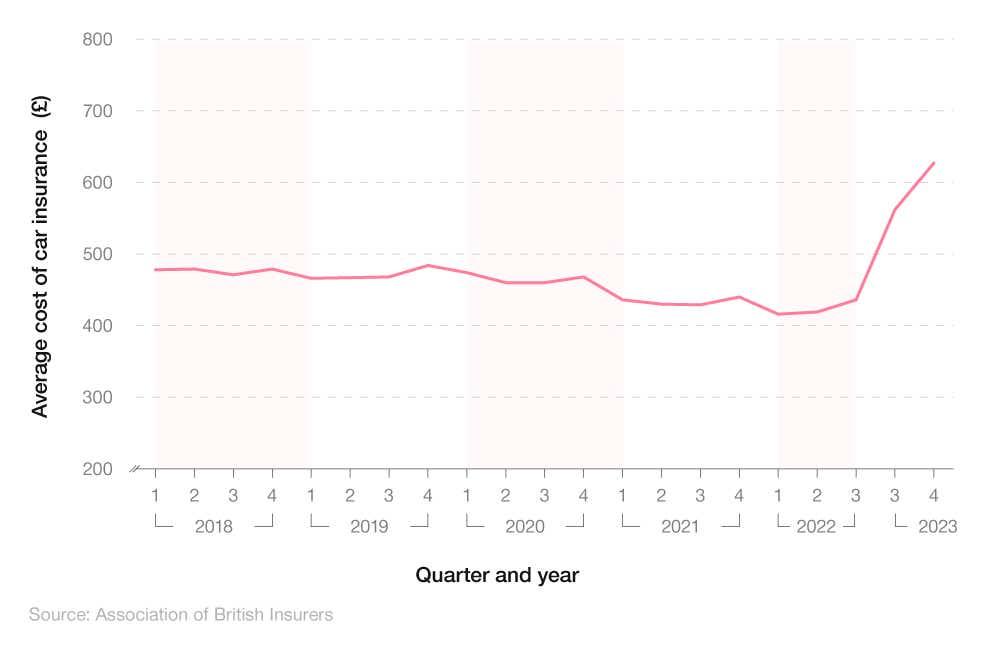
The average price paid by motorists renewing their cover also went up, increasing by 8% in the last year. Drivers renewing their cover now pay an average of £471 for their car insurance renewal.
New drivers buying car insurance for the first time have also been hit by higher costs. In Q1 2023 this stood at £541, but has since risen by 4% to £566 in Q2 2023.
Classic car insurance statistics indicate a market size of almost £730 million in 2023. If you have a car that is at least 15 years old and holds a minimum value of £40,000, you could be eligible for classic car insurance cover.
The average cost of repairing vehicle damage has also risen rapidly between Q1 2022 to Q1 2023. The cost of vehicle repairs increased by a third (33%) during this time period, costing insurers a total of £1.5 billion. This can likely be attributed to the creation of more sophisticated vehicles that require more expensive repairs, the continued shortage of semiconductor microchips, and other global supply chain issues in the wake of Russia’s invasion of Ukraine.
The latter issue has led to longer waiting times for new cars and parts which have resulted in used car prices rising by an average of 30% in 2021, according to Autotrader. Prices have since flatlined, with there being virtually no change in average price between 2022 and 2023, however costs remain considerably higher than pre-pandemic levels. This is another potential factor in the rise of average car insurance costs for customers.
Got more than one car in your household? Then, getting a multi-car insurance policy can be a great way of saving money in the long-run.
On 1 January 2022, the Financial Conduct Authority (FCA) introduced changes to the way companies were allowed to price motor insurance for new and existing customers. These changes were designed to safeguard existing customers from being offered worse deals than new customers taking advantage of introductory plans.
Indications are that these changes have had a considerable effect on the market, with the average premium paid for a new policy in Q2 2023 almost £70 higher than a renewed policy. The main reason why drivers looking for a new policy have to pay more is that often they are younger drivers, who have limited experience on the roads, thus causing their premiums to be higher.
UK car insurance market trends: Factors that affect the cost of car insurance
We analysed car insurance stats by age to identify the average annual cost for drivers across seven ages. The findings confirm the widely referenced belief that younger drivers tend to pay more for their car insurance, with the youngest age paying by far the highest costs.
What are the average car insurance costs by age?
Uswitch quote data suggests that the younger you are, the more likely you are to pay more for your car insurance. The average car insurance quote for those aged 17 to 20 years old is £2,245, almost a third more than those in the 21-25 age group (£1,477).
The average cost of car insurance annually drops below £1,000 once you reach 31 years old, with each subsequent age group decreasing. The largest decrease comes between the age group 51-55 and 56-60, where the average price of annual insurance drops by £109.33.
A breakdown of average car insurance costs by age
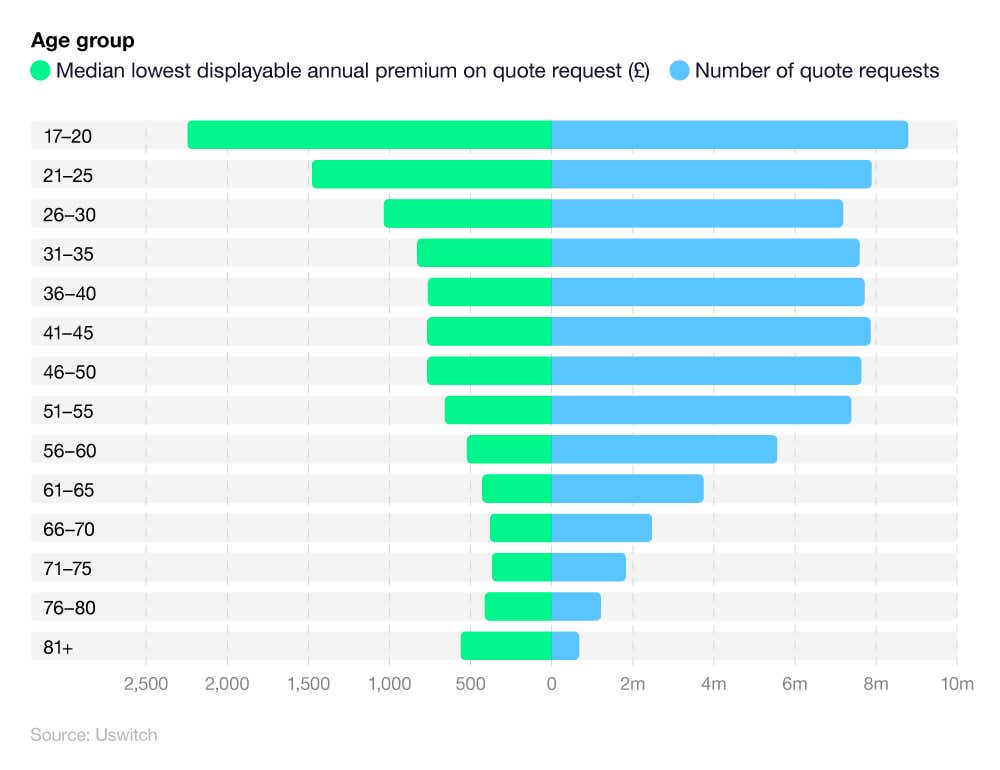
This trend stops at the age of 71-75, with this age group’s average annual fee of £367.96 being the lowest of all age groups – £1,877.27 more than the youngest age group (17-20).
From here, average prices begin to rise, with 76 to 80-year-olds paying around £44.39 more. Those aged 81 and over pay £148.47 more than those aged 78-80.
This data highlights the fact that, as drivers reach the oldest age categories, they begin to lose the cost benefits widely associated with car insurance for the over 50s.
How does your job affect your car insurance?
Recent UK car insurance statistics on the average insurance price by job title indicate that traders will pay the highest rates on average of any occupation in 2024.
With an average insurance cost of £744.02, chefs will pay fractionally more than mechanics, graphic designers and web designers, who had average costs of £728.26, £711.96, and £696.97, respectively.
A breakdown of the cheapest jobs for car insurance by average car insurance costs
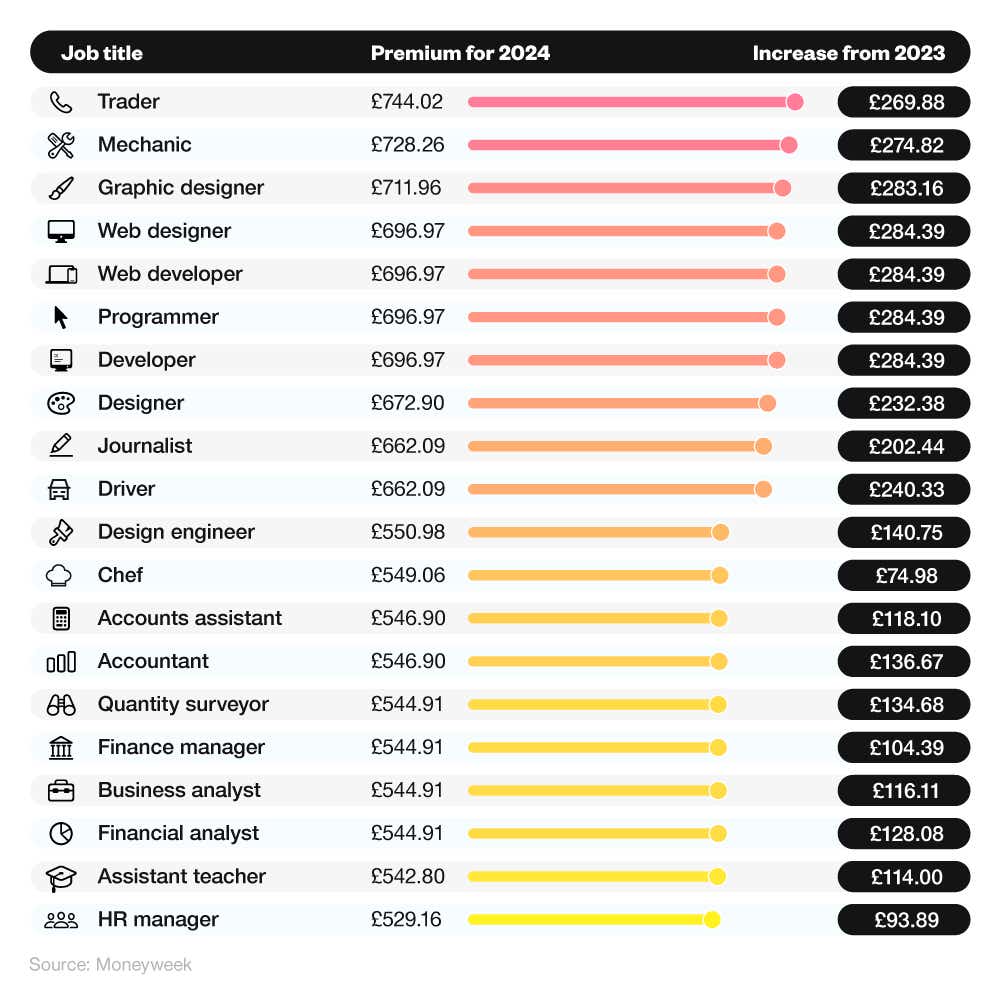
Every occupation on the list saw increased car insurance prices between 2023 and 2024. The occupation that saw the smallest increase in real terms were chefs, whose insurance costs rose by £74.98.
The industries that saw the largest increase in real terms were web designers, web developers and programmers, increasing by £284.39.
These industries also saw the greatest percentage increase between 2023 and 2024, rising by 40.8% in just a year.
The price of car insurance rose by just 13% for chefs, whereas it increased by almost a fifth (19%) for finance managers.
Looking to cut back even more on your annual renewal quote? Check out our guide for our top tips for cutting the cost on your car insurance.
A breakdown of how profession affects car insurance costs
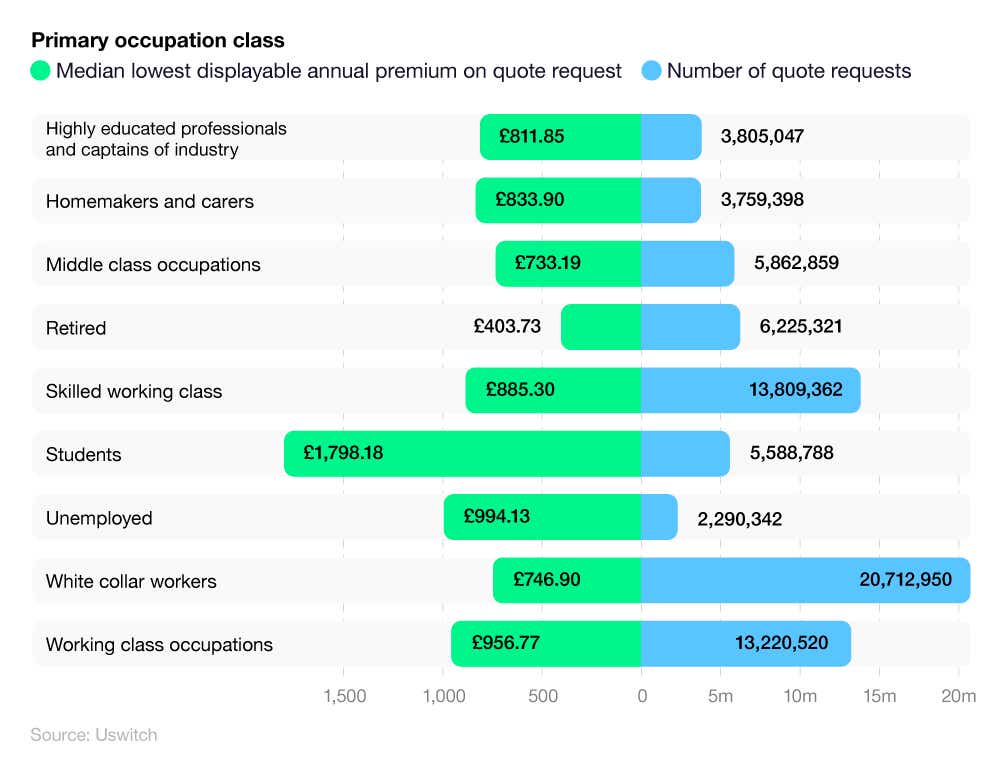
Quote data from Uswitch found that students paid the most for their car insurance, with average premium on quote request of £1,798.18. This is four-fifths (80%) more than the next highest payers who were the unemployed.
The drivers with the lowest annual premiums were the retired, who only had to pay £403.73. This is more than three-quarters (77%) less than what students had to pay for their car insurance, meaning three months of student car insurance is comparable to a whole year of insurance for a retired driver.
The most quote requests were taken out by white collar workers, with 20.7 million. This is nearly half (49%) more than the next highest number of quote requests which came from the skilled working class.
Young driver statistics show those aged 17-20 years old are most likely to pay more for their car insurance. Compare student car insurance deals for the best price.
Average car insurance costs by gender: Male vs female car insurance rates
The latest stats on the average car insurance costs by gender show that men pay considerably more than women for their car insurance.
A breakdown of male vs female car insurance rates based on average car insurance costs
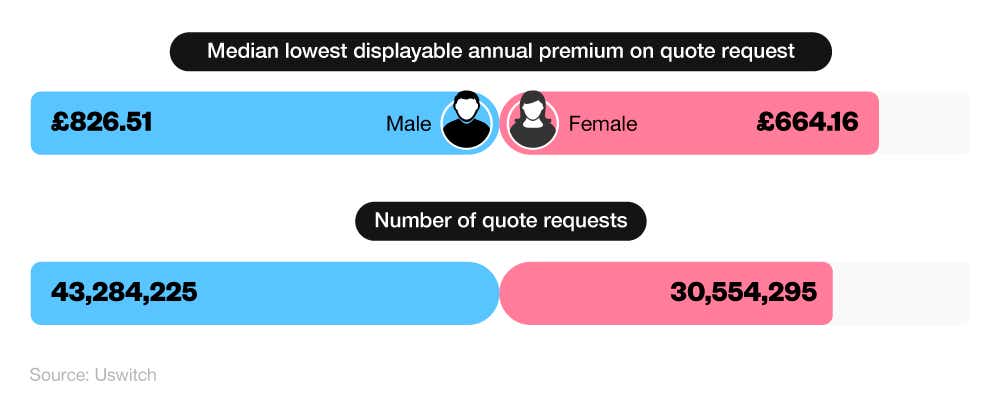
Data from Uswitch shows that men pay close to a quarter (24%) more than women, on average, for their car insurance. The average quote for men came in at £826.51, compared to £664.16 for women.
Men also took out two-fifths (40%) more quote requests than women.
Visit our comprehensive car insurance guides section for expert advice on managing your car insurance.
Average car insurance costs by UK nation
Recent statistics on the average car insurance costs by UK nation paint a varied picture of prices across the UK. With average annual premiums of £833.91, England is the nation with the highest average costs.
A breakdown of average car insurance costs by home nation
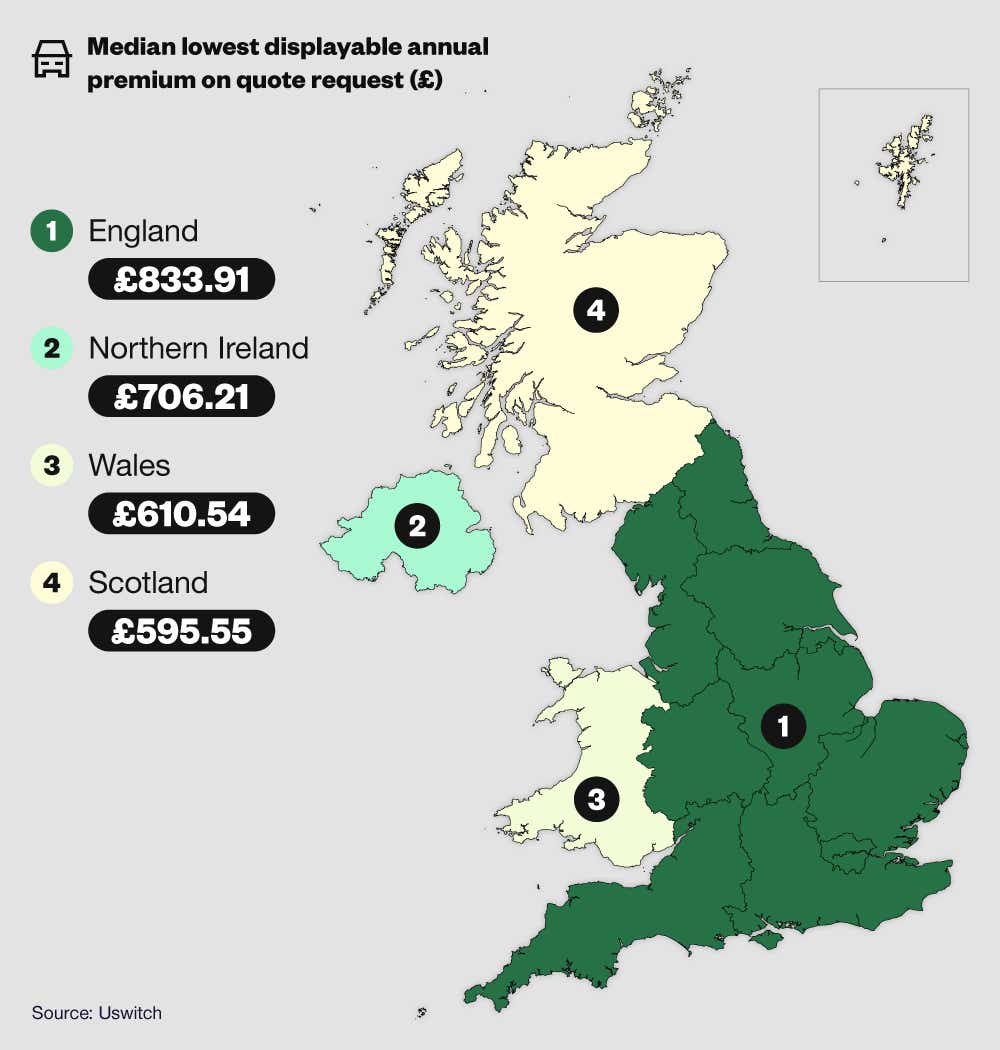
England’s figures were nearly 17% higher than car insurance in Northern Ireland, whose average fees of £706.21 were the next highest of the four countries. Car insurance in Scotland and Wales was considerably less than the other two nations, with Wales’ total of £610.54 – more than 2.5% more than the average cost of insurance in Scotland.
With the lowest average premiums, Scotland’s total of £595 means that its drivers pay around 28% less on average for insurance than drivers in England.
Which UK country has the lowest average car insurance premiums?
Scotland has the lowest annual premiums, with an average cost of £595.55 per year.
Average car insurance costs by UK region
The latest statistics on the average car insurance costs by region show that drivers in London pay by far the highest premiums of any region in the UK. With an average car insurance price of £1,162 per year, London drivers paid over a quarter (25%) more than the North West, which paid the next highest average fee at £925.
A breakdown of average annual car insurance costs by UK region
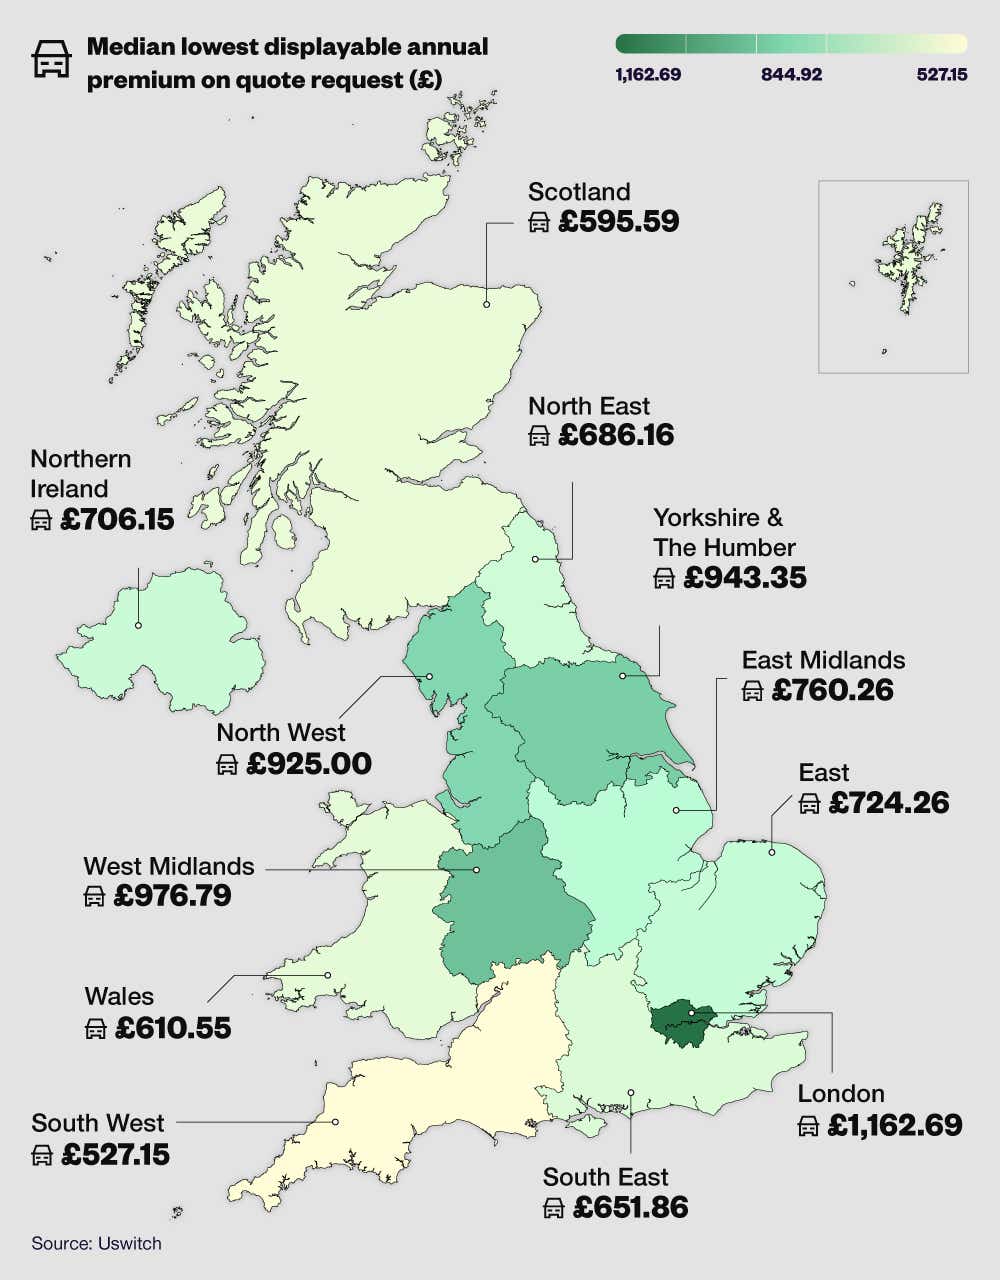
While many road and driving-related factors could have contributed to Greater London’s inflated fees, the higher cost of living in the capital is likely to have significantly increased the disparity.
At the other end of the table, the Channel Islands’ average annual fees of £238.60 were close to a quarter (24%) lower than any other region and around four-fifths (79%) less than the annual costs in London.
The region that paid the lowest amount on the mainland was the South West. Drivers in this area paid £527.15 – 19% less than the South East.
Regarding the North-South divide, the North West and West Midlands and the Midlands paid more than 13% extra on average car insurance premiums than any southern region outside of Greater London.
According to the latest UK temporary car insurance statistics, the average UK driver spends more than £3,500 a year on running a vehicle. One way that you could look to save money is to switch to a temporary car insurance policy for only when you need to use your vehicle.
Average car insurance costs by age of car
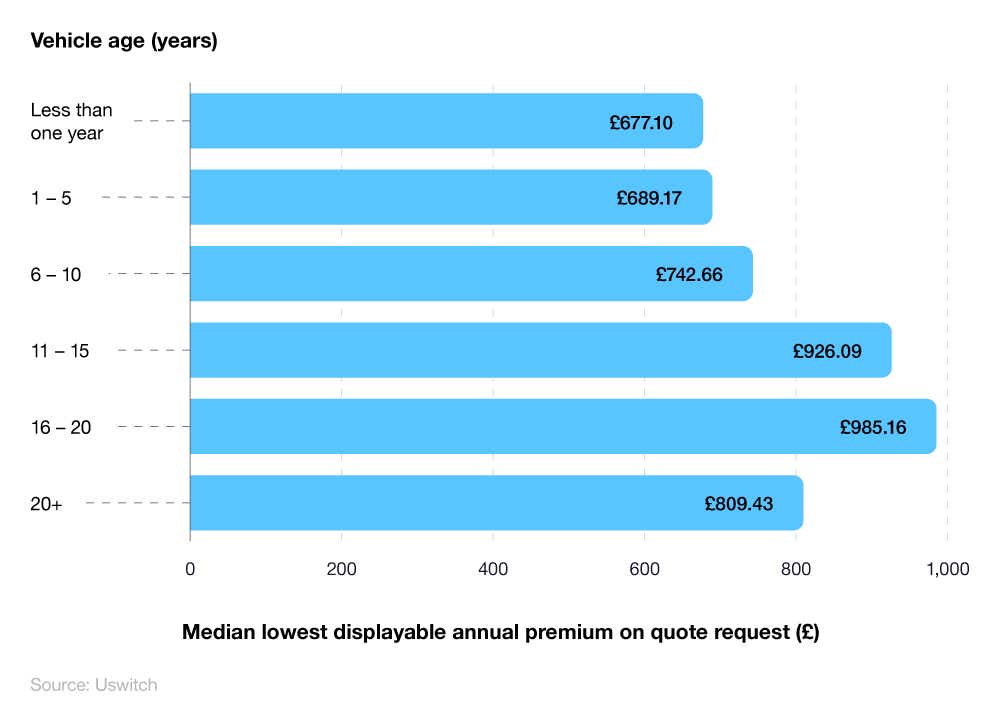
Uswitch quote data shows that a car's age affects the average car insurance policy in the UK. Generally speaking, the older the car, the more you will pay.
Cars over 20 years old are the only exception, where they may be deemed ‘classic cars’ and insured under classic car insurance policies. These vehicles are driven fewer miles than younger vehicles, and owners take more safety precautions – such as keeping them in a secure garage away from prying eyes and the elements.
The most expensive car insurance can be expected for cars aged between 16 and 20 years old, setting owners back an average of £985.16 per year. This is followed closely by cars aged between 11 and 15 years old, with an average yearly cost of £926.09.
Based on average car insurance quotes, new cars under the age of five are the cheapest to insure, ranging between £677.10 and £689.17 per year.
The difference between the most and least expensive car insurance is £308 – or an increase of 45%.
Average car insurance costs by no claims bonus
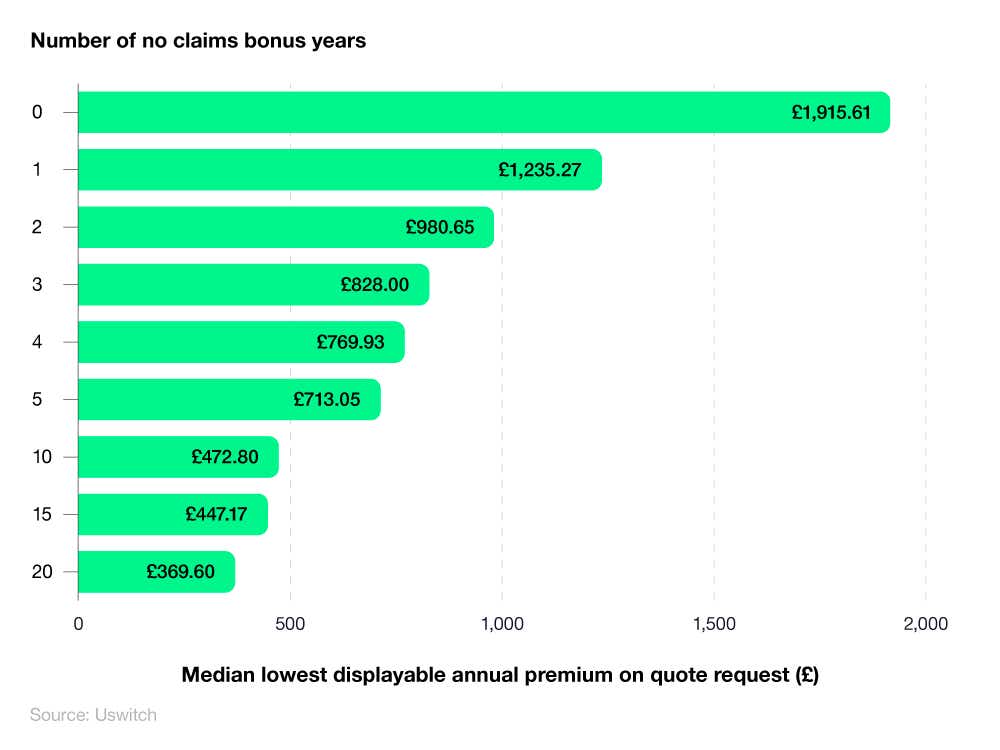
A no claim bonus (NCB) is a discount that can be applied to an insurance policy based on the number of consecutive years the policyholder has gone without making any claims. If there are still no claims on your policy, you keep getting a discount.
Car insurance statistics testify to this, with recent quote data from Uswitch showing that the longer a driver goes without making a claim, the lower their car insurance will be.
The average car insurance cost for those starting to driveis around £1,915.61 per year. This reduces by more than half (55%) to £1,235.27 once you have one year no claims bonus against your name.
On the other end of the scale, policyholders with 20+ years of no claims bonus can expect to pay an average of £369.60 each year – a difference of £1,546.
UK car insurance claims statistics
Statistics show that 97% of private motor insurance claims were accepted, with the average claim amounting to £3,479.
UK car insurance customer satisfaction statistics
The latest UK car insurance customer satisfaction and complaint stats found that close to 48,000 new complaints were registered with the Financial Ombudsman Service (FOS) with regard to insurance in Q3 2023-24.
Of the new and existing complaints, 4,123 were found to be related to motor insurance, meaning that motor insurance complaints accounted for close to one out of ten (11%) of total complaints for the year.
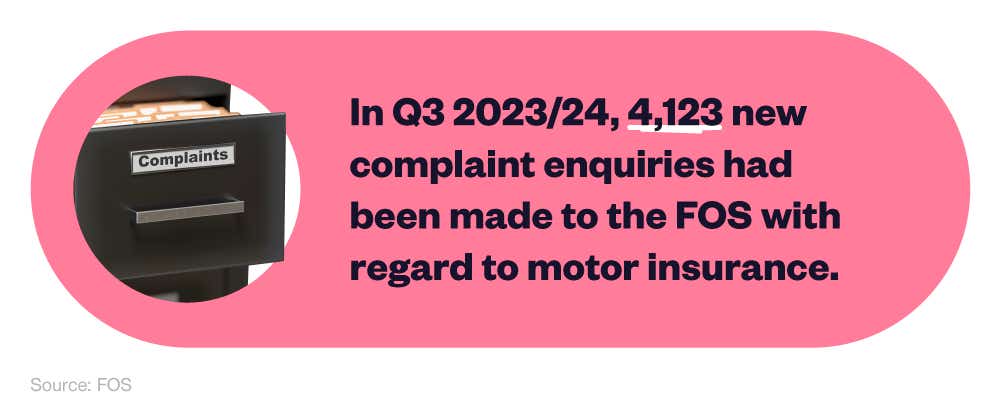
The same report from the FOS found that car and motorcycle insurance was the product with the fourth most registered complaints, behind hire purchase (motor) insurance, credit cards and current accounts.
If you combine the number of complaints for hired cars and private vehicles, hired cars are the greatest source of complaints, coming in at 9,542 for both. This is a fifth (22%) more than the highest single contributor, which was current accounts.
In Q4 2023, 4,036 cases involving motor insurance were referred to the FOS, a 4% increase from the previous quarter and a 47% increase from Q4 2022. Many of these complaints were centred around an underestimation of the consumers’ vehicle value.
Motor vehicle industry statistics
The latest motor vehicle industry stats from IBIS World found that there were 39.2 million registered motor vehicles in the UK as of 2024 – a compound annual growth rate (CAGR) of around 0.39% per year since 2018.
Motor vehicle industry statistics reveal a number of changes in recent years including:
Over the past two decades, the number of motor vehicles has steadily grown, with 10.8 million more registered vehicles in 2024 than in the year 2000.
Between 2023-24, the number of vehicle registrations rose by 1.1%.
The total number of vehicles fell by 2% in 2021-22 to 37.5 million
According to the Department for Transport (DfT), the number of new vehicle registrations fell by 0.3% in Q1 2020, before rising by 0.8% in Q1 2021
According to SMMT data, the total number of new car registrations for 2022 exceeded 1.6 million (a 2% drop from the previous year).
UK car insurance FAQs
Why has car insurance gone up?
In the UK, car insurance premiums have increased primarily due to a rise in claims costs, driven by factors such as higher repair expenses, increased personal injury claims, and inflation.
Why is car insurance so expensive?
As with many industries, the rising cost of living has had a detrimental effect on the price of car insurance. As insurers cope with growing pressures like rising repair costs and increasing second-hand car prices, many companies are increasing their premiums to keep their profits out of the red.
Despite the volatile market, taking the time to shop around and compare prices will go a long way to helping you find a car insurance plan that’s competitive and works for you.
How to get cheap car insurance?
To get cheap car insurance, we recommend comparing quotes from multiple providers, maintaining a good driving record, opting for a higher excess and taking advantage of discounts for low mileage or installing safety devices.
How to check the car insurance expiry date?
To check your car insurance expiry date, review your insurance policy documents or contact your insurance provider for the full details.
What is voluntary excess on car insurance?
The voluntary excess on car insurance is the amount you agree to pay out of pocket for a claim before your insurer covers the remaining costs. It is typically chosen to reduce the premium.
What is a no-claims bonus?
A no-claims bonus is a discount on car insurance premiums awarded to drivers who have not made any claims on their insurance policy for a consecutive number of years.
Why is car insurance so expensive for young drivers?
Young drivers pay more for car insurance because they’re considered to be high-risk drivers. As these drivers typically have less experience on the road, they’re considered more likely to be involved in accidents and therefore more likely to make a claim.
Younger drivers are also statistically more likely to be involved in accidents, with around 25% of insurance claims made by drivers under 25.
What is the average cost of car insurance per year?
The latest figures from the Association of British Insurers (ABI) found that UK drivers paid an average of £436 per year on their car insurance in Q3 2022. This represented a rise of nearly 2% from Q3 2021 but was more than 5% less than the same period in 2020.
How can I reduce my car insurance?
Car insurance prices can vary substantially from person to person and company to company. Nevertheless, there are measures you can take that should help you reduce the cost of your car insurance.
Firstly, most insurers will offer you a more cost-effective plan if you’re doing your best to keep your car away from vandals and thieves. As such, parking your car in a garage or driveway overnight can have a big impact on your annual or monthly car insurance premiums.
Cars that drive fewer miles typically pay less for car insurance, so limiting your mileage is another effective way to keep your costs down. It’s also worth noting that insurance premiums can vary wildly based on the type of car, so researching the average insurance costs when buying a car can save you some money down the road.
Finally, shopping around and comparing insurance costs before committing to one plan is an excellent way to ensure you get the best deal on your car insurance. Price comparison sites like Uswitch compare car insurance plans from the most prominent outlets to help you to find the best deal to suit you.
What is car insurance excess?
Excess is the amount you have to pay when making a car insurance claim, regardless of whose to blame. The excess is typically pre-agreed when taking out your insurance policy and will vary based on the company and factors such as your age, car, and driving history.
There are two types of car insurance excess: compulsory and voluntary. Compulsory excess is the type pre-determined by your insurance company and cannot be changed.
Voluntary excess is the amount you choose to pay on top of your compulsory excess. While a high voluntary excess comes with a risk of higher payments in the event of a claim, choosing to pay a higher voluntary excess will usually result in you paying less on your monthly insurance premiums.
What is a no-claims bonus?
A no-claims bonus is a car insurance discount earned for every year of driving without making a claim. Your no-claims discount builds up with each claim-free year, so the longer you go without making a claim, the bigger your discount will be.
The value of no-claims discounts varies depending on the insurer, but they can be as much as 30% off for one claim-free year and 60% off for five claim-free years.
Do women pay less for car insurance?
On average, yes. While women have typically paid less than men for car insurance on average, a recent EU directive prohibiting car insurance companies from using gender as a factor in their risk assessment forms was expected to narrow the price gap between men and women.
Despite this, recent UK car insurance statistics show that women continue to pay substantially less than men, with a study from Admiral finding their male drivers were paying an average of around £140 more per year for car insurance.
UK car insurance glossary
Assumed written premiums
Assumed written premiums (AWP) are the revenue insurers receive for policy coverage that's provided due to a reinsurance agreement.
Black box car insurance
Black box car insurance (also known as telematics car insurance) is a type of policy where your driving is monitored via a small device fitted into your car.
The insurance company can use the device to track your driving habits and set your premiums accordingly.
Commercial motor industry
The commercial motor industry refers to any vehicle used to transport goods or passengers for the profit of an individual or business. Examples of this include taxis, buses, pick-up trucks, vans, and coaches.
Compound annual growth rate
Compound annual growth rate (CAGR) is the average annual growth of an investment over a specified period of time greater than one year. This is one of the most accurate methods of calculating returns on individual assets, companies, and industries.
Direct written premiums
Direct written premiums (DWP) are the total amount of an insurer's written premiums received without accounting for any premiums ceded to reinsurers.
Fully comprehensive insurance
Fully comprehensive car insurance is the highest level of car insurance cover available in the UK. This type of insurance pays out if you damage your car, damage someone else's car or injure someone in an accident, regardless of who is to blame.
Fully comprehensive insurance also covers accidental damage, medical expenses, and any damage or theft to the contents of your car.
Financial Ombudsman Service (FOS)
The Financial Ombudsman Service (FOS) is an independent public body set up to settle disputes between customers and companies that provide financial services like insurance.
Gross written premiums
Gross written premiums (GWP) is the sum of both direct written premiums (DWP) and assumed written premiums (AWP) without accounting for any premiums ceded to reinsurers.
Private motor industry
The private motor industry refers to any vehicle owned or operated by a private carrier for personal use.
Semiconductor microchip
Semiconductor microchips are silicon-based microchips that sit between a conductor and an insulator. They are a crucial component of modern car electrical systems including digital dashboards, inbuilt sat-navs and vehicle infotainment systems.
Third-party, fire, and theft insurance
Third-party, fire, and theft insurance is a type of car insurance that covers you against costs that occur from damages or injuries that you caused to other people, while also protecting you from the costs incurred by theft or fire damage to your vehicle.
Third-party insurance
The legal minimum level of car insurance cover in the UK. Third-party insurance protects you against costs that are incurred from damages or injuries that you caused to other people.
For further information, or definition for other keywords associated with car insurance, then check out our comprehensive car insurance glossary.
Methodology and sources
https://www.statista.com/statistics/283310/total-motor-insurance-claims-paid-in-the-uk-since-2002/
https://www.globaldata.com/store/report/uk-general-insurance-market-analysis/
https://www.globaldata.com/store/report/uk-private-motor-insurance-market-analysis/
https://www.abi.org.uk/news/news-articles/2024/4/motor-insurers-pay-out-record-amounts-to-help-keep-motorists-mobile/
https://www.globaldata.com/store/report/uk-private-motor-insurance-market-analysis/
https://www.ibisworld.com/united-kingdom/market-size/motor-vehicle-insurance/
https://www.ibisworld.com/united-kingdom/market-research-reports/motor-vehicle-insurance-industry/
https://www.mordorintelligence.com/industry-reports/united-kingdom-motor-insurance-market
https://www.ageas.co.uk/press-releases/2022-press-releases/results/
https://www.esuregroup.com/media/ksfi3bwq/analyst-presentation-march-22.pdf
https://www.ey.com/en_uk/news/2023/06/ey-uk-motor-insurance-results-analysis
https://www.ey.com/en_uk/news/2023/12/ey-s-latest-uk-motor-insurance-results
https://www.nfumutual.co.uk/globalassets/about-us/agm/agm-2022/our-performance.pdf
https://www.nfumutual.co.uk/globalassets/about-us/agm/agm-2021/2020-reports-and-accounts.pdf
https://www.rsagroup.com/media/1ztfoztk/rsa-2021-full-year-results-announcement.pdf
https://admiralgroup.co.uk/sites/default/files_public/rns/2022/08/half-year-results-2022-rns.pdf
https://www.aviva.com/newsroom/news-releases/2022/11/Q32022-trading-update/
https://www.quotezone.co.uk/car-insurance/average-car-insurance-premium-by-region
https://moneyweek.com/personal-finance/insurance/job-titles-spike-insurance-costs
https://www.quotezone.co.uk/car-insurance/average-car-insurance-premium-by-region
https://www.autotrader.co.uk/content/news/used-car-values-rising-2022
https://www.theaa.com/cars/advice/dealers/aa-cars-used-car-index
https://www.ibisworld.com/united-kingdom/market-size/classic-car-insurance/
https://www.statista.com/statistics/751199/average-car-insurance-cost-by-age/
https://www.vanarama.com/blog/cars/how-much-job-title-impacts-car-insurance-2023
https://www.admiral.com/car-insurance/car-insurance-pricing-index
https://ec.europa.eu/commission/presscorner/detail/it/MEMO_11_123
https://www.fca.org.uk/data/complaints-data/firm-level
https://www.financial-ombudsman.org.uk/data-insight/quarterly-complaints-data
https://www.gov.uk/government/collections/vehicles-statistics
https://www.smmt.co.uk/vehicle-data/car-registrations/
https://www.ibisworld.com/uk/bed/total-number-of-registered-motor-vehicles/44066/
https://www.ibisworld.com/uk/bed/total-number-of-registered-motor-vehicles/44066/
https://www.oecd.org/daf/fin/insurance/oecdinsurancestatistics.htm
Which age group receives the best value for money on their car insurance? (Exclusive data)
https://www.data.gov.uk/dataset/cb7ae6f0-4be6-4935-9277-47e5ce24a11f/road-safety-data
https://www.gov.uk/government/statistical-data-sets/nts03-modal-comparisons
https://www.data.gov.uk/dataset/d0be1ed2-9907-4ec4-b552-c048f6aec16a/gb-driving-licence-data
https://motor.confused.com/Motor/Car
https://www.gov.uk/government/statistics/vehicle-licensing-statistics-july-to-september-2022
Which month has the safest driving conditions? (Exclusive data)
https://www.data.gov.uk/dataset/cb7ae6f0-4be6-4935-9277-47e5ce24a11f/road-safety-data
https://data.ceda.ac.uk/badc/ukmo-midas-open/data/uk-hourly-rain-obs/dataset-version-202207
https://data.ceda.ac.uk/badc/ukmo-midas-open/data/uk-hourly-weather-obs
https://twitter.com/metoffice/status/1048551642277335041?lang=en
https://www.gov.uk/guidance/the-highway-code/driving-in-adverse-weather-conditions-226-to-237
https://artefacts.ceda.ac.uk/badc_datadocs/surface/code.html


