Our analysis of the most up-to-date young driver statistics found that 2.8 million drivers aged 17-24 currently have a licence in the UK. Young people have been through a lot recently, with the rising cost of living making life financially even harder. This means it has never been more important for young drivers to get a good deal on their car insurance.
To understand why car insurance for young drivers is higher for today’s generation, we’ve crunched the numbers and collated over a hundred young driver insurance statistics of interest and note.
Top UK young drivers insurance statistics 2024
UK young drivers (17-24) account for around 7% of all full licence holders.
The average cost of insurance for young drivers is around £2,175 per year.
Young drivers in London tend to pay the most for their car insurance (£3,108) compared to those in the South West, who typically pay the least (£1,646).
Young female drivers are typically charged around a third less (30.1%) on their car insurance compared to males.
The most expensive type of car to insure for young drivers tends to be a four-door saloon (£2,897) compared to the cheapest (multi-purpose vehicle) at an average of £2,105 per year.
Newer cars tend to have lower average car insurance costs for young drivers, at £2,119 for brand new cars – around 15% less than a young driver with a 20-year-old vehicle.
Young drivers of a BMW or Mercedes-Benz can expect to pay the most on their car insurance (£2,838) – over a third (35.2%) more than Peugeot drivers aged 17-24.
18-year-olds can expect to pay the most for car insurance compared to other young drivers (£2,737), with the average cost typically decreasing with age down to £1,534 for 24-year-olds.
Young drivers from middle-class occupations tend to pay the least for their car insurance, with average costs of around £2,053. This is around 3% less than those from white-collar industries.
Young drivers typically save around £400 a year by paying their car insurance in one annual payment, with an average annual cost of £2,078.
How many young drivers are there in the UK?
According to UK government data, young people aged between 17 and 24 account for around 7% of all full licence holders nationwide.
DVLA licence figures state that there are 2.8 million drivers aged 17-24 in the UK, meaning just over two-fifths (44%) of people in this age group can drive.
The driving licence rate of 17-24-year-olds is considerably lower than the rest of the adult population, with nearly double the percentage of people aged 40-49 (86%) having licences. An estimated additional 2.1 million young car drivers have a provisional licence.
A breakdown of UK driving licence statistics by age and year
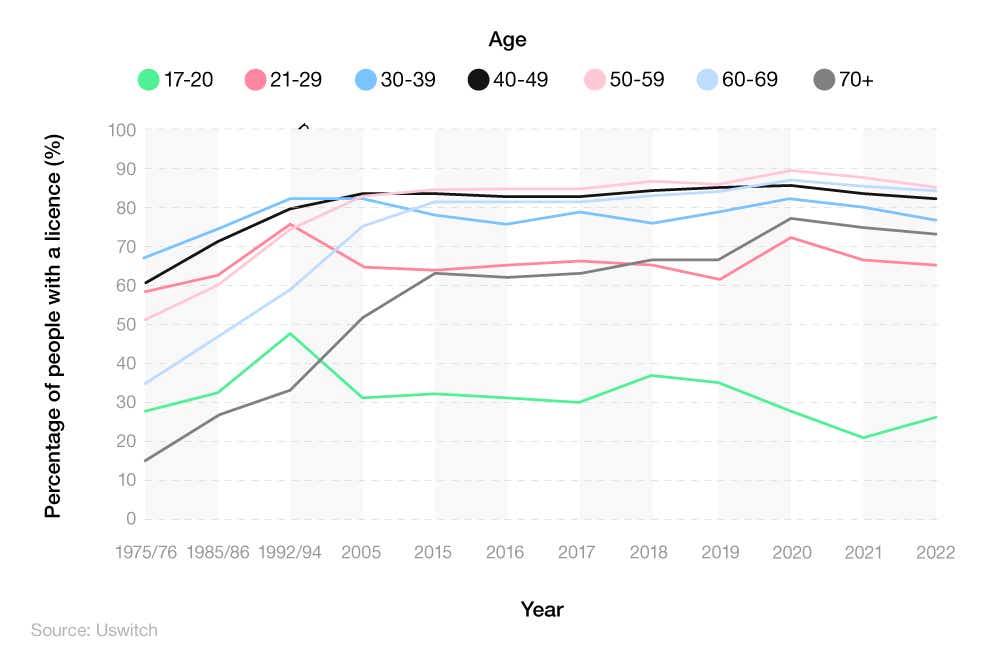
The percentage of young drivers on the road has fluctuated significantly over the years. In 1975-76, just over a quarter (28%) of people aged 17-20 had a driving licence. After increasing to almost half (48%) in 1992-94, the number of young drivers in the UK then went into decline.
Despite the rate of licence holders increasing for older generations between 1994 and 2005, the number of licence holders aged between 17-20 dropped by close to a fifth (20%).
Another significant change is that in the 1970s, young drivers (17-20) were almost twice as likely to have a licence compared to people over 70. That figure has now reversed, with virtually two-thirds (67%) of people over 70 still possessing a licence, compared to just under a third (31%) of those under 20.
As of 2022, just over a quarter (27%) of those aged 17-20 had a UK driving licence – up six percentage points from 2021, when just over a fifth (21%) held a licence. Yet this remained the lowest percentage across all UK age groups, and around a third compared to those aged 50-59, who occupied the largest percentage of drivers in 2022 at 85%.
What is the cost of young drivers insurance?
Based on analysis of Uswitch consumer quotes between May 2023 and April 2024, the average cost of insurance for young drivers is around £2,175 per year. However, various factors, such as location, age, gender, and even the type of job you have, may cause the price to rise and fall.
In what region do young drivers pay the most for car insurance?
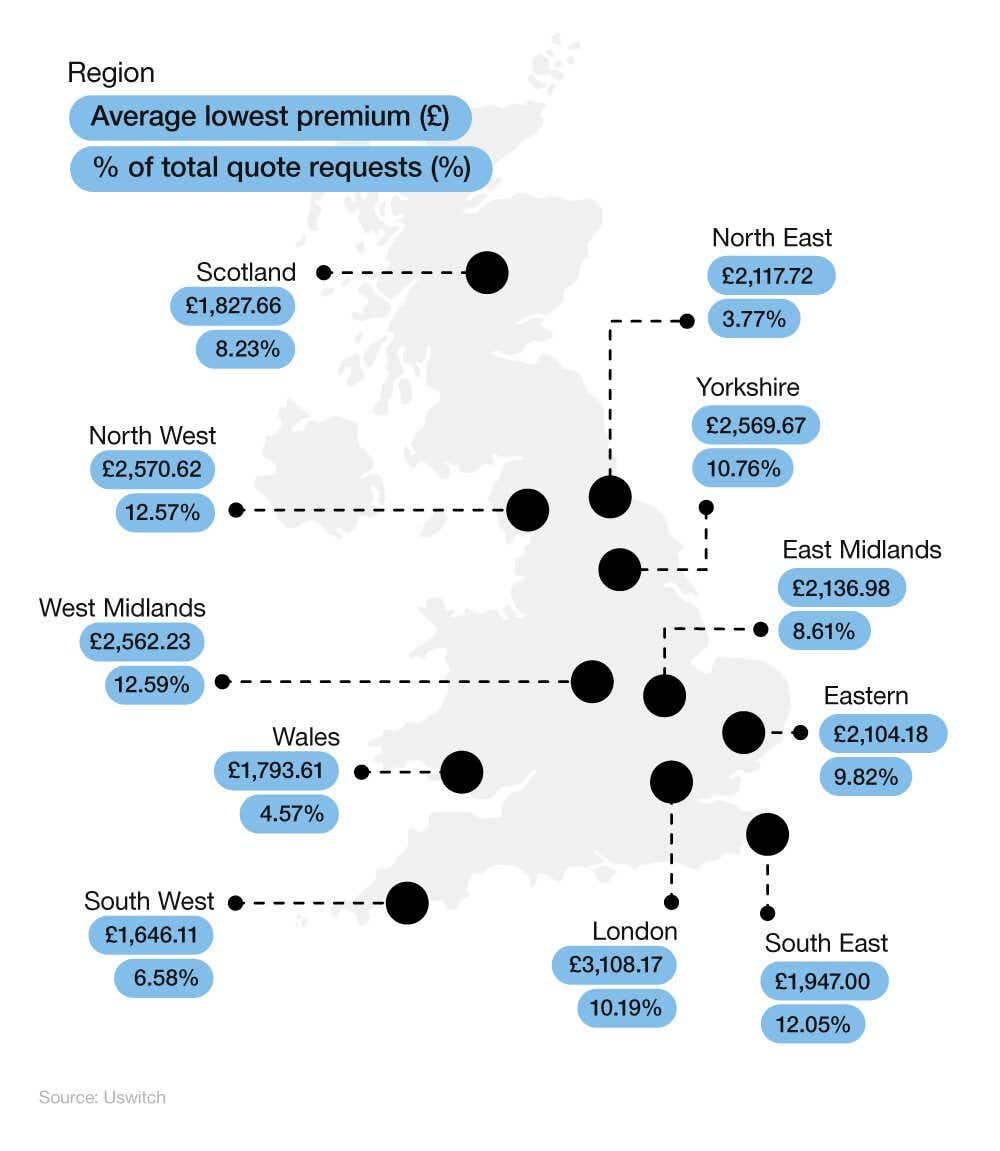
The region with the highest average car insurance price is London, where a typical young driver pays around £3,108. This is around a fifth (19%) more than the amount quoted for the second-most expensive region for young drivers' car insurance, the North West.
Between May 2023 and April 2024, the average insurance cost for new drivers in this region was £2,570. The West Midlands (£2,562) and Yorkshire and The Humber (£2,569) were not far behind as the only other two UK regions where the average cost of young driver car insurance exceeded £2,500.
A breakdown of the average cost of car insurance for young drivers across the UK
| Region | Average premium | % of total quote requests |
|---|---|---|
| East Midlands | £2,136.98 | 8.61% |
| Eastern | £2,104.18 | 9.82% |
| London | £3,108.17 | 10.19% |
| North East | £2,117.72 | 3.77% |
| North West | £2,570.62 | 12.57% |
| Northern Ireland | £2,049.68 | 1.26% |
| Scotland | £1,827.66 | 6.23% |
| South East | £1,947.00 | 12.05% |
| South West | £1,646.11 | 6.58% |
| Wales | £1,793.61 | 4.57% |
| West Midlands | £2,562.23 | 12.59% |
| Yorkshire and The Humber | £2,569.67 | 10.76% |
| (No lookup value) | £2,107.79 | 1.00% |
(Source: Uswitch)
The South West is the cheapest region in the UK for young drivers insurance. Its average premiums of £1,646 make it the only place in the UK where young drivers pay less than £1,700 on average. In fact, they’re quoted around three-fifths (61.5%) less, on average, compared to those in London.
The data shows that the other regions which are among the cheapest for young drivers' car insurance are:
Wales (£1,793)
Scotland (£1,827)
South East (£1,947).
The region with the highest percentage of total quotes between May 2023 and April 2024 was the West Midlands, home to over one in ten (12.59%) quote requests. This was followed closely by the North West (12.57%) and the South East (12.05%).
London, which had the most expensive quotes, came out in fifth for total quote requests. The North West and West Midlands combined had more than double the number of requests by comparison.
How much do young male drivers pay compared to young female drivers?
The young driver statistics that we collated did reveal notable contrasts between young female and male drivers. Female drivers make up just three out of ten (32.67%) quotes, less than half as many as males.
A breakdown of the average costs of car insurance for young male and female drivers
| Gender | Average premium | % of total quote requests |
|---|---|---|
| Female | £1,810.08 | 32.67% |
| Male | £2,451.31 | 71.08% |
(Source: Uswitch)
Young male versus female car insurance rates show that female drivers are charged around a third less (30.1%) on their car insurance than their male counterparts.
Based on Uswitch quote data between May 2023 and April 2024, the median average quote for a young female driver was £1,810, compared to £2,451 for male drivers.
How does the type of car affect the price of insurance for young drivers?
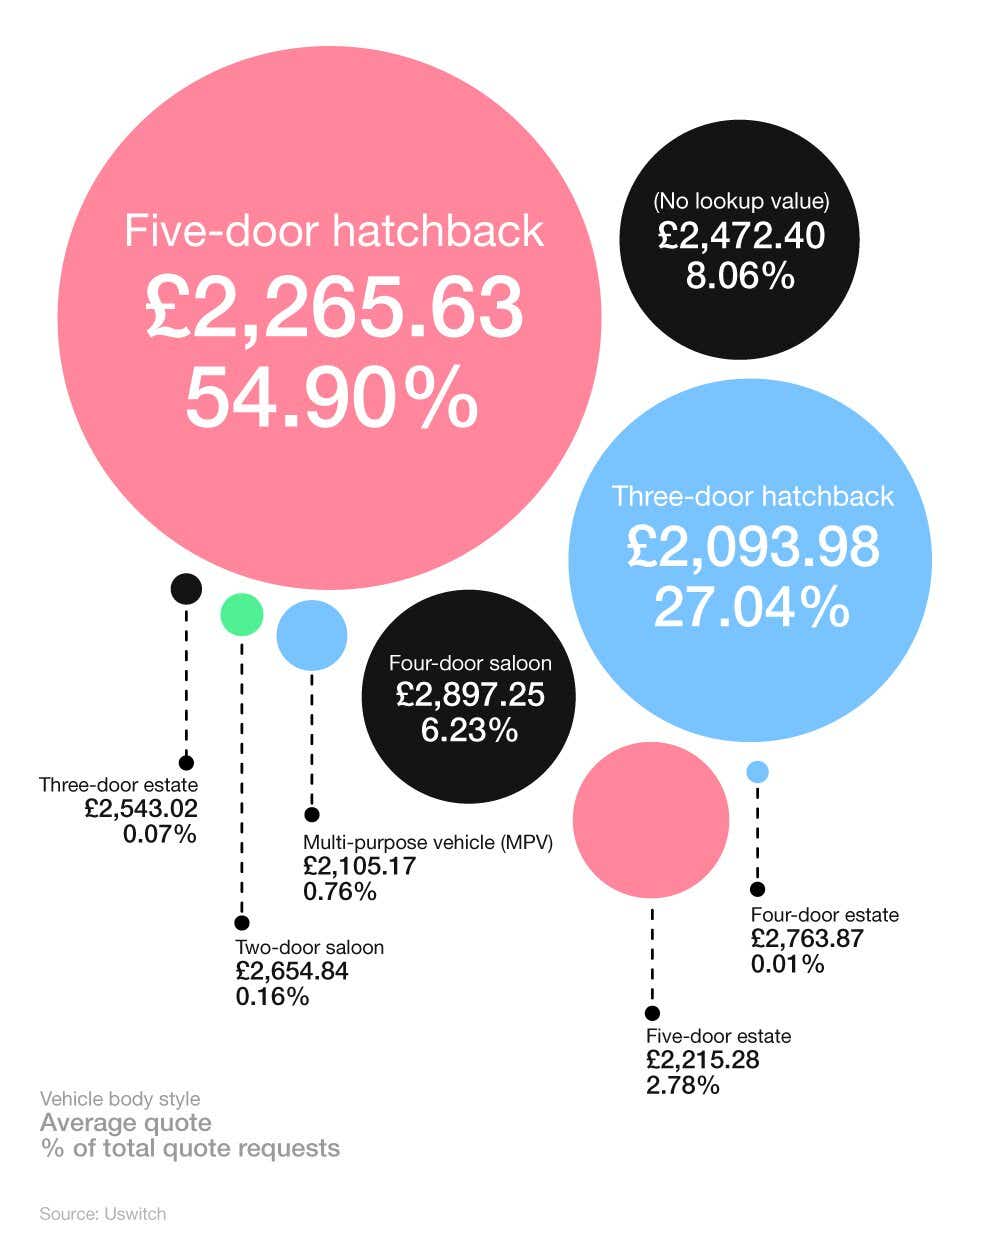
Among the different vehicle body styles, three-door hatchbacks have the lowest median average quote for young driver car insurance at just around £2,093. Their price was close to £12 cheaper per year compared to the next most affordable, multi-purpose vehicles (MPV) at £2,105.
A breakdown of how the average cost of car insurance varies based on car type
| Vehicle body style | Average premium | % of total quote requests |
|---|---|---|
| Five-door hatchback | £2,265.63 | 54.90% |
| Three-door hatchback | £2,093.98 | 27.04% |
| (No lookup value) | £2,472.40 | 8.06% |
| Four-door saloon | £2,897.25 | 6.23% |
| Five-door estate | £2,215.28 | 2.78% |
| Multi-purpose vehicle (MPV) | £2,105.17 | 0.75% |
| Two-door saloon | £2,654.84 | 0.16% |
| Three-door estate | £2,543.02 | 0.07% |
| Four-door estate | £2,763.87 | 0.01% |
(Source: Uswitch)
At the other end of the spectrum, young drivers of four-door saloons could expect to pay £2,897 in 2023-24 – around a third (32.2%) more than a typical young driver of a three-door hatchback. Young drivers of four-door estates can also expect to pay around £2,763 for their car insurance – the second most expensive from our study.
Five-door hatchbacks are the most common type of car amongst new drivers, with over half (54.9%) of quote requests coming for this type of car. Three-door hatchbacks followed closely behind with around one in four (27.04%) quote requests in 2023-24.
On the other hand, relatively few young drivers own a three or four-door estate, occupying just 0.07% and 0.01% of respective quotes between May 2023 and April 2024.
Regardless of the type of car, another factor that will affect the price of car insurance is whether the young driver has opted for comprehensive or third-party insurance.
What is the most expensive brand of car for young drivers insurance?
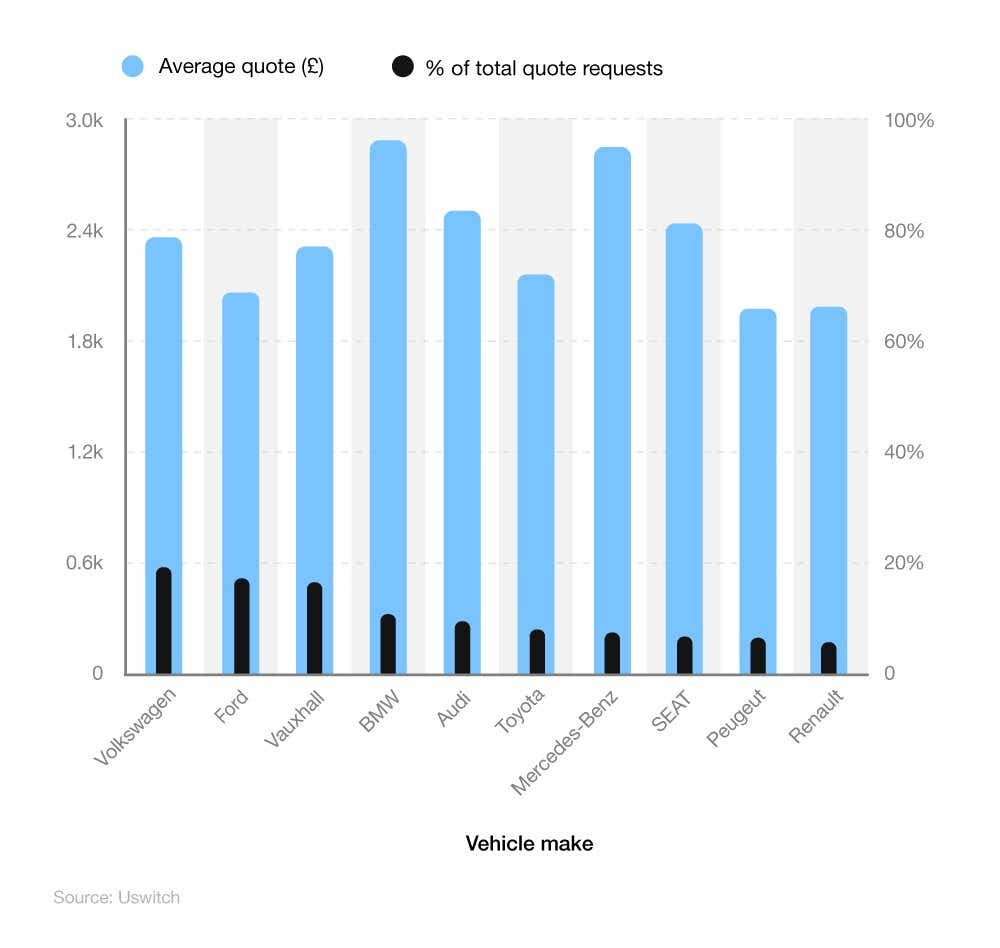
Young drivers of a BMW or Mercedes-Benz can expect to pay the most on their car insurance. Between May 2023 and April 2024, the average insurance cost for new drivers of a BMW was £2,838 – more than a third (35.2%) greater than Peugeot drivers.
A breakdown of the average cost of young drivers insurance by car manufacturer
| Vehicle make | Average premium | % of total quote requests |
|---|---|---|
| Volkswagen | £2,383.49 | 19.39% |
| Ford | £2,150.01 | 17.95% |
| Vauxhall | £2,310.30 | 16.07% |
| BMW | £2,838.46 | 10.92% |
| Audi | £2,504.96 | 8.95% |
| Toyota | £2,209.68 | 6.29% |
| Mercedes-Benz | £2,825.71 | 5.93% |
| SEAT | £2,480.34 | 5.77% |
| Peugeot | £1,988.30 | 4.76% |
| Renault | £2,048.21 | 3.97% |
(Source: Uswitch)
Young Mercedes-Benz drivers can expect to pay an average of £2,825, while Audi drivers could be charged around £2,504 to insure their vehicles. Between May 2023 and April 2024, Mercedes-Benz drivers paid around a quarter (26%) more on their car insurance than the average young driver, with Audi drivers quoted 14% more. Luxury car brands come with higher insurance costs, due to factors like high repair costs and replacement expenses.
On the other hand, our young driver insurance data indicates that Peugeot and Renault represent the most affordable options for young drivers' car insurance. With median average quotes ranging between £1,988 to £2,048, the cheapest car to insure is typically a Peugeot.
Volkswagen was the most popular car with young drivers in 2023-24, gaining almost a fifth (19.39%) of all quotes for the year. This was followed by Ford and Vauxhall at 17.95% and 16.07% respectively.
Better safety ratings and lower repair costs make these cars an attractive proposition for younger drivers. Another factor that can affect the price of insurance is whether or not the vehicle is imported, as this may require a specific import car insurance policy.
For more information, check out the cheapest and best cars for new drivers.
How does the age of a car affect the price of insurance for young drivers?
Our young drivers’ insurance statistics show that newer models of cars tend to yield cheaper average car insurance costs.
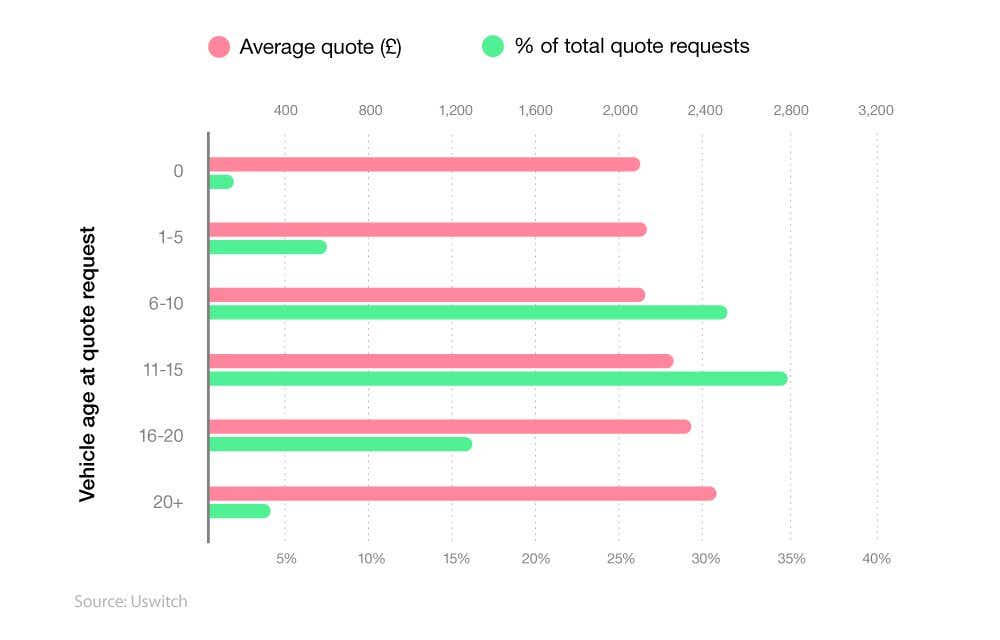
The least expensive car for a young driver to insure is one that is brand new, with cars bought straight from the shop costing an average of £2,119. This is around 15% less than a young driver with a 20-year-old car would expect to pay.
From there, the amount that young drivers pay for their insurance increases incrementally. Cars aged one to five years cost an average of £2,162. This then rises to £2,165 (0.14%) for cars aged six to 10, before increasing again to £2,305 (6.26%) for cars aged between 11-15 years.
A breakdown of how the age of a car affects the price of insurance for young drivers
| Vehicle age at quote request | Average premium | % of total quote requests |
|---|---|---|
| 0 | £2,119.38 | 0.84% |
| 1 - 5 | £2,162.00 | 12.57% |
| 6 - 10 | £2,165.29 | 31.47% |
| 11 - 15 | £2,305.94 | 34.97% |
| 16 - 20 | £2,375.72 | 16.60% |
| 20+ | £2,449.51 | 3.55% |
(Source: Uswitch)
The average cost of car insurance for young drivers continues to rise with vehicle age. Young drivers looking to insure vehicles more than 20 years old can expect to pay around £2,449 a year for their insurance.
Once a car goes beyond 40 years old, the driver can then apply for classic car insurance, which should result in a reduction in the average cost of insurance.
In all, just over a third (34.97%) of quote requests between May 2023 and April 2024 came from drivers of 11-15-year-old cars. Close behind, around three in 10 (31.47%) quotes were from drivers of six to 10-year-old cars. Just 0.84% of young drivers request a car insurance quote for a brand-new vehicle.
Young drivers of cars which are older than ten years would be well advised to get breakdown cover as well.
Do young drivers in education pay more for car insurance than those in work?
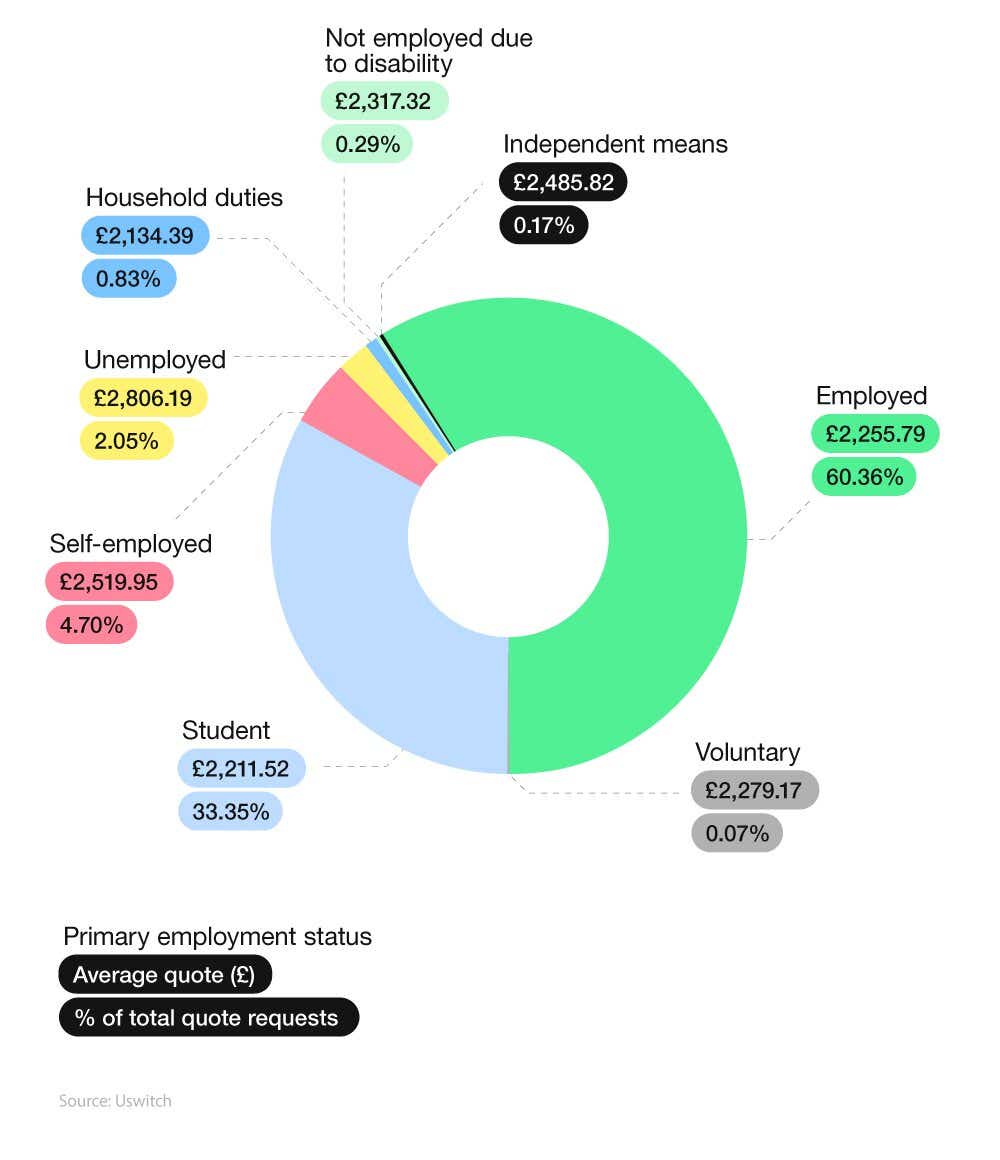
A person’s job title can have a significant impact on car insurance costs. Our data shows that young drivers in full-time education can expect to pay a fraction less on their car insurance (1.97%) than those in full-time employment.
The young drivers who were quoted the most for their car insurance between May 2023 and April 2024 were those unemployed, who can expect to pay around £2,806 for car insurance. However, they make up just 2.05% of the young driver population. This means those young people out of work can expect to pay around a fifth (21.77%) more than young drivers who are in employment.
A breakdown of the average price of car insurance by employment status
| Primary employment status | Average premium | % of total quote requests |
|---|---|---|
| Employed | £2,255.79 | 60.36% |
| Full-time education student | £2,211.52 | 33.55% |
| Self-employed | £2,519.95 | 4.70% |
| Unemployed | £2,806.19 | 2.05% |
| Household duties | £2,134.39 | 0.83% |
| Not employed due to disability | £2,317.32 | 0.29% |
| Independent means | £2,485.82 | 0.17% |
| Voluntary | £2,279.17 | 0.07% |
(Source: Uswitch)
In 2023-24, the majority of our quote requests came from young drivers who were in full-time employment, making up three-fifths (60.36%) of all quote requests for the year.

This was followed by young drivers who were in full-time education. Despite making up around a third (33.55%) of all quote requests, this was half the number compared to young drivers who were in full-time employment who sought a quote.
Self-employed drivers made up close to one in 20 (4.7%) of all quotes requested in 2023-24.
Which occupation of young drivers pay the most for car insurance?
Statistics about young drivers indicate that unemployed young people tend to be quoted the highest amount on their car insurance. With an average of £2,806, this is almost a third (31%) more than young drivers who work in middle-class occupations.
A breakdown of the average cost of young drivers car insurance by job type
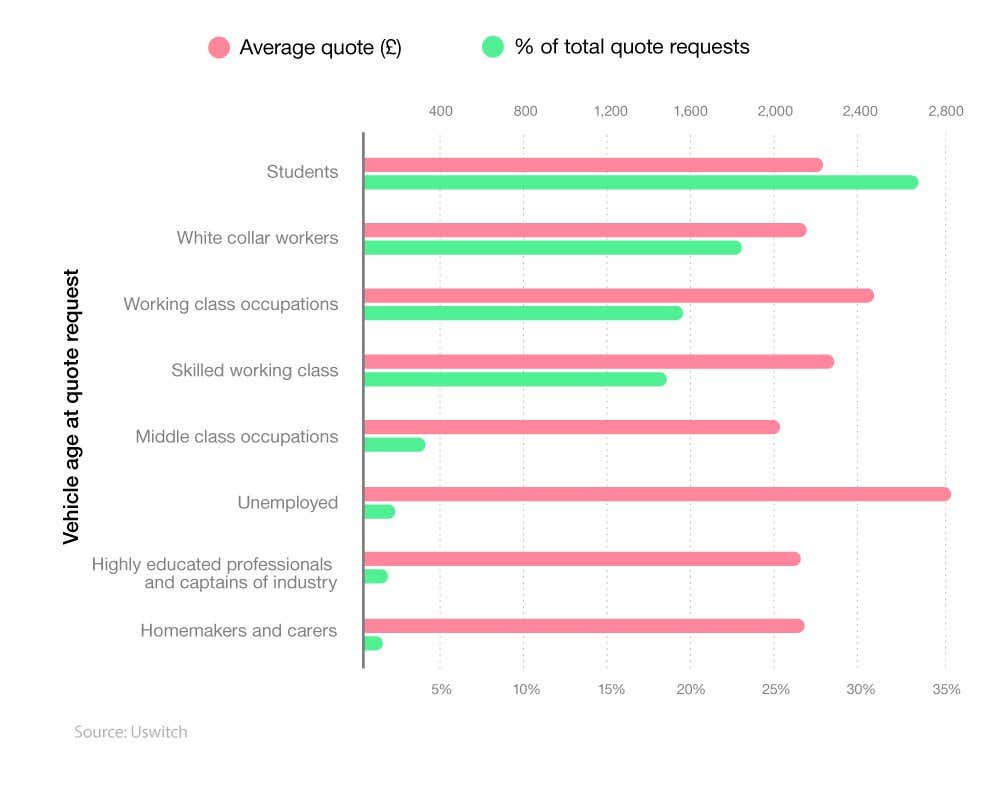
| Primary occupation category | Average premium | % of total quote requests |
|---|---|---|
| Students | £2,211.49 | 33.55% |
| White collar workers | £2,118.79 | 23.05% |
| Working class occupations | £2,432.61 | 19.70% |
| Skilled working class | £2,318.48 | 18.02% |
| Middle-class occupations | £2,053.87 | 4.22% |
| Unemployed | £2,806.19 | 2.05% |
| Highly educated professionals and captains of industry | £2,155.31 | 1.59% |
| Homemakers and carers | £2,166.30 | 0.95% |
(Source: Uswitch)
Typically, young drivers from middle-class occupations pay the least for their car insurance, with average costs of around £2,053. This is approximately 3% less compared to the typical worker from the white-collar industry.
In terms of number of quotes, a third (33.55%) of requests between May 2023 and April 2024 came from students. Part of the reason why they could get less expensive insurance was that they could apply for specialist student car insurance.
The next highest was white-collar workers, who made up one in four (23.05%) of quote requests in 2023-24.
How does the age of young drivers affect how much they will pay?
According to UK car insurance statistics, young drivers tend to pay more for their car insurance than their more experienced counterparts. But how much does the amount a young driver can expect to pay change as they get older?
17-year-olds are quoted less on their car insurance than 18-year-olds. Young drivers who are 18 were quoted, on average, around £100 more than drivers who are a year younger.
A breakdown of the average cost of young drivers insurance by age
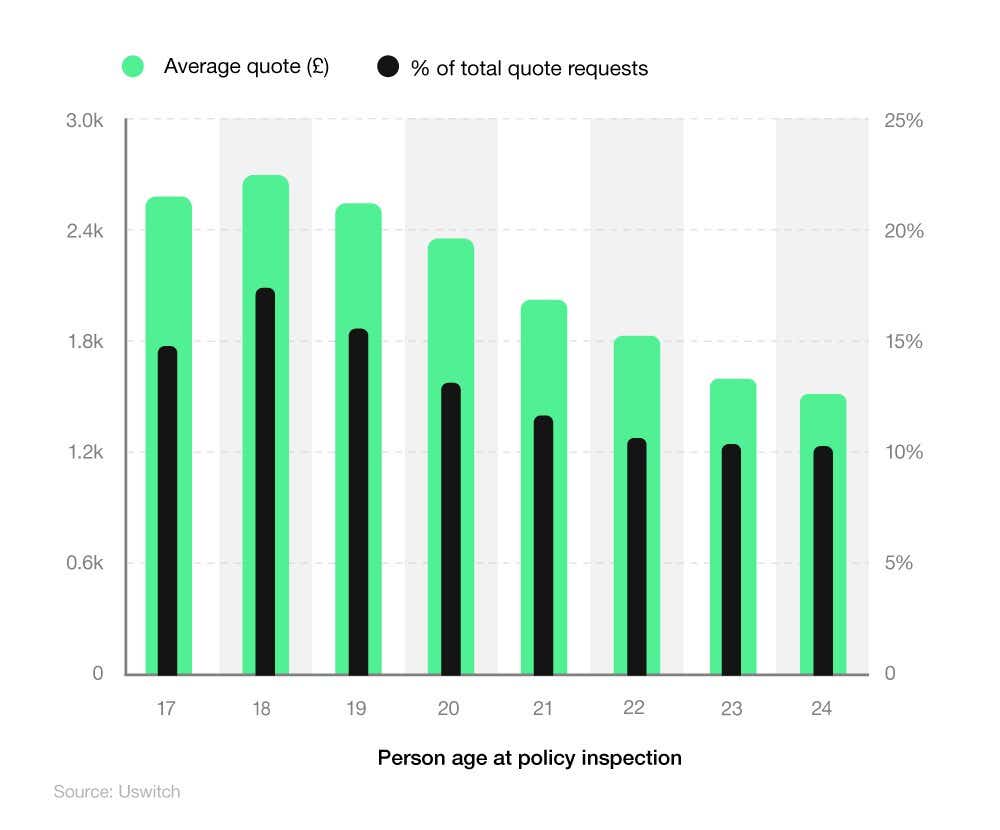
| Person age at policy inception | Average premium | % of total quote requests |
|---|---|---|
| 17 | £2,624.63 | 14.78% |
| 18 | £2,737.54 | 17.38% |
| 19 | £2,545.16 | 15.59% |
| 20 | £2,376.15 | 13.65% |
| 21 | £2,093.25 | 12.19% |
| 22 | £1,828.33 | 10.81% |
| 23 | £1,666.66 | 10.27% |
| 24 | £1,534.37 | 10.16% |
(Source: Uswitch)
Statistics about the average cost of car insurance by age indicate that for 19-year-olds, the amount they are quoted for dips slightly lower, to £2,545. The median average quote for young driver car insurance then continues to go down as drivers become more experienced.
Between 18-24, young drivers can expect their car insurance costs to decrease by almost three-fifths (56%) in the space of six years behind the wheel. The price will decrease even more if a driver doesn’t use their no-claims bonus.
We found that 19-year-olds put in the most quote requests, at 17.38%. However, they were quoted only 4.22% more, on average, than those aged 17.
How does payment method affect the price of car insurance for young drivers?
When it comes to monthly vs. annual car insurance payments, insurance companies typically charge less to customers who pay a year up-front, as opposed to month-by-month instalments. This is because paying annually involves an upfront payment with no added extras. By paying monthly, someone is shouldering the cost of the policy that allows you to pay bit-by-bit, which often leads to interest charges over the year.
A breakdown of the average cost of young drivers insurance by payment method
| Payment method | Average premium | % of total quote requests |
|---|---|---|
| Annual | £2,078.15 | 51.55% |
| Monthly | £2,457.58 | 48.45% |
(Source: Uswitch)
According to our data, young drivers could save almost £400 by paying their car insurance in one annual payment, with an average annual cost of £2,078 around 16% lower than the annual costs for those who pay monthly (£2,457).
This is perhaps the reason why just over half (51.55%) of quote requests in 2023-24 came from young drivers looking to pay annually, in comparison to 48.45% who took the monthly option.
Choosing the best insurance package for you and your car can be a minefield. That’s why we recommend reading one of our car insurance guides to give you a better idea of what you need.
Driving habits of young drivers
Data from the Department for Transport (DfT) shows that, in February 2024, around 2.8 million young males held a driving licence, compared to approximately 2.52 million young females. This means there are potentially around 11% more males aged 17-29 on UK roads compared to females of the same age bracket.
*The traditional definition of a young driver is someone aged 17-24. However, as the DfT classifies drivers into age groups of 17-20 and 21-29, both have been included for the purpose of this data analysis.
Differences in driving habits between young male and female drivers
As of February 2024, there were approximately 500,000 young male drivers in the UK aged 17-20 with a driving licence – around 80,000 more than females of the same age.
Similarly, there were around 2.3 million male young drivers aged between 21-29, resulting in a total of around 2.8 million males under the age of 30 with a full UK driving licence, as of February 2024. This represents around 200,000 more than the number of UK female drivers aged 17-29.
A breakdown of driving licence statistics for young males over time
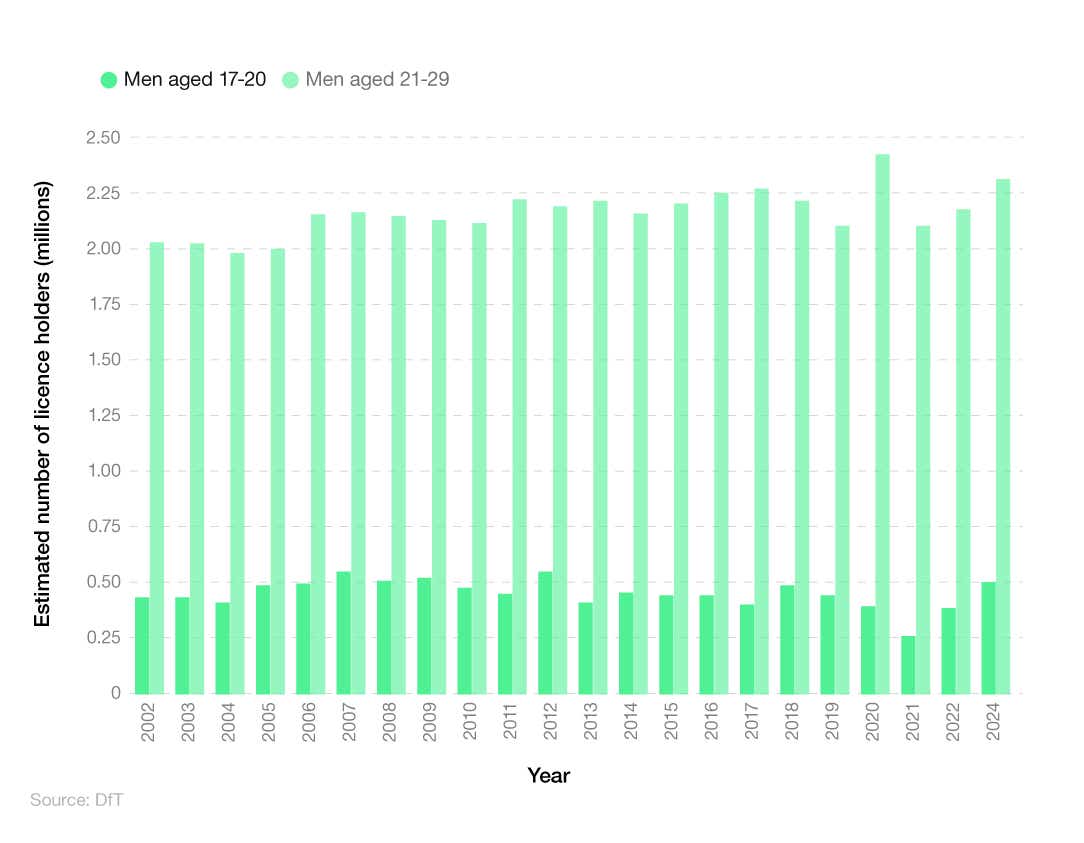
Since 2002, the number of young male drivers in the UK has fluctuated. Back in 2004, there were 2.36 million male drivers under the age of 29. By 2020, this figure had reached a peak of around 2.78 million – an increase of almost a fifth (+17.8%).
A breakdown of driving licence statistics for young females over time
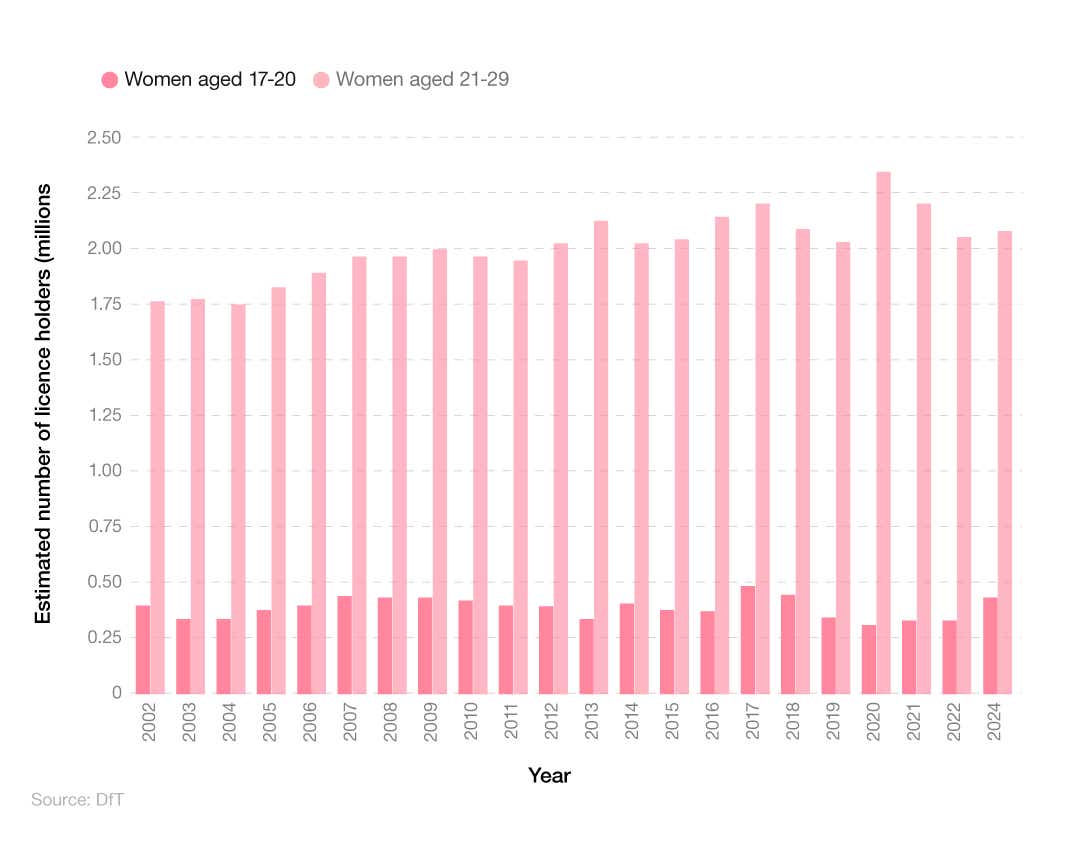
As of February 2024, there were approximately 2.5 million young female drivers aged 17-29 in the UK.
Since 2002, the number of young female drivers in the UK has fluctuated, between the low of 2004 (when there were 2.05 million female drivers under the age of 29) and the high of 2020 (when the corresponding figure was almost 2.66 million). This means there are almost a quarter (23%) more young female drivers on UK roads in 2024 compared to 2004.
A breakdown of UK driving licence statistics for the percentage of young male drivers over time
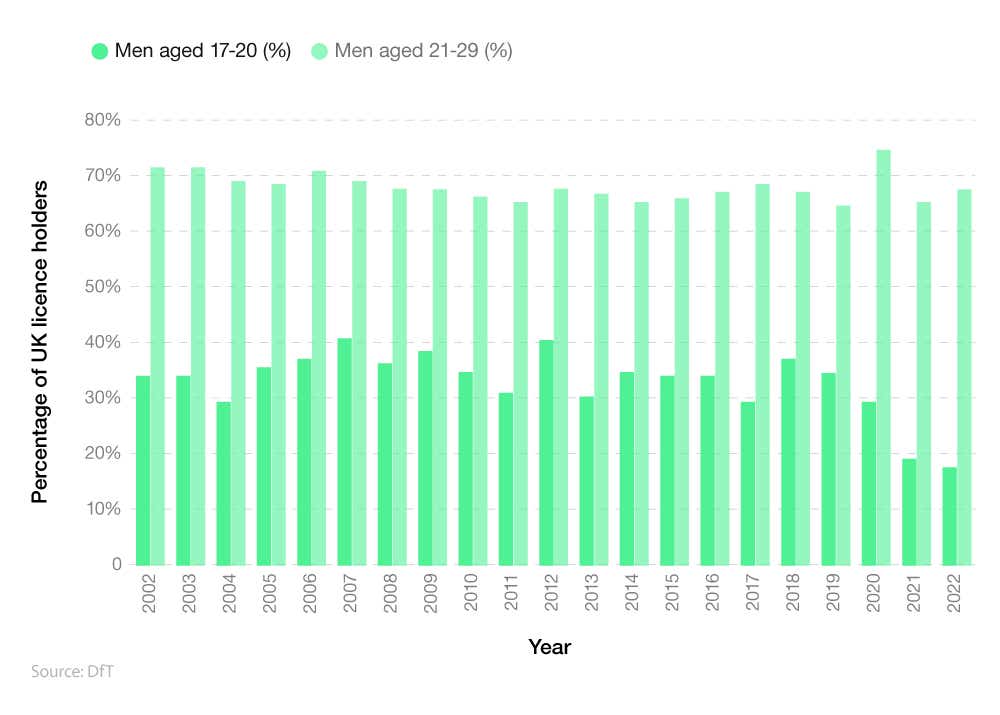
As of 2022, more than a quarter (27%) of UK males aged 17-20 held a full driving licence. This figure jumped to more than two-thirds (68%) for those aged 21-29.
This is a noticeable decrease from 1975-76, when just over a third (36%) of men aged 17-20, and approximately three-quarters (78%) of those between 21-29, had a driving licence.
The percentage of young UK men holding a driving licence has fluctuated in the past decades. This reached a peak in 1992-94 when more than four in five (83%) of those aged 21-29 had a UK driving licence. It was also at this point that more than half (55%) of the UK male population aged 17-20 could also drive – only the third year on record where this figure rose above 50%.
A breakdown of UK driving licence statistics for the percentage of young female drivers over time
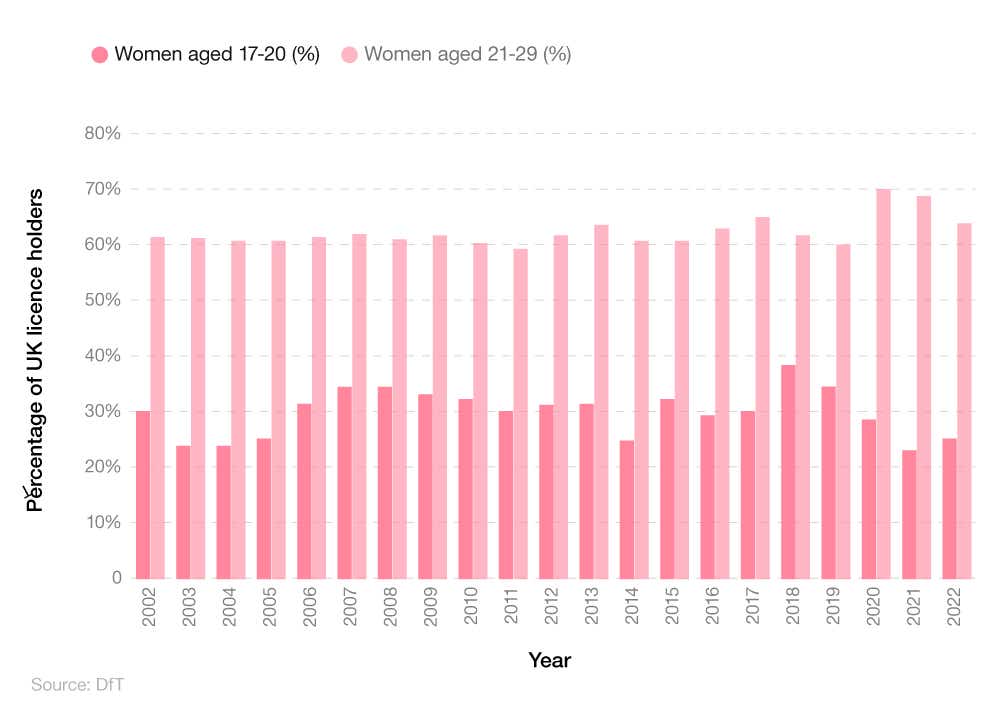
As of 2022, just over a quarter (26%) of females in the UK aged 17-20 held a driving licence, with just a corresponding figure of just under two-thirds (64%) for the UK’s 21-29 female population.
This represents a significant increase from 1975-76, when just one in five (20%) women aged 17-20 had a driving licence, and approximately two in five (43%) of those between 21-29 were able to drive – both the lowest figures on record.
After multiple years of fluctuations, the percentage of young female drivers aged 17-20 reached a peak in 2018, when almost two in five (38%) of women in this age group held a driving licence. That said, 2020 saw the largest percentage, to date, of women aged 21-29 who were eligible to drive (70%).
UK male versus female driving statistics also suggest that young male drivers tend to drive more often and further than female drivers. In 2013, young male car drivers travelled an average of 4,432 miles whereas young female car drivers travelled an average of 3,453 miles.
Vehicle and licence ownership statistics of UK young drivers
According to a report from Ipsos, around one in five (21%) young drivers in the UK don’t own a vehicle.
A breakdown of UK young driver vehicle ownership statistics
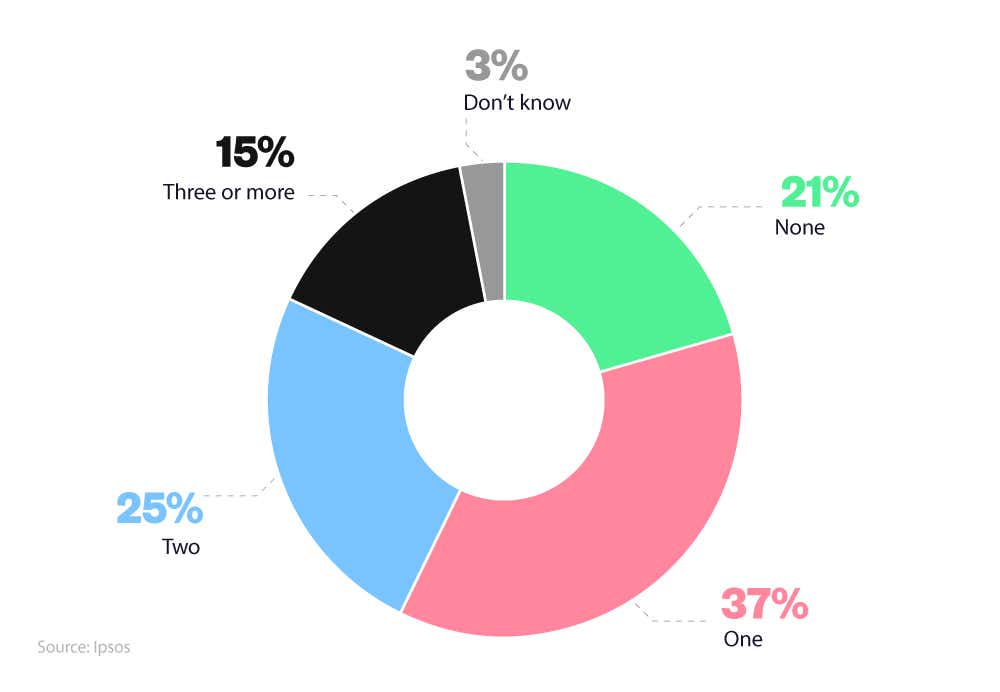
The report also found that:
Around two in five (37%) drivers aged 17-24 own one vehicle
One in four (25%) own two vehicles
Less than one in six (15%) own three or more vehicles.
A breakdown of UK young driver licence ownership statistics
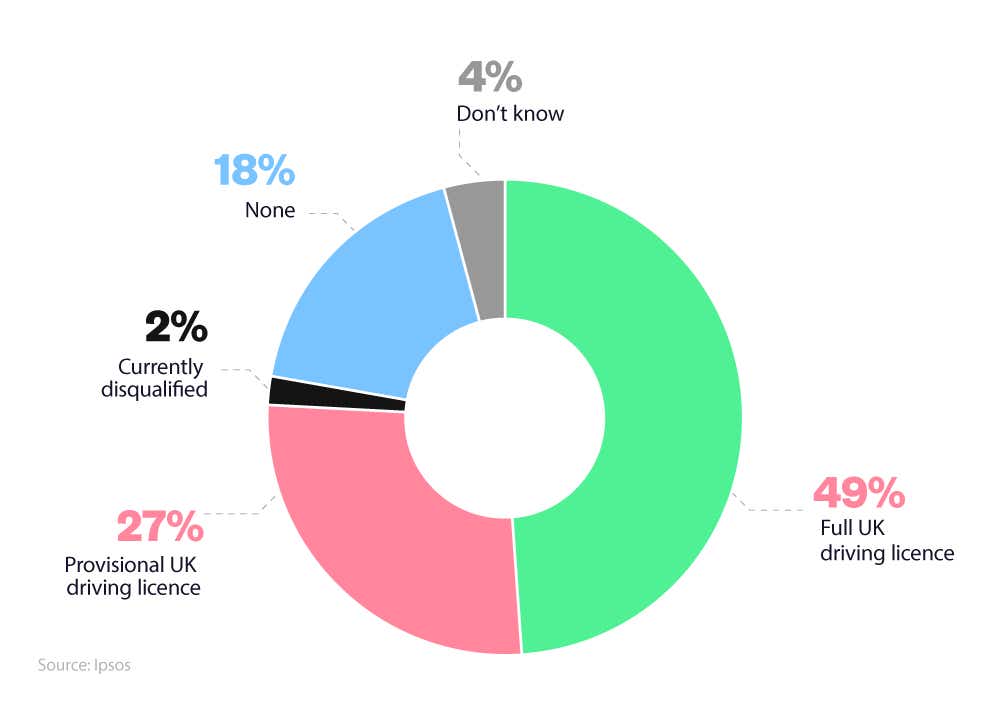
According to Ipsos survey data, just under half (49%) of those aged 17-24 surveyed held a full UK driving licence.
Just over a quarter (27%) of UK young drivers have a provisional driving licence, with less than a fifth (18%) having no licence at all.
Frequency of driving for UK young drivers
The Ipsos young drivers statistics report also suggests that more than a quarter (28%) of those aged 17-24 drive their vehicle(s) at least five days a week.
A breakdown of how often UK young drivers use their vehicle(s)
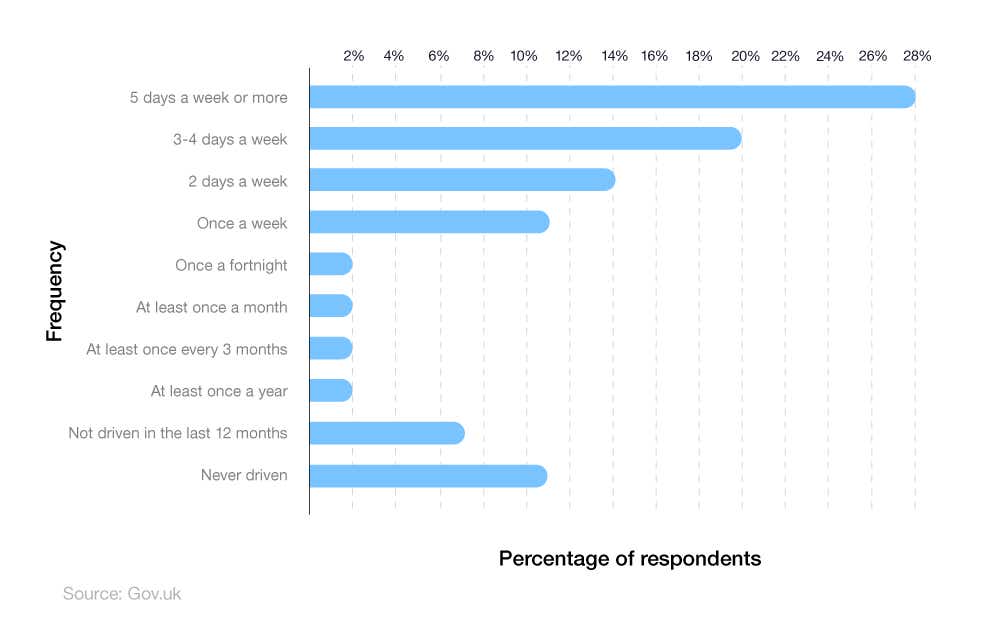
Around a fifth (20%) of young drivers use their vehicle(s) between three and four days a week, with around one in 10 (11%) admitting a driving frequency of just once a week.
Incidentally, a similar percentage (11%) of those surveyed had never driven their vehicle since passing their test, and 7% had not driven within the last 12 months.
What time of the day are young drivers mostly on the road?
Unlike older drivers, young drivers will spend more of their time driving at night. Statistics about young drivers show that 6% of all miles driven by under-24s happen at night, compared to 3% for older drivers.
Across all age groups, most driving occurs during the day, with 97% of all miles driven between the times of 5 am and 9:59 pm. Young drivers are no exception to this.
Around half of drivers aged 17-24 use their car to commute to work, with a further 10% using it to get to their place of education, whether that be school, college or university.
A breakdown of the most common times of the day drivers are on the road in England
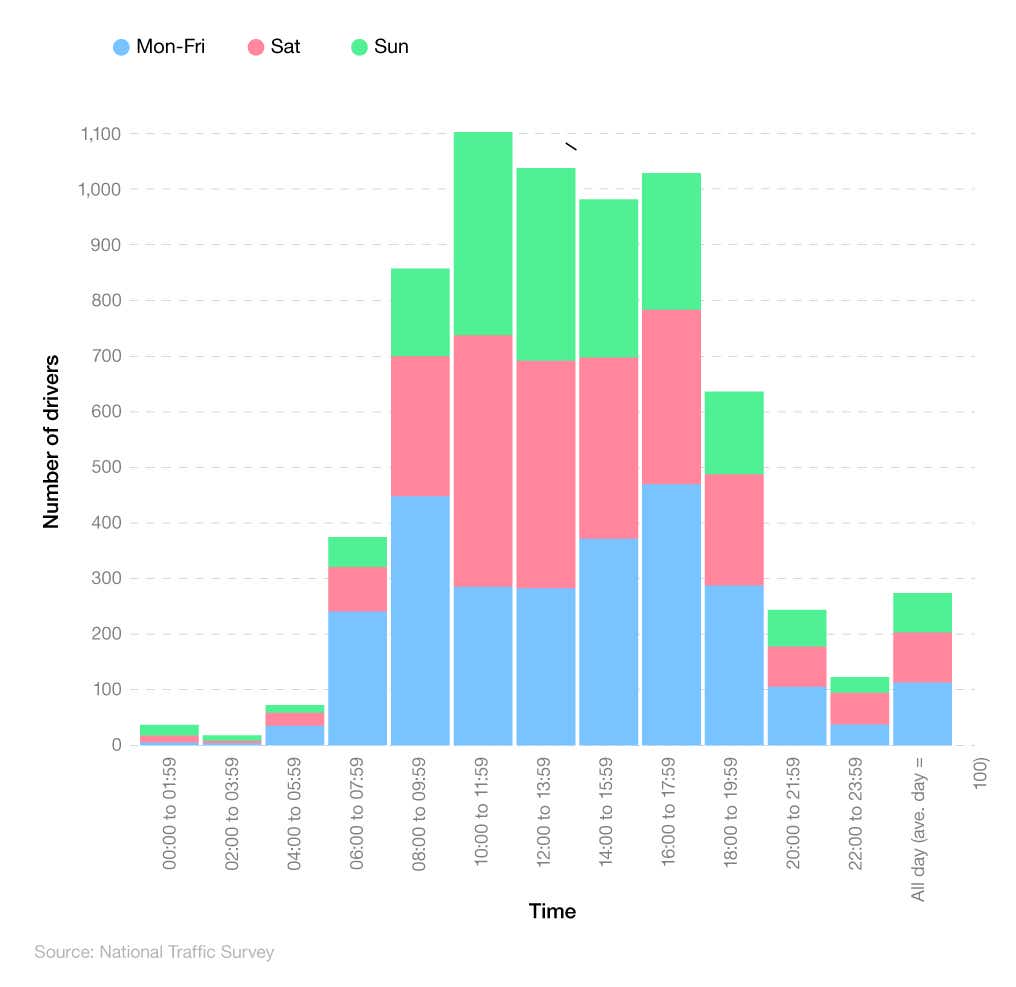
Note: The data shows how the number of trips in progress changes throughout the day across England. The data is represented as an index, comparing the number of trips per hour to the average number of trips per hour (represented as an index score of 100). Therefore, a score of 200 means there are double the number of trips that hour compared to the average.
According to driving statistics from the government’s National Traffic Survey, the majority of journeys on English roads take place during the week (i.e. Monday to Friday), with around a third less driving taking place on Sunday compared to the daily average.
In 2022, the most common time of day for drivers to be on English roads was between 4 pm and 5.59 pm during the week, with 4.7 times more traffic compared to the daily average. At weekends, the busiest time was between 10:00 and 11:59 on Saturdays, when there were about 4.6 times more vehicles compared to the daily average.
Speeding statistics for young drivers
National Safety Council (NSC) data shows that males under 24 are around one-and-a-half times more likely to be involved in a fatal crash while speeding compared to females of the same age.
Around a third (33%) of males aged 17-24 are typically involved in fatal collisions while driving too fast compared to around a fifth (20%) of female drivers under 24.
A breakdown of the percentage of speeding drivers in fatal crashes by age and gender
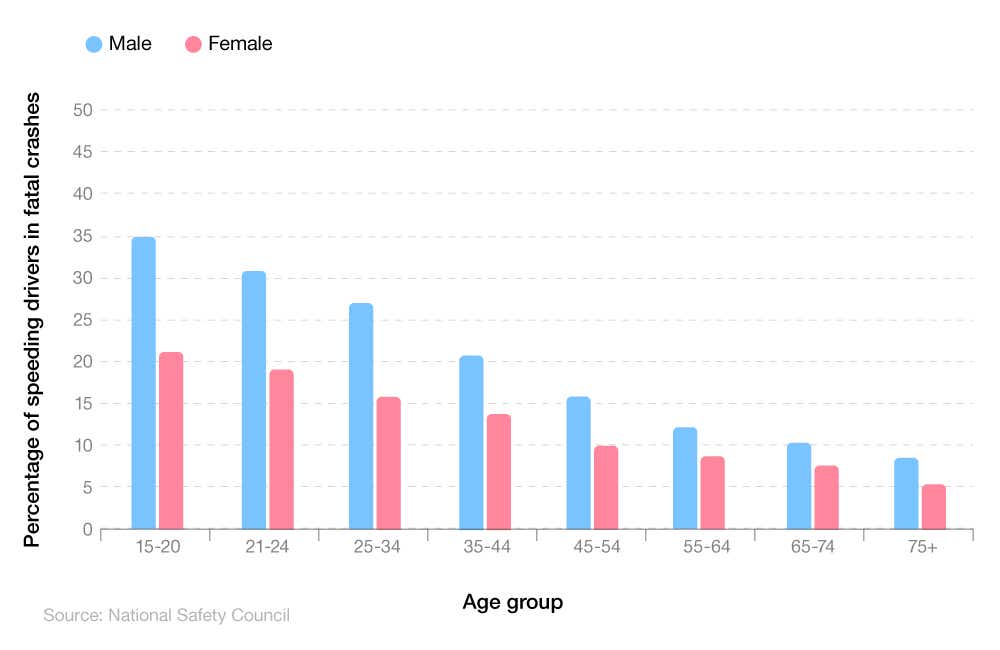
Generally speaking, as drivers get older and more experienced, the chance of them being involved in a fatal collision while speeding reduces. Young male drivers aged 15-20 are almost four-and-a-half times more likely to be involved in a fatal collision at speed compared to those aged 75 and above (35% vs. 8%, respectively).
Similarly, female drivers aged 15-20 are around four times more likely to crash at speed leading to a fatality than females aged 75+ (19% vs. 5%).
A breakdown of speeding statistics involving alcohol across age groups
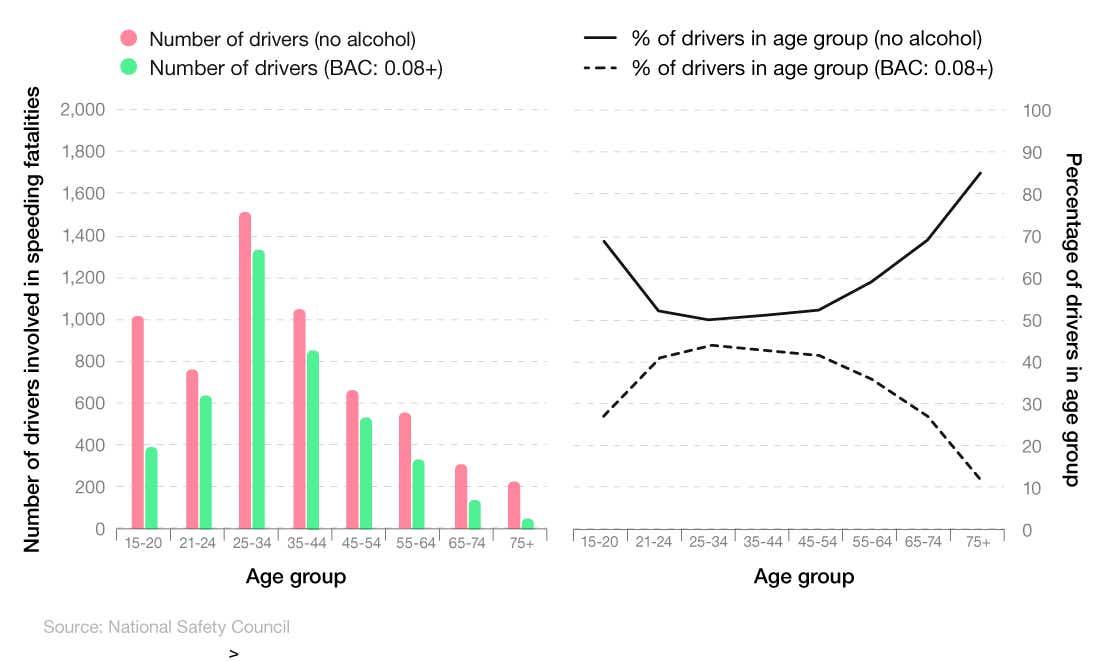
According to speeding statistics from the National Security Council, young drivers (i.e. those under 24) are the second most likely group to be involved in a fatality at speed while under the influence of alcohol.
In 2022, there were 4,185 recorded incidents of speeding involving alcohol, of which almost a quarter (24.2%) involved a young driver, with almost a third (32.1%) of offenders in the 25-34 age bracket.
As a percentage of their age group, over a quarter (27%) of those aged 15-20 involved in a speeding offence in 2022 had a blood alcohol content (BAC) of 0.08+, compared to more than two-fifths (41%) of those aged 21-24.
Conversely, there were 6,059 non-alcohol-related speeding offences recorded in the UK in 2022 by the National Safety Council. Of these, young drivers were the most common offenders, accounting for 1,795 incidents of speeding not under the influence of alcohol. This equated to almost a third (29.6%) of total offences for the year, and 4.7% more than those aged 25-34 (24.9%).
As a percentage of their age group, around seven in 10 (68%) young drivers aged 15-20 involved in speeding fatalities were not alcohol-impaired, compared with just over half (53%) of those aged 21-24.
UK young driver accident statistics
In 2021, there were 78 young car driver deaths. This made up 16% of all deaths on UK roads. This is even though around 7% of drivers are under 24, effectively meaning that they are twice as likely to die in a road accident as older drivers.
UK young driver accident statistics by the severity of the accident
As of 2022, the number of young drivers killed on UK roads has increased by almost a third (29.5%). The percentage of those seriously injured has risen by around 5%, with those receiving slight injuries during a road traffic accident increasing by 0.7%.
Overall, between 2021-22, the percentage of young drivers involved in an accident has increased by 1.6%.
A breakdown of young driver accident statistics in the UK (casualties involving younger drivers vs all car drivers)
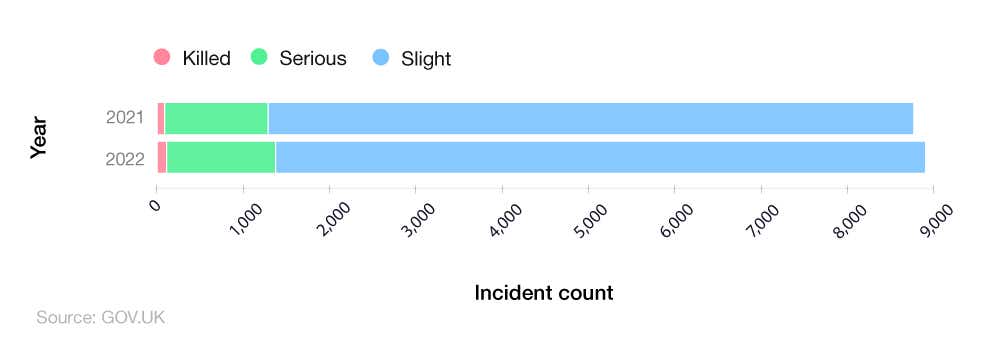
In total, around one in five (19%) drivers killed on UK roads in 2022 were young drivers – a 3% rise from the previous year.
A breakdown of young driver accident statistics in the UK (collisions involving younger drivers vs. all car drivers)
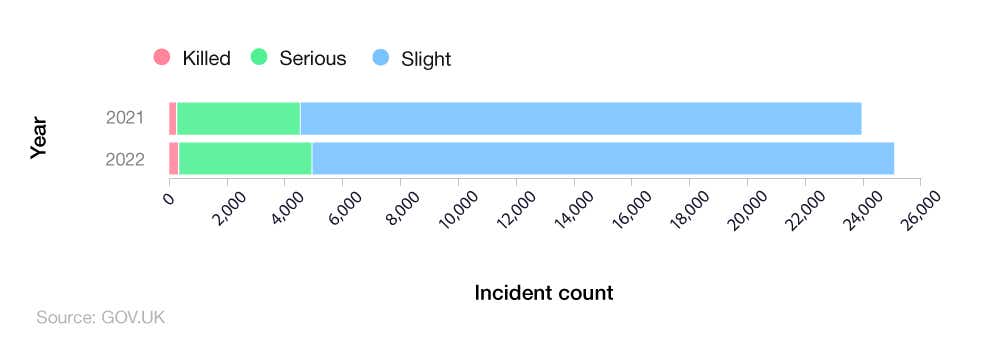
UK young driver accident statistics reveal that around a quarter (24%) of all collisions in 2022 that resulted in a death involved a younger driver behind the wheel – a 3% increase on 2021 figures.
UK government figures also reveal that around one in five road collisions in 2022 involving young car drivers resulted in serious or slight injuries (20% vs 21%, respectively).
That said, between 2021-22, the number of reported collisions on UK roads involving drivers aged 17-24 increased by:
More than a quarter (27.6%) of those resulting in death
Around 7.9% of those involving serious injuries
Almost 3.8% for those with slight injuries.
A breakdown of young driver accident statistics over time compared to all casualties
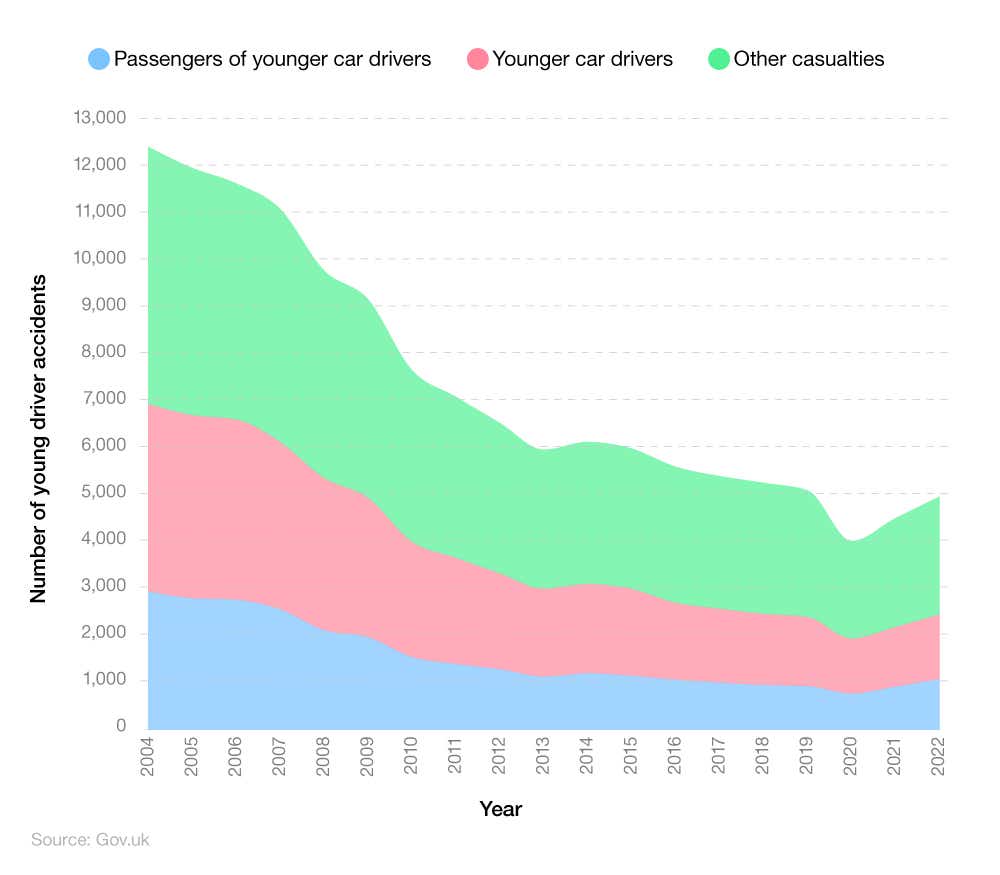
As of 2022, there were 4,935 reported casualties on UK roads. Just over a quarter of these (27.7%) involved younger car drivers, with just over a fifth (21.8%) resulting in injuries to passengers of younger drivers.
Fortunately, the UK has seen a decrease in young driver accidents since 2004, when 12,333 casualties were recorded on UK roads – a reduction of three-fifths (60%) in the previous 18 years.
While the number of reported accidents in the UK involving younger car drivers also reduced by around two-thirds (65.6%) in the same period, the reported figure of 1,365 in 2022 was still 200 more than the low of 1,165 casualties in 2020.
What percentage of accidents are caused by young drivers?
Up to one in five drivers (20%) could have a major or minor crash within a year of passing. However, as young drivers become more competent their likelihood of being in an accident does reduce.
With more accidents, there are more claims. Young drivers under 25 have a claim rate that’s more than a quarter (27%) higher compared to drivers over 25. On top of this, one in five accidents involving young adults has an injury claim, meaning that almost a third (30%) of all claims are made by under-24s.
A breakdown of young driver KSI (Killed or Seriously Injured) casualty statistics over time (passengers of younger drivers vs. younger car drivers)
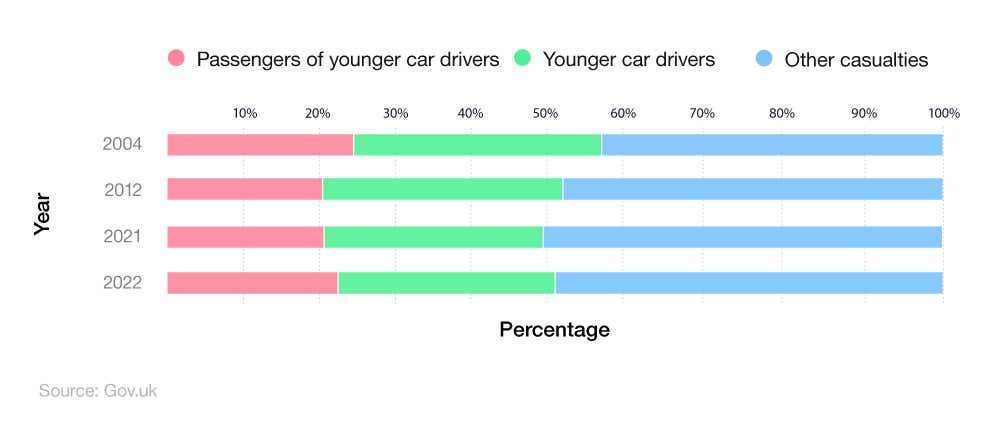
As of 2022, young driver casualty statistics reveal that around a fifth (22%) of accidents on UK roads involve people as the passengers of younger car drivers. This represents a 2% rise from 2021 figures, but a 2% decrease from 2004.
Casualties involving younger car drivers themselves in 2022 stood at just over a quarter (28%) – a figure that has seen a 4% drop since 2004.
In all, approximately half (50%) of reported UK road casualties in 2022 involved people over the age of 24 (i.e. those not considered young drivers).
When do most road accidents occur for young drivers?
As of 2022, there were 346 recorded accidents on UK roads at 5pm on a weekday, making it the most common time for a young driver to be involved in an accident. This equated to 8.8% of all reported weekday accidents for the year.
That said, other notable times when accidents were more likely to occur in 2022 were:
7pm on a Saturday (6.3% of accidents)
11pm on a Saturday night (6.9% of accidents)
Midnight on a Saturday (6.3% of accidents).
A breakdown of the total UK road accidents by hour and day of the week (2022)
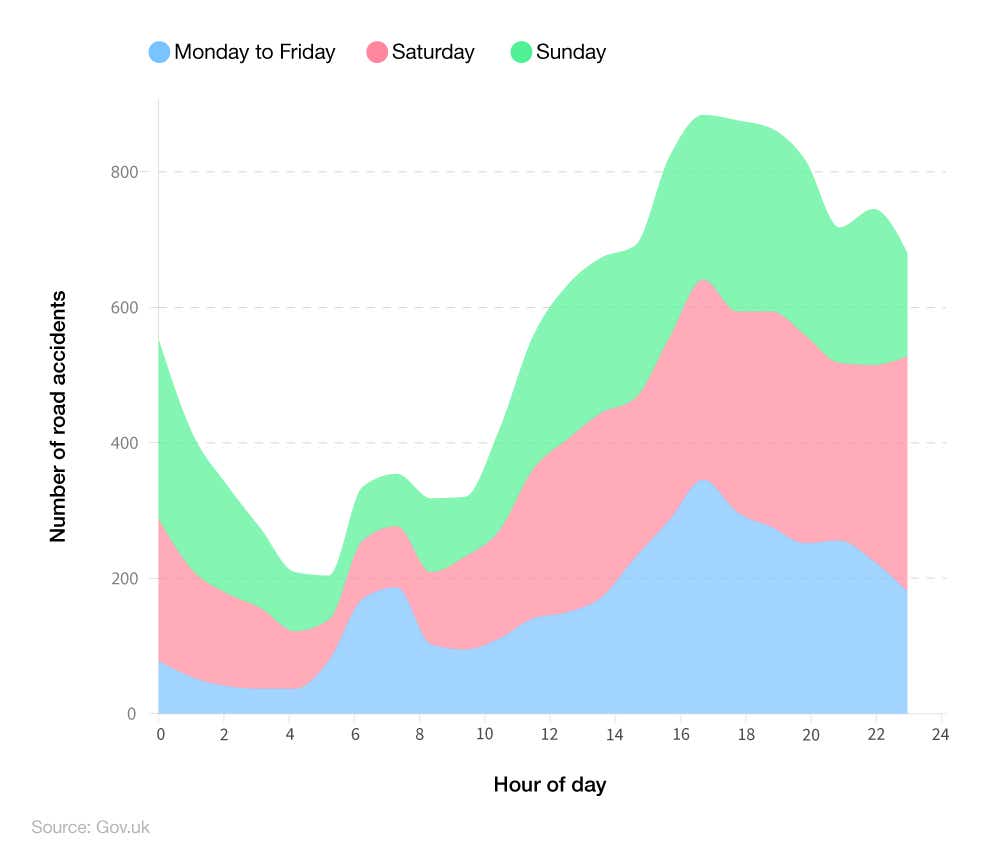
Statistically, young drivers are more likely to be involved in an accident on a Saturday than any other time of the week. In 2022, more than 5,000 accidents were reported at some point on a Saturday – around a tenth (11.7%) more than Sundays and almost a quarter more (24.9%) more than midweek.
On the other hand, the least likely time for accidents to occur on UK roads in 2022 was between 4am and 5am on a Monday-Friday (0.09%). By contrast, the lowest chance of accidents for young drivers at weekends fell around 6am (1.19%).
Where do most road accidents happen for young drivers?
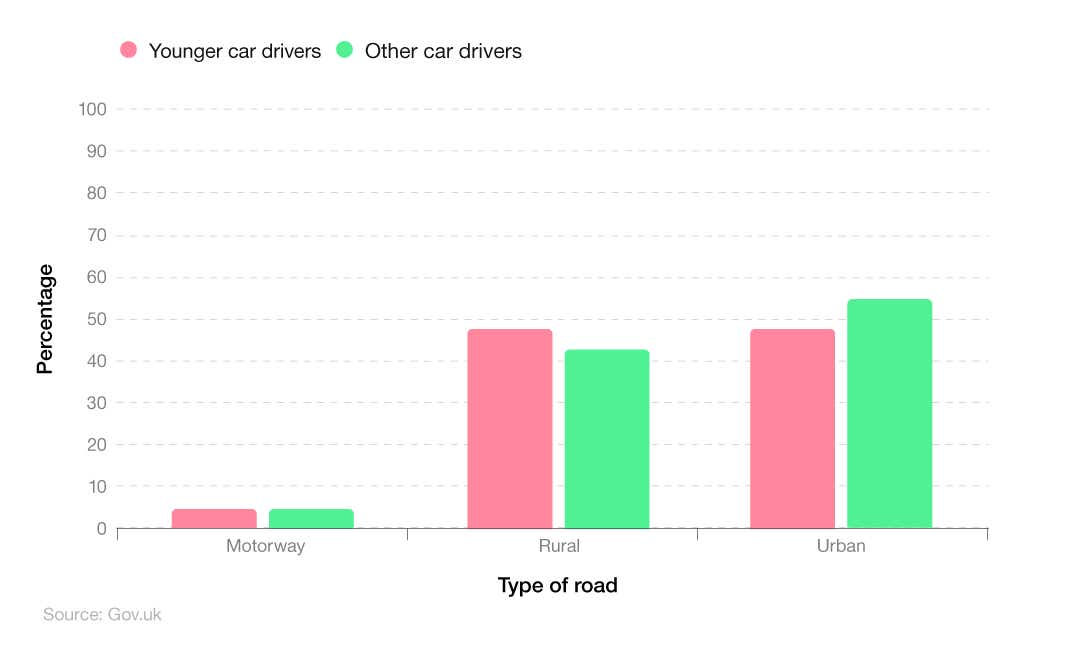
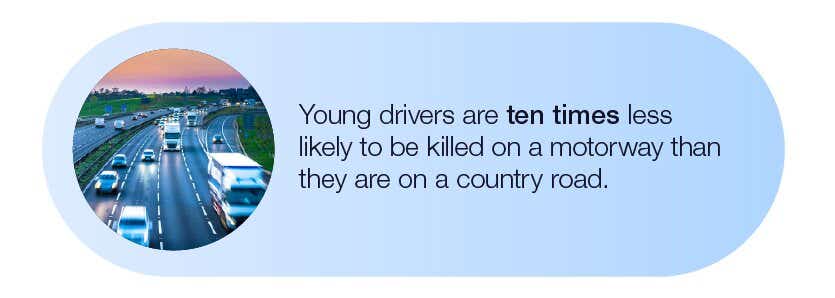
Young drivers are ten times less likely to be killed on a motorway than they are on a country or urban road, where the figure jumps to almost half (48%) for both.
Incidentally, UK drivers aged 25+ are 7% more likely to be killed on an urban road compared to those aged 17-24, yet 6% less likely on rural roads by comparison.
A breakdown of the percentage of KSI accidents occurring by age and setting
Our research into the young driver accident statistics available found that a critical mass of young drivers are apprehensive about using motorways. More than four in 10 (41%) young people say they knew friends who were so nervous about using motorways, they refused to drive on them.
Just 7% of young drivers also admitted that they avoided driving on motorways, compared to just 4% of over-65s.
Despite their fears about driving on motorways, road accident statistics suggest they are the safest type of road around for both older and younger drivers. Young driver death statistics show that just 4% of KSI (killed or seriously injured) casualties involving young drivers occur on the motorways.
A breakdown of young driver accident statistics vs. other drivers (based on type of junction)
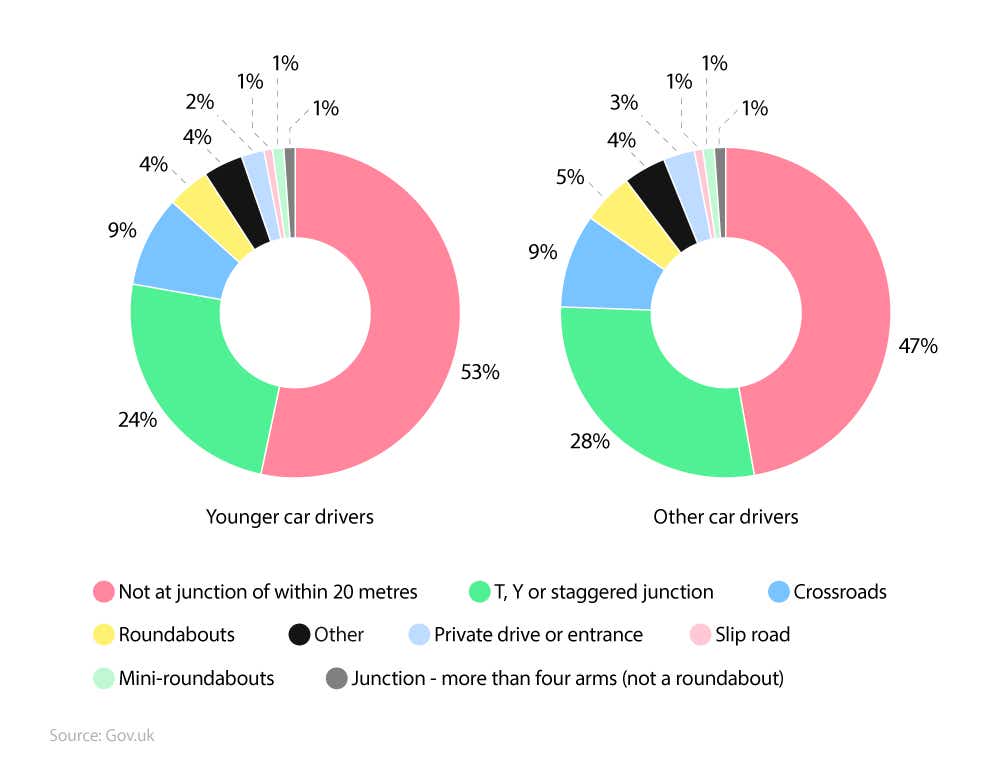
Young driver accident statistics show that most accidents for drivers aged between 17-24 happen not at a junction within 20 metres, with just over half (53%) of all accidents for this age group occurring here. This figure is 6% lower for all other drivers.
Just under a quarter (24%) of young driver accidents occur at a T, Y, or staggered junction, with less than one in 10 (9%) happening at a crossroads.
Incidentally, drivers aged 25+ are 4% more likely to have an accident at a T, Y, or staggered junction than their younger counterparts.
A breakdown of the most common reasons for young people’s accidents in the UK
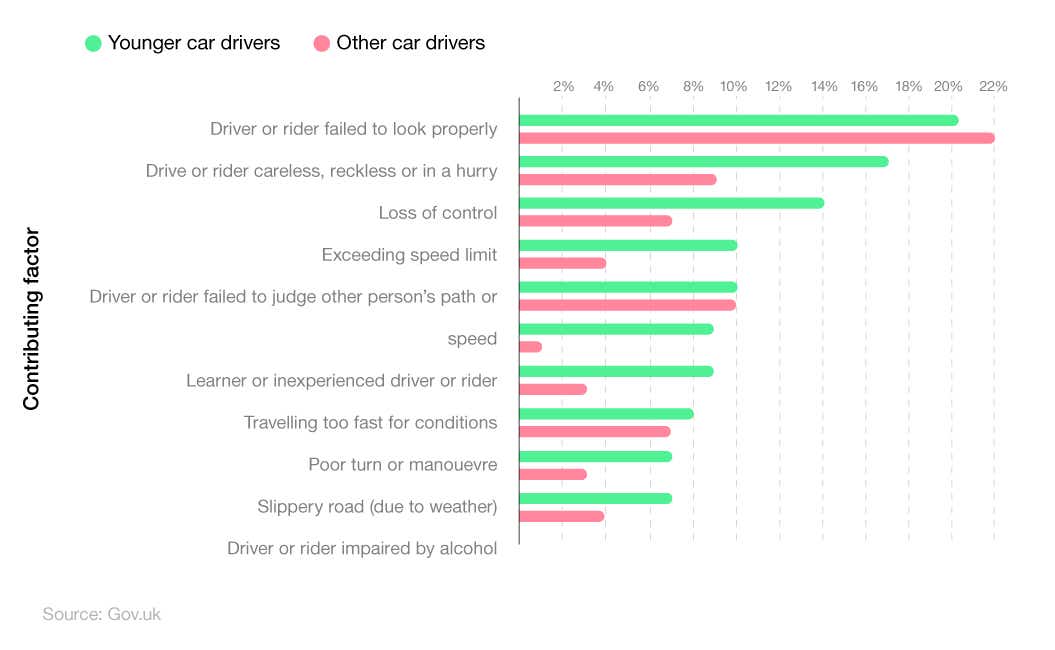
The young driver accident statistics data shows that the most common reason why people aged 17-24 have an accident while driving is that the driver/rider failed to look properly. This happened in around a fifth (20%) of accidents reported in 2022.
Younger drivers are around twice as likely to be involved in an accident due to careless/reckless driving, or because they are in a hurry compared to other drivers (17% vs. 9%, respectively).
Similar ratios are also displayed for loss of control while driving (14% vs. 7%) and exceeding the speed limit (10% vs. 4%).
Most common traffic offences by young drivers
Traffic offence statistics indicate that, in 2022, there were more than 128,000 recorded incidents of young drivers exceeding the speed limit on a public road. This was the most common traffic offence for UK young drivers in 2022 and accounted for almost two-fifths (38.87%) of all traffic offences involving this age group.
A breakdown of the top 10 traffic offences made by young drivers in Britain
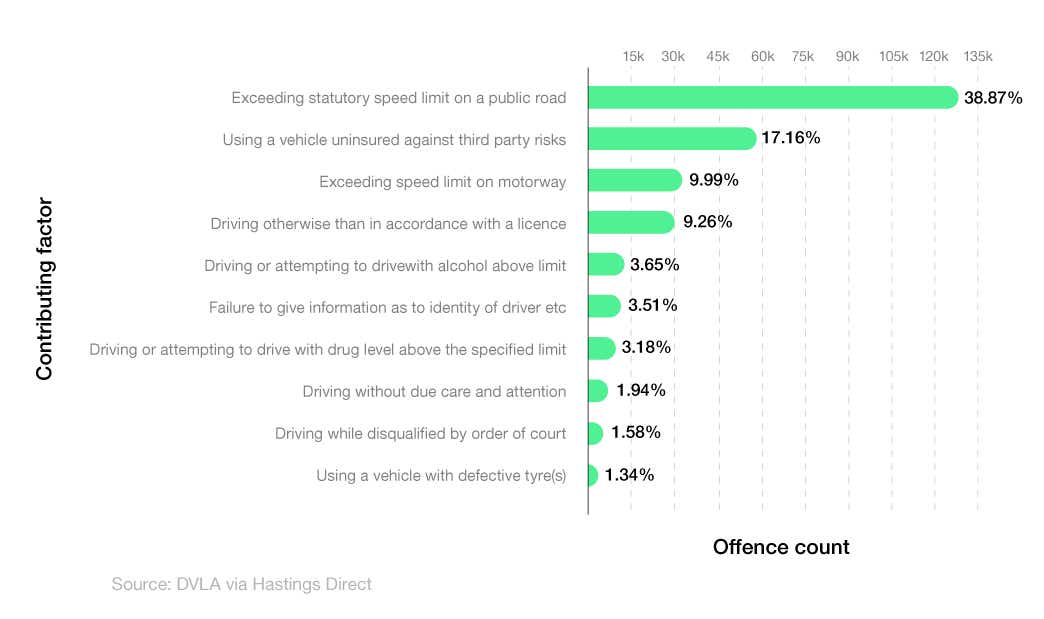
Around one in five (17.16%) UK drivers aged 17-24 were caught using a vehicle uninsured against third-party risks, amounting to 56,789 recorded cases for the year.
Around one in 10 young drivers were caught in 2022 either exceeding the speed limit on a motorway (9.99%) or driving without a licence (9.26%).
Young driver seatbelt statistics
According to data from Gov.uk, those aged between 17-24 are the most likely to not wear a seatbelt during a traffic collision in which someone is killed or seriously injured (KSI). As of 2022, around one in six (15%) of 17-24-year-olds in the UK were guilty of this traffic offence.
A breakdown of the percentage of UK drivers not wearing a seatbelt during KSI collisions by age group
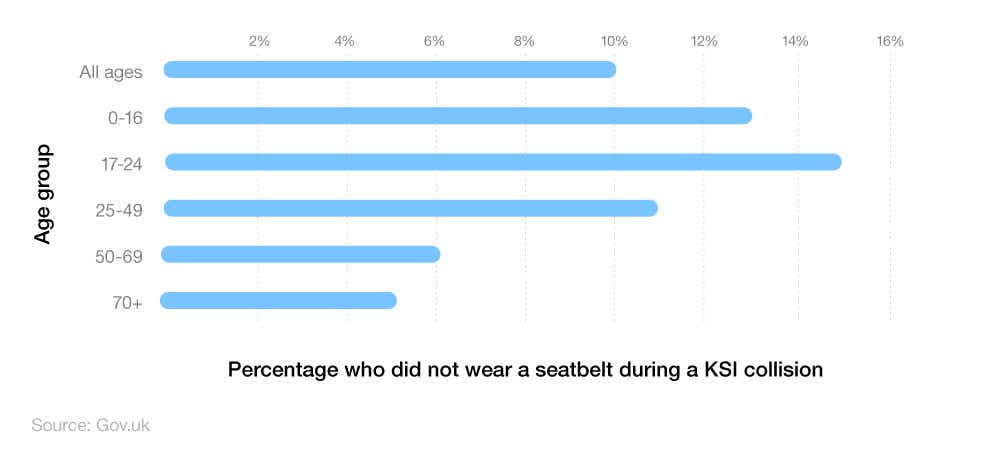
On average, around one in 10 (10%) of all UK drivers involved in a KSI collision are not wearing a seatbelt, meaning young drivers are 50% more likely to do so compared to the average UK driver.
Those aged 0-16 are also more likely than older age groups to not wear a seatbelt during a KSI collision. This was the case in 13% of recorded incidents in 2022.
Driving test statistics for young drivers in the UK
The average driving test pass rate for UK drivers in 2022/23 was 48.4%, meaning that around 810,000 people passed their test during that financial year.
This section of our young drivers statistics report delves into the pass rate for those aged 17-24, to see how this compares to other age groups, as well as what percentage of young drivers have taken a driving test and the reasons for not doing so.
What percentage of young drivers have taken a driving test?
A young driver report by Ipsos in 2023 found that just over a third (34%) of UK young drivers have only taken their theory test, with around one in six (15%) having attempted the practical examination.
A breakdown of young UK non-drivers showing whether they have taken a driving test or not
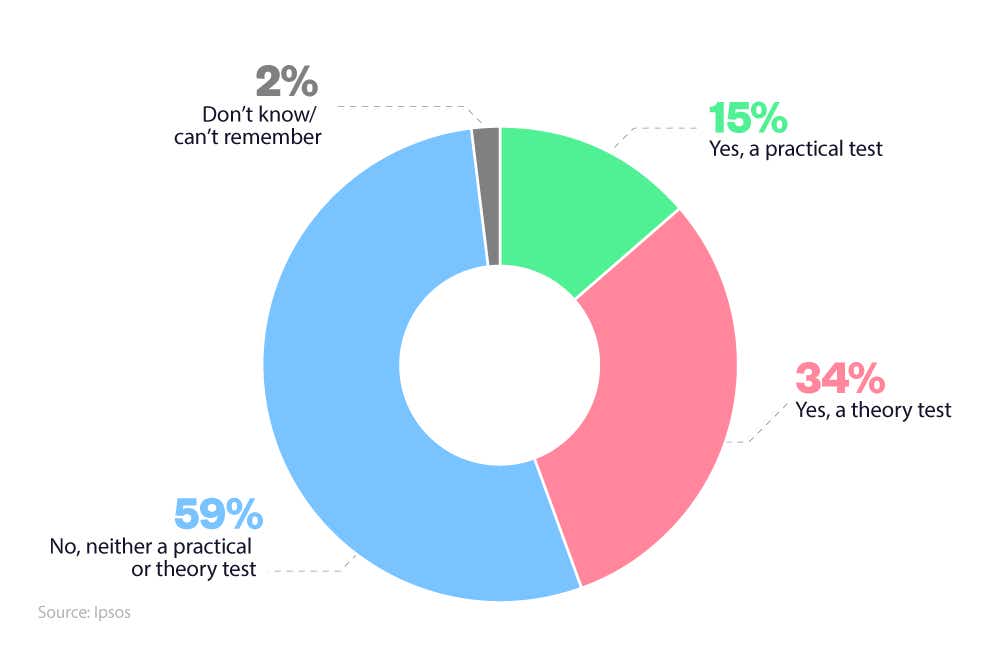
Young driver-related statistics from Ipsos also found that around three-fifths (59%) of those aged 17-24 have never taken a practical or theory test when it comes to driving.
What is the driving test pass rate of young drivers in the UK?
As of 2022-23, 391,022 drivers passed their driving test on the first attempt. With 810,610 first attempts taking place throughout the year, this meant just under half (48%) passed their driving test on their first go and represented a 1% decrease in the rate for 2021-22.
A breakdown of the first attempt pass rate for young drivers by year
| undefined | First attempts | First attempt passes | Pass % | First test with zero faults |
|---|---|---|---|---|
| 2007-08 | 791,098 | 342,481 | 43.30% | 4,166 |
| 2008-09 | 762,067 | 345,411 | 45.30% | 4,773 |
| 2009-10 | 701,132 | 320,695 | 45.70% | 4,826 |
| 2010-11 | 728,434 | 336,349 | 46.20% | 6,049 |
| 2011-12 | 700,549 | 332,697 | 47.50% | 7.345 |
| 2012-13 | 651,037 | 310,373 | 47.70% | 7,381 |
| 2013-14 | 667,740 | 319,577 | 47.90% | 6,534 |
| 2014-15 | 704,915 | 335,374 | 47.60% | 7,536 |
| 2015-16 | 731,955 | 347,825 | 47.50% | 8,034 |
| 2016-17 | 799,827 | 376,785 | 47.10% | 9,627 |
| 2017-18 | 777,413 | 363,044 | 46.70% | 10,029 |
| 2018-19 | 733,167 | 341,394 | 46.60% | 10,247 |
| 2019-20 | 720,490 | 334,428 | 46.40% | 10,375 |
| 2020-21 | 248,293 | 127,742 | 51.00% | 4,805 |
| 2021-22 | 816,122 | 402,371 | 49.30% | - |
| 2022-23 | 810,160 | 391,022 | 48.30% | - |
(Source: Department for Transport (DfT) and Driver and Vehicles Standards Agency (DVSA))
Since 2007, increasing numbers of young drivers are passing their driving test at the very first attempt. In 2007-08, just over two-fifths (43.3%) of young drivers passed the first time. By 2013, this figure had risen by 4.4%.
Between 2020-21 was the first time on record that more people passed their first driving test than failed when the pass rate reached 51%.
The number of drivers passing their driving test for the first time without any faults has also risen considerably. In 2007-08, the percentage of drivers who passed their first test with zero faults was 0.5%. By 2019-20, this figure had almost tripled, to 1.4%.
In 2020-21 the rate was even higher, with close to one in 50 (1.9%) passing their first test with zero faults.
A breakdown of the driving test pass rates by age group
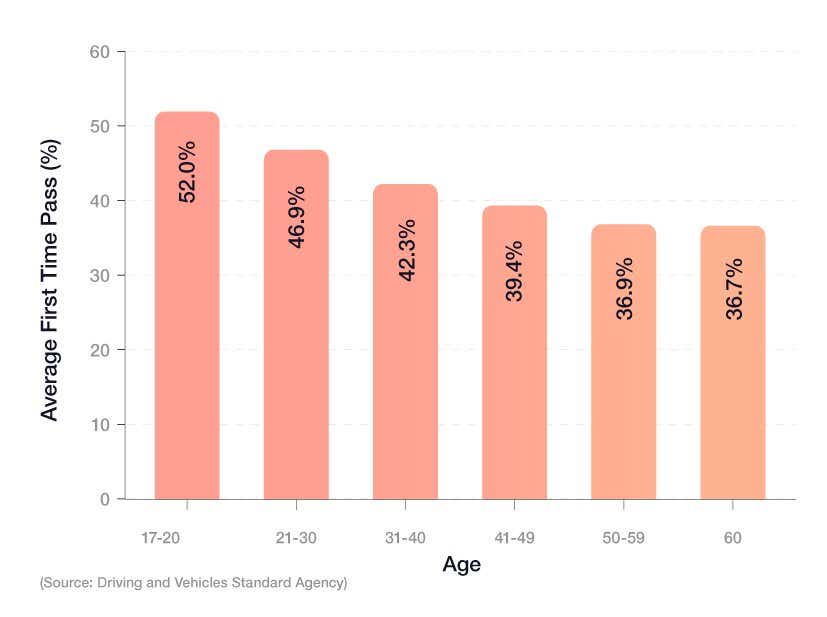
Driving test pass rate data also shows that young drivers are far more likely to pass their first test than those who start later. The 17-20 age bracket was the only one where more test takers passed instead of failed (52%). After this, the pass rate for first-time drivers taking their test at the age of 21-30 fell to just under 47%.
It went down again for ages 31-40, whose first-time pass rate was close to 10% lower than that of 17-to-20-year-olds.
As drivers get older the likelihood that they pass their first test diminishes. Drivers aged 41-49 were 13% less likely to pass than young drivers aged 17-20. The disparity widens even further, as drivers aged over 60 were 15% less likely to pass than their younger counterparts.
What age can you pass your driving test? In the UK, you need to be at least 17 years old in order to learn to drive, take your theory and practical test, and obtain a driving licence.
Driving test statistics for young UK non-drivers
According to Ipsos’ 2023 young drivers report, around a third (33%) of 17-24-year-olds have not taken a driving test due to the high cost associated with driving, making it the most common reason for not driving among young UK drivers.
A breakdown of the main reasons for young UK non-drivers not taking a driving test

More than a quarter (26%) also stated that the cost of purchasing a car was putting them off driving, as well as not having enough time to learn. Similarly, around one in five (22%) also claimed that the cost of car insurance was too expensive for them to want to drive.
Future driving habits of young drivers in the UK
This section reveals a series of young driver statistics exploring the potential driving habits of those aged 17-24 in the coming years. We analyse the likelihood that UK young drivers will still be driving in the future, the reasons behind it, and what factors might influence their decisions to remain behind the wheel by 2035.
The likelihood of young drivers driving in 2035
According to a young drivers report by Ipsos, more than a third of young drivers surveyed in 2023 are certain they will still be driving in 2035.
A breakdown of how likely young drivers are to still be driving in 2035
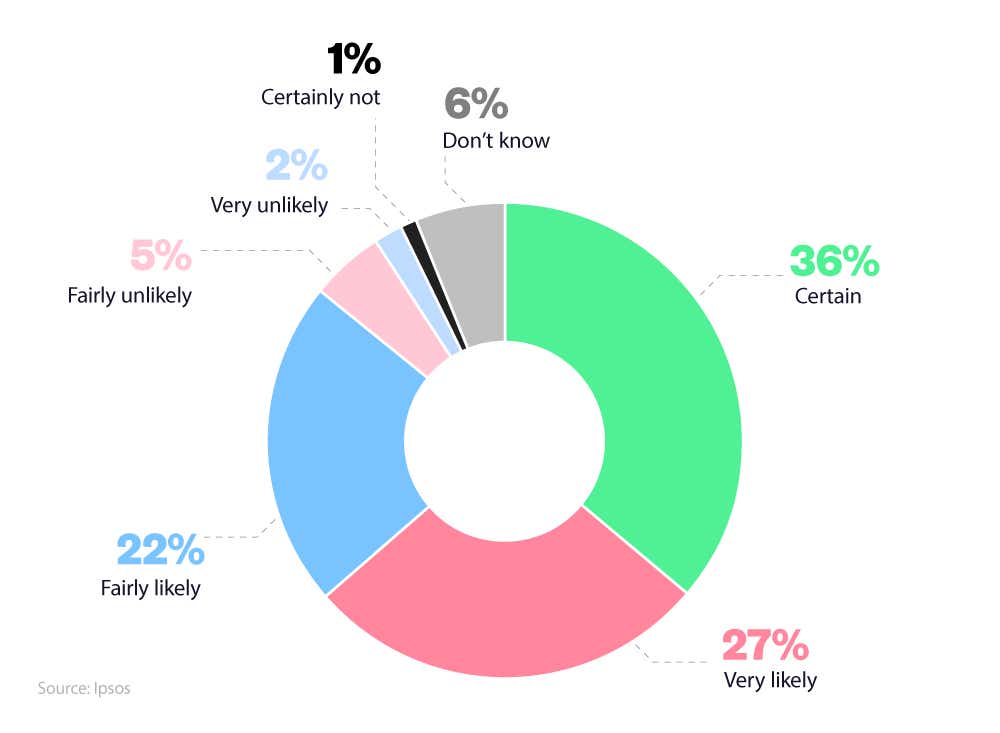
More than a quarter (27%) of 17-24-year-olds claim they are very likely to still be driving by the mid-2030s, with around one in five (22%) thinking it’s fairly likely.
Incidentally, just 1% of those surveyed are adamant they’ll have given up driving by 2035, with 7% believing it’s unlikely they’ll still be driving by the same date.
A breakdown of reasons for the likelihood of young people driving in 2035
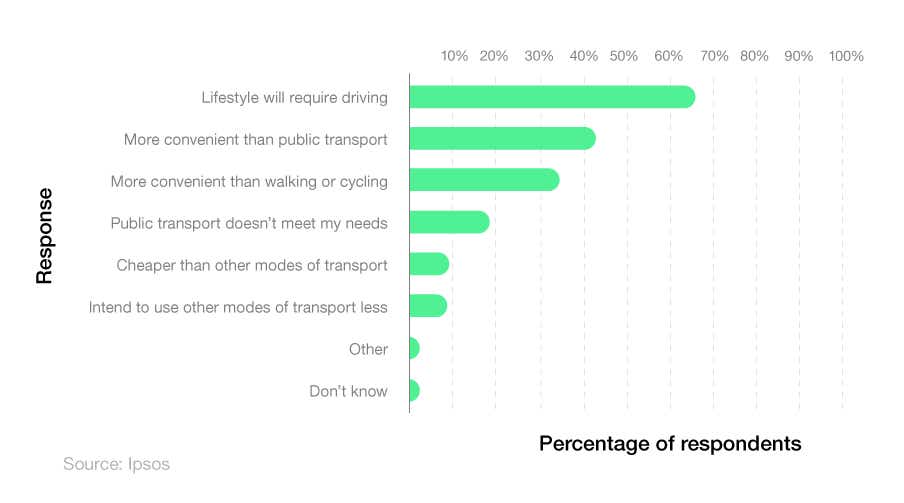
Ipsos’ 2023 young drivers report suggests that the main factor affecting the likelihood of them driving in 2035 will hinge on lifestyle. Two-thirds (66%) of those surveyed claim that their lifestyle will require them to drive, followed by more than two-fifths (42%) who state driving a vehicle is more convenient than public transport.
Just over a third (34%) also prefer driving over walking or cycling, again stating the convenience of it as a pull factor, with around one in five (18%) admitting that public transport doesn’t meet their travel needs.
UK young driver attitudes towards the environment
A report by Ipsos on young drivers shows more than seven in 10 (72%) drivers surveyed aged 17-24 currently turn off their engines when parked or waiting, making it the most common environmental consideration for young drivers in 2023.
This was followed by around three-fifths of young drivers who currently walk or cycle for short, non-work related journeys (62%) or use public transport (61%) as an alternative to taking a private vehicle.
A breakdown of what measures young drivers are taking and would be willing to do to reduce their carbon footprint
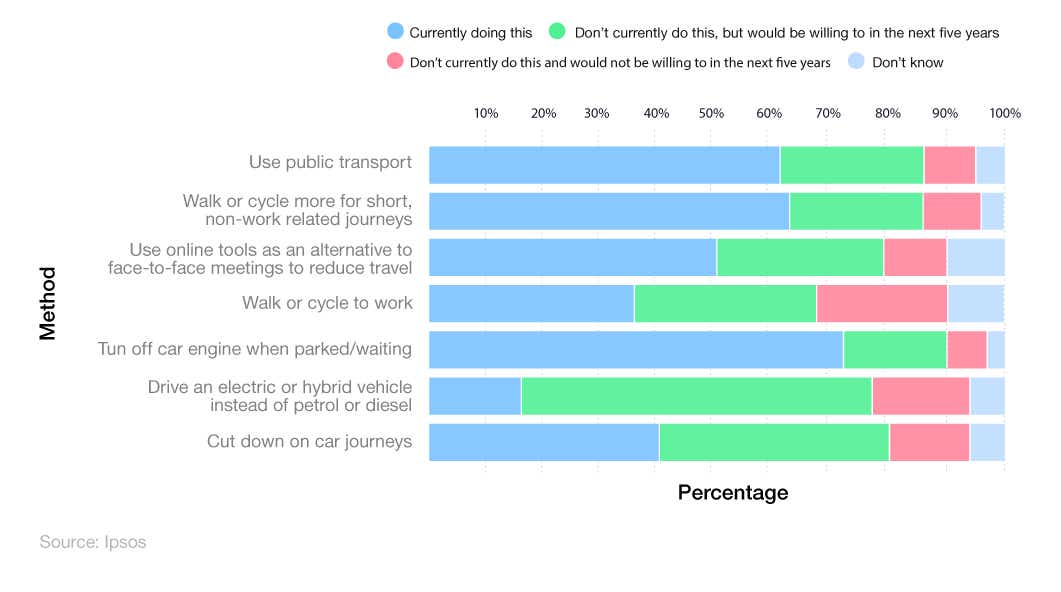
Around three in five (61%) UK young drivers would consider using an electric or hybrid vehicle instead of petrol or diesel within the next five years. This is met with around one in five (17%) who wouldn’t.
Two-fifths (40%) of UK drivers aged 17-24 also said they currently cut down on car journeys, with an identical percentage admitting they don’t at the moment, but would consider it by the end of 2028.
Young Drivers Insurance FAQs
How much is car insurance for a new driver in the UK?
As of 2024, the average cost of car insurance for a new driver in the UK is around £2,175 per year. However, this will vary on many factors, such as location, age, gender, and the type of car you intend to drive.
How much is insurance for a 17-year-old in the UK?
As of 2024, the average cost of insurance for a 17-year-old in the UK was £2,624 a year.
Why is car insurance so expensive for young drivers?
The riskier the driver, the more their car insurance will cost. Teenage drivers' patterns of risk show that they are more likely to have an accident and drive less reliable cars, which means they are more likely to claim their car insurance than older drivers.
Will my insurance go down after a year of driving?
Potentially, but not definitely. Your insurance may go down after a year of driving, but this is not guaranteed. There is no magic number when it comes to seeing your insurance price drop. However, after three years of incident-free driving you can expect the price you pay on insurance to slowly decrease.
What age does car insurance go down in the UK?
In the UK, the age at which car insurance starts to go down is usually after the age of 19. According to Uswitch quote data, the average cost of insurance for a 19-year-old in 2024 was £2,545. By age 24, this figure dropped by almost £1,000 on average, to £1,534 per year for car insurance.
Why do young male drivers pay more for car insurance?
Male drivers are more likely to be involved in a car accident. Estimates suggest that almost three-fifths (57%) of male drivers have been involved in some sort of crash, whilst just over two-fifths (44%) of female drivers have experienced an accident.
How to reduce car insurance for young drivers?
Some tips for cutting the cost of car insurance, especially for young drivers, include installing security features, taking an advanced driving course, and taking advantage of discounts and freebies. It’s advisable to shop around and see how much your car insurance would be with different providers to help get the product that is right for you.
Does adding an additional driver make insurance cheaper?
Sometimes, adding an experienced driver can reduce insurance costs for young drivers. It shows to the insurance company that the younger driver is trusted by a more capable driver who is also responsible for the car. Taking out multi-car insurance can also have a similar effect.
What types of car insurance are there?
There are many types of car insurance, including third-party (fire and theft), third-party only, and comprehensive cover. With differences between third-party and comprehensive cover, it’s advisable to conduct thorough research before deciding which one is right for you.
What car is cheap insurance for young drivers?
As of 2024, the car that provided the cheapest average cost of car insurance for young drivers in the UK was a Peugeot (£1,988) – typically around £900 a year more than the average cost of car insurance for those aged 17-24 driving a BMW.
Are young drivers more likely to take risks?
Potentially. Young drivers may be more likely to take risks, in part due to their inexperience. This can mean young drivers may find it harder to spot potential hazards. Data also suggests that younger drivers are more likely to be reckless behind the wheel, for example by overtaking and/or speeding on occasions where older and more experienced drivers would not. If you’re insuring a younger driver, it’s worth considering comprehensive car insurance as this will offer you more protection should an accident write off another driver’s car.
Can newly passed drivers drive on the motorway?
Yes, new drivers can drive on the motorway providing that they hold a valid UK licence and their vehicle is fully insured and taxed. It’s a common car insurance myth that newly passed drivers aren’t allowed to drive on the motorway. There are no laws against first-time drivers hitting the motorway. However, it can be a daunting task, which is why many young drivers take extra lessons focused on driving on the motorway.
Young Drivers Insurance Glossary
Black box car insurance
Black box car insurance (also known as telematics car insurance) is a policy where a driver is monitored by a small device that is fitted to a car.
Drivers that are careful behind the wheel, don’t speed or rely on emergency stops, will see their premiums reduced. The number of young drivers in the UK who have black box car insurance is an estimated 300,000.
Quote requests
A car insurance quote is an estimate of how much your car insurance will cost. A quote request is when a driver approaches a company for a quote.
Third-party insurance
The legal minimum level of car insurance coverage in the UK. Third-party insurance protects you against the costs that are incurred from damages or injuries that you cause to other people.
Methodology and sources
https://www.statista.com/statistics/314898/share-driving-licence-holders-by-age-england/
https://www.gov.uk/government/statistical-data-sets/nts02-driving-licence-holders
https://www.data.gov.uk/dataset/d0be1ed2-9907-4ec4-b552-c048f6aec16a/gb-driving-licence-data
https://www.racfoundation.org/wp-content/uploads/Young-driver-survey-Ipsos-April-2023.pdf
https://injuryfacts.nsc.org/motor-vehicle/motor-vehicle-safety-issues/speeding/
https://www.hastingsdirect.com/car-insurance/17-25-car-insurance/most-common-traffic-offences/
https://docs.google.com/spreadsheets/d/1Mutu9vJUC3g6uF2bRWgKOZj0L34-zHKZ/edit#gid=1917471233
https://www.brake.org.uk/get-involved/take-action/mybrake/knowledge-centre/young-drivers
https://www.gov.uk/government/collections/national-travel-survey-statistics
https://www.billplant.co.uk/blog/how-many-people-pass-their-driving-test-first-time/
https://www.nya.org.uk/overlooked-report/
https://www.group1auto.co.uk/news/over-3000-learners-have-crashed-in-their-practical-driving-tests


