In the United Kingdom, all road-going motor vehicles need to have some form of insurance. Small cars and motorcycles all the way up to 38 tonne trucks have to be covered, and the same goes even if the car is parked on the road (unless the owner is granted a SORN).
However, a full year’s insurance may not make financial sense for a lot of UK drivers, especially in comparison to more flexible monthly car insurance options, or even daily temporary insurance. With the pandemic-fuelled rise of employees working from home, the June 2021 RAC Foundation report indicated the average UK car or van was in use for just 4% of the day. This is a tiny amount considering a 2021 ONS survey reported that UK drivers spent an average of £3,556 a year on vehicle costs, such as road tax and insurance.
In this report, we have collated facts and stats from leading automotive and insurance sources, alongside analysing market data and customer satisfaction surveys to provide a comprehensive overview of temporary car insurance statistics for 2023.
Compare car insurance to ensure you get the best car insurance deals available.
Quick overview of temporary car insurance statistics 2023
England has the most temporary car insurance policyholders, accounting for almost 87% of the overall temporary car insurance market in the UK.
Out of the English regions, Yorkshire & the Humber has the highest rate of temporary car insurance with nearly 9% of UK policyholders.
The average cost of a temporary car insurance policy between October 2022 and September 2023 was £73.80.
In the same period, consumers aged between 30 and 34 most commonly used temporary car insurance, accounting for over 19% of the policyholders.
Almost three in 10 (28.69%) of temporary car insurance policies were taken out on vehicles aged between six and 10 years.
Drivers aged 17-20 are charged the most expensive temporary car insurance policies, costing £150.05 on average.
Temporary car insurance was most commonly taken out on vehicles valued between £5,000 or less, with 57.95% of policies between October 2022 and September 2023.
The average cost of one hour of temporary car insurance in London is £8.33, which means 45 hours of lessons would cost £374.84 – the highest in the UK.
Around one in six (15%) of consumers have purchased a non-annualised policy (NAP) during the past two years, suggesting a current market of about 5.4 million U.K. drivers. The age group of 30-39 has the highest average use of NAPs, at 27%.
Types of temporary car insurance
If you’re looking to sign up to a yearly contract, there are more than 50 types of car insurance available to you. While there may be less choice, you can still purchase temporary car insurance in a variety of ways, such as:
Short term car insurance

Insurance that can have you covered from just one hour, to one day car insurance, all the way up to a month. This is often used by those borrowing someone else’s vehicle. Short term car insurance statistics show that this method is the most popular with consumers, at 38%.
Temporary courier insurance

Specifically for those seeking to insure a vehicle for commercial work. More than one in 10 (12%) of all non-annualised policyholders use temporary courier insurance to work for rideshare apps, such as Uber.
Impounded vehicle insurance

This gives you the ability to access an impounded vehicle, and drive it home again. To release an impounded vehicle, you must show you have at least 30 days insurance, which this option will give you.
Temporary learner insurance

For those learning to drive, but want to do it with a family member or friend (alongside lessons with an instructor). Temporary learner driver insurance is a common way for young people to get on the road, provided they’re always accompanied by an experienced driver.
Temporary expats insurance

Exclusively for those who were born in the UK and resided in the country for at least 10 years but have since emigrated. This niche insurance type differs from foreign drivers seeking insurance, as it applies only to ex-residents of the UK.
Temporary European car insurance

All UK insurance policyholders have third party coverage across the EU. However, if you do not hold a UK policy then you’ll need to purchase temporary European car insurance for driving in the EU and EEA.
Temporary car insurance for students

Aimed at those in higher education who need a more flexible approach to car insurance. Student car insurance deals are widely prevalent in the temporary car insurance industry.
UK temporary car insurance market statistics 2023
Post-pandemic, sales of temporary car insurance policies have never been higher. Data from TempCover shows that in January 2020, 19,000 temporary car insurance policies were taken out. However, in February of 2023, that figure had risen substantially, to 65,000 temporary car insurance policy sales per month.
Below are relevant statistics regarding temporary car insurance between the periods of October 2022 and September 2023, with data regarding:
Customer age
Vehicle age
Vehicle value
A regional breakdown of temporary car insurance demand nationwide.
UK temporary car insurance statistics by customer age
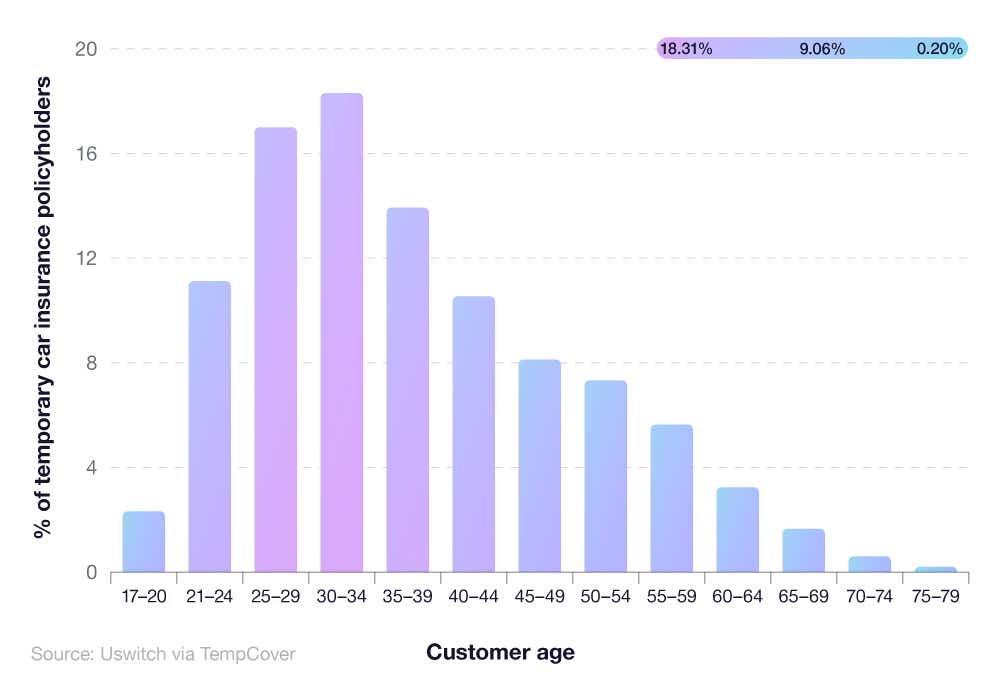
According to temporary car insurance statistics from TempCover, those aged between 20 and 40 represent the vast majority of temporary car insurance policyholders. Cumulatively, this age group represents more than six in ten (61.11%) temporary car insurance users. Within that bracket, those aged 30-34 used temporary car insurance the most, accounting for almost one in five (19.25% of) temporary car insurance policyholders.
A breakdown of UK temporary car insurance statistics by age of customer
| Customer age | % of temporary car insurance policyholders |
|---|---|
| 17-20 | 2.37 |
| 21-24 | 10.4 |
| 25-29 | 17.14 |
| 30-34 | 19.25 |
| 35-39 | 14.32 |
| 40-44 | 10.58 |
| 45-49 | 7.77 |
| 50-54 | 7.07 |
| 55-59 | 5.34 |
| 60-64 | 3.07 |
| 65-69 | 1.59 |
| 70-74 | 0.75 |
| 75-79 | 0.35 |
(Source: Uswitch via TempCover)
Those aged 17-20 represent just over one in fifty (2.37%) temporary car insurance holders. This can be attributed to the higher cost warranted for young drivers buying temporary car insurance, a reflection of what’s seen in the traditional insurance market too.
According to UK car insurance statistics, the average 20-year-old driver pays a yearly insurance premium of £851—15% more than the next age surveyed in their study (25 year olds).
Some temporary car insurance deals are only available for those aged 25 or above, so always consult policy specifics before making a decision.
From 30 to 34 years down, the age of drivers taking out temporary car insurance reduces incrementally. Drivers aged between 60-79 represent over one in twenty (5.76%) temporary car insurance policyholders. People within the 75-79 age bracket take out temporary car insurance at a rate of one in every three hundred customers (0.35%), the least of any driver age range surveyed.
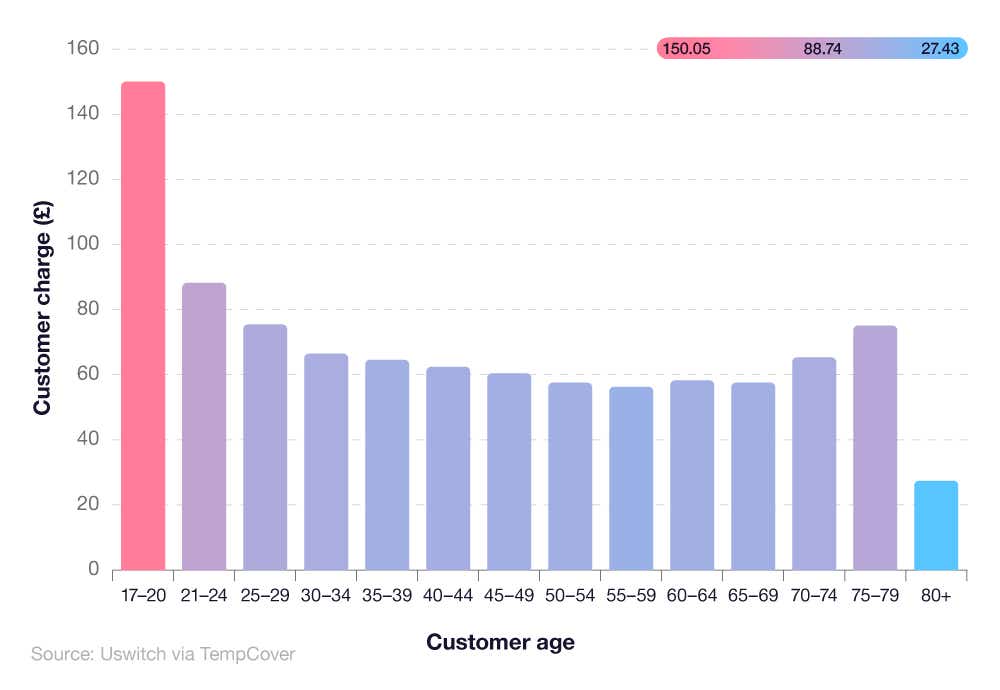
A breakdown of UK temporary car insurance cost by age of customer in 2023
| Customer age | Customer charge (£) |
|---|---|
| 17 to 20 | 150.05 |
| 21 to 24 | 88.23 |
| 25 to 29 | 75.44 |
| 30 to 34 | 66.45 |
| 35 to 39 | 64.56 |
| 40 to 44 | 62.41 |
| 45 to 49 | 60.43 |
| 50 to 54 | 57.54 |
| 55 to 59 | 56.29 |
| 60 to 64 | 58.24 |
| 65 to 69 | 57.56 |
| 70 to 74 | 65.31 |
| 75 to 79 | 75.1 |
| 80 and over | 27.43 |
(Source: Uswitch via Tempcover)
The most expensive temporary car insurance policies are charged to the youngest drivers, with those aged 17-20 paying £150.05 on average. This is over 90% more than the £56.29 paid on average by 55–59 year olds. Premiums gradually decrease with age, falling over 15% from 21–24 year olds (£88.23) to 25–29 year olds (£75.44).
This downward trend continues into middle age, with temporary car insurance costs dropping by 8% from 40–44 year olds (£62.41) to 50–54 year olds (£57.54). The main exception is the 80 and over age bracket, which bucks the trend by paying the lowest premium (£27.43) – almost 93% less than 75–79 year olds (£75.10).
UK temporary car insurance premium statistics by vehicle age
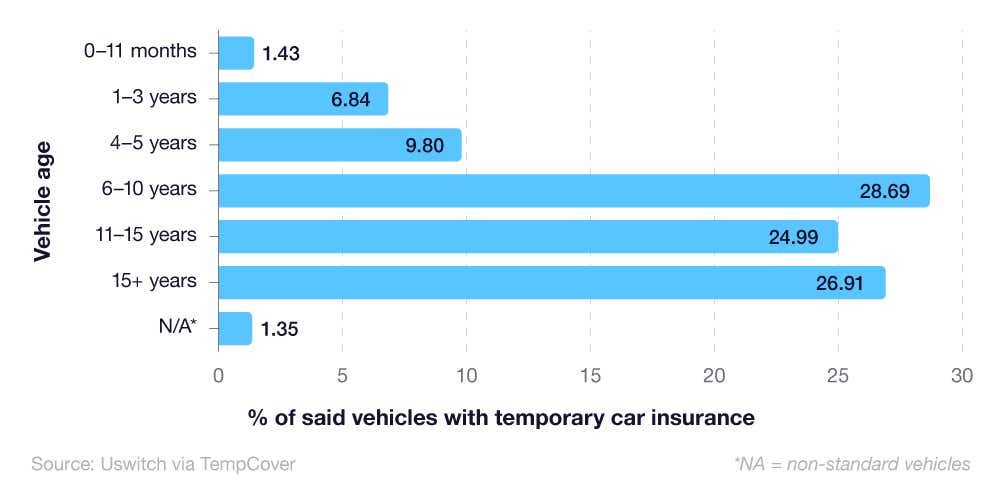
Vehicles aged between six and 10 years are the most likely to be temporarily insured. More than one in four cars (28.69%) with a temporary car insurance policy are between the ages of six and 10 – almost 2% more than that of the next most likely vehicle age (15+ years old).
A breakdown of UK temporary car insurance premium statistics by vehicle age in 2023
| Vehicle age | % of vehicles with temporary car insurance |
|---|---|
| 0-11 months | 1.43 |
| 1-3 yrs | 6.84 |
| 4-5 yrs | 9.8 |
| 6-10 yrs | 28.69 |
| 11-15 yrs | 24.99 |
| 15+ yrs | 26.91 |
| N/A | 1.35 |
(Source: Uswitch via Tempcover)
The average cost of a new car has skyrocketed in recent years in the UK to £39,308, according to AutoTrader. Higher new vehicle costs are related to issues including:
The Covid-19 pandemic and its effect on the global economy
Supply chain issues with semiconductors
The ongoing crisis and conflict in Ukraine due to supply chain issues and increased raw materials costs.
Meanwhile, according to AutoTrader, the average second-hand vehicle is now worth about £17,654. The advanced age of vehicles with a temporary car insurance policy applied indicates that drivers are testing or purchasing second-hand cars more frequently than if they were purchasing new, or nearly new, vehicles.
Indeed, temporary car insurance statistics show that, of all vehicle ages surveyed, just under one in fifty drivers (1.43%) chose to apply a temporary insurance policy to a vehicle aged between new and eleven months old. This could be down to the small quantity of second-hand cars within that age bracket (9%, according to Auto Trader), or the prohibitively high cost of brand new vehicles in the UK.
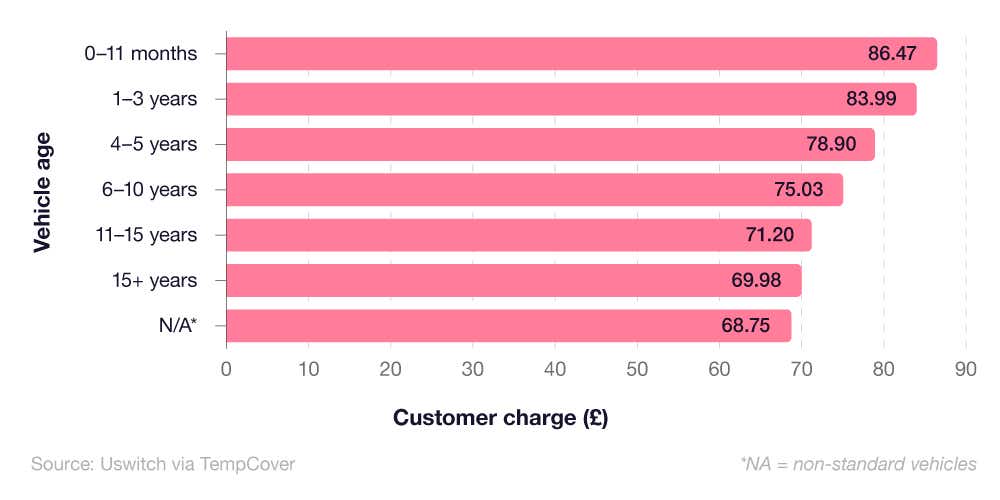
A breakdown of UK temporary car insurance cost by vehicle age in 2023
| Vehicle age | Customer charge (£) |
|---|---|
| 0-11 months | 86.47 |
| 1-3 yrs | 83.99 |
| 4-5 yrs | 78.9 |
| 6-10 yrs | 75.03 |
| 11-15 yrs | 71.2 |
| 15+ yrs | 69.98 |
| N/A | 68.75 |
(Source: Uswitch via Tempcover)
Policy charges start to decline as the vehicle ages. Brand new cars up to 11 months old have the highest temporary car insurance costs, at £86.47 on average – almost 3% more than one to three-year-old vehicles (£83.99).
Vehicles aged between four and five years cost over 6% less than vehicles between one and three years. This trend continues with six to 10-year-old vehicles priced at an average of £75.03, around 5% less than four to five-year-old models.
The downward trajectory persists into even older cars, the oldest vehicles (15+ years) save more than a fifth (21%) over the newest cars at an average of £69.98 per policy.
UK temporary car insurance premium statistics by vehicle value
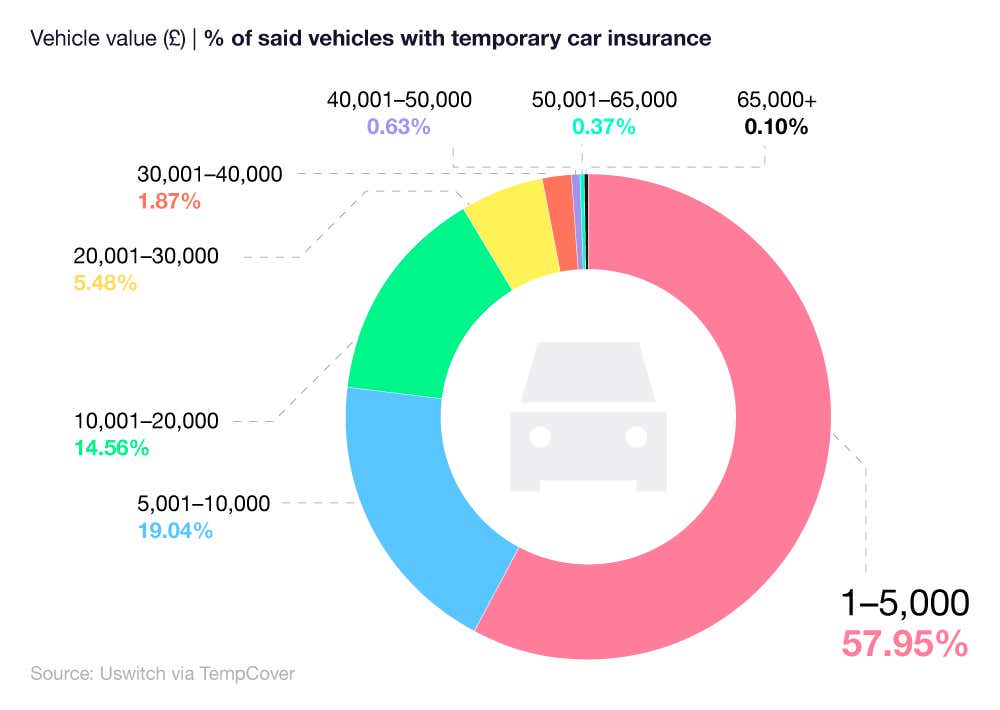
The latest temporary car insurance statistics reveal that the vast majority of drivers who took out temporary car insurance between October 2022 and September 2023, did so on a vehicle costing £5,000 or less.
Almost three in five drivers (57.95%) utilised a temporary car insurance policy on a vehicle in the lowest price category surveyed. This further proves that, during this cost of living crisis, UK drivers are seeking older cars (six to ten years of age on average) that are cost-effective.
A breakdown of UK temporary car insurance premium statistics by vehicle value in 2023
| Cost of vehicle (£) | % of said vehicles with temporary car insurance |
|---|---|
| 1-5,000 | 57.95 |
| 5,001-10,000 | 19.04 |
| 10,001-20,000 | 14.56 |
| 20,001-30,000 | 5.48 |
| 30,001-40,000 | 1.87 |
| 40,001-50,000 | 0.63 |
| 50,001-65-000 | 0.37 |
| 65,000+ | 0.1 |
(Source: Uswitch via Tempcover)
However, there is a divide in terms of the consumer base for temporary car insurance. Almost one in five (19.04%) temporary car insurance customers used their policy on a vehicle costing between £5,001 and £10,000, superseding the bracket of £10,001 to £20,000 by a margin of 4.48%.
Temporary car insurance data suggests that, as the car becomes more valuable, the likelihood of a driver taking out a temporary car insurance policy gradually reduces. For vehicles priced between £20,001 and £30,000, just under one in 15 drivers (5.48%) used a temporary car insurance policy.
Premium cars that cost £65,000 or above were the least likely to have a temporary insurance policy placed on them, with just one in 1,000 consumers opting for temporary car insurance.
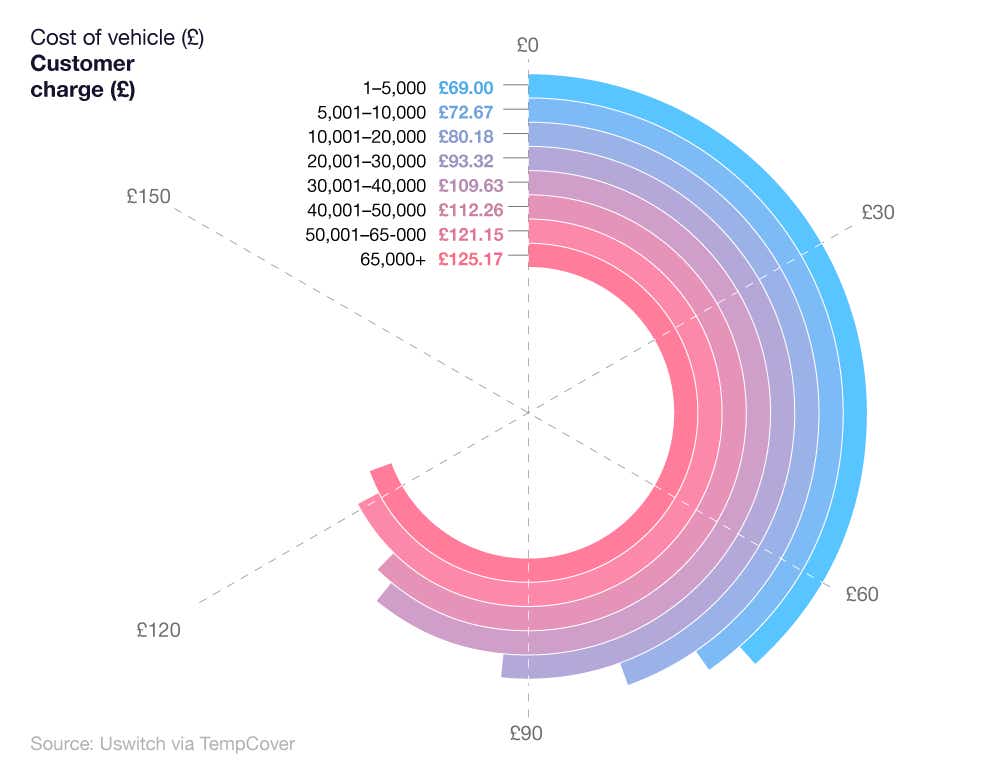
A breakdown of UK temporary car insurance prices by cost of vehicle
| Cost of vehicle (£) | Customer charge (£) |
|---|---|
| 1-5,000 | 69 |
| 5,001-10,000 | 72.67 |
| 10,001-20,000 | 80.18 |
| 20,001-30,000 | 93.32 |
| 30,001-40,000 | 109.63 |
| 40,001-50,000 | 112.26 |
| 50,001-65-000 | 121.15 |
| 65,000+ | 125.17 |
(Source: Uswitch via Tempcover)
The cheapest band of cars (£1–£5,000) have the lowest average premium for temporary car insurance at £69, while more expensive vehicles see progressively higher premiums.
Cars valued between £5,001 and £10,000 see an average temporary car insurance cost of over 5% more (£72.67), around 15% more for £10,001–£20,000 and almost 30% more for vehicles valued between £20,001 and £30,000 (£93.32).
This trend continues as vehicle age increases, with £30,001–£40,000 vehicles charged £109.63 on average, 16% more than £20,001–£30,000 models. The highest temporary car insurance charge is for the most expensive bracket of £65,000+ (£125.17), which is almost 58% more than the cheapest models.
Like traditional insurance, temporary car insurance can become more expensive if the vehicle you are insuring is deemed ‘high value’. Compare the best deals available, starting from one day temporary car insurance.
Temporary car insurance premium statistics by location
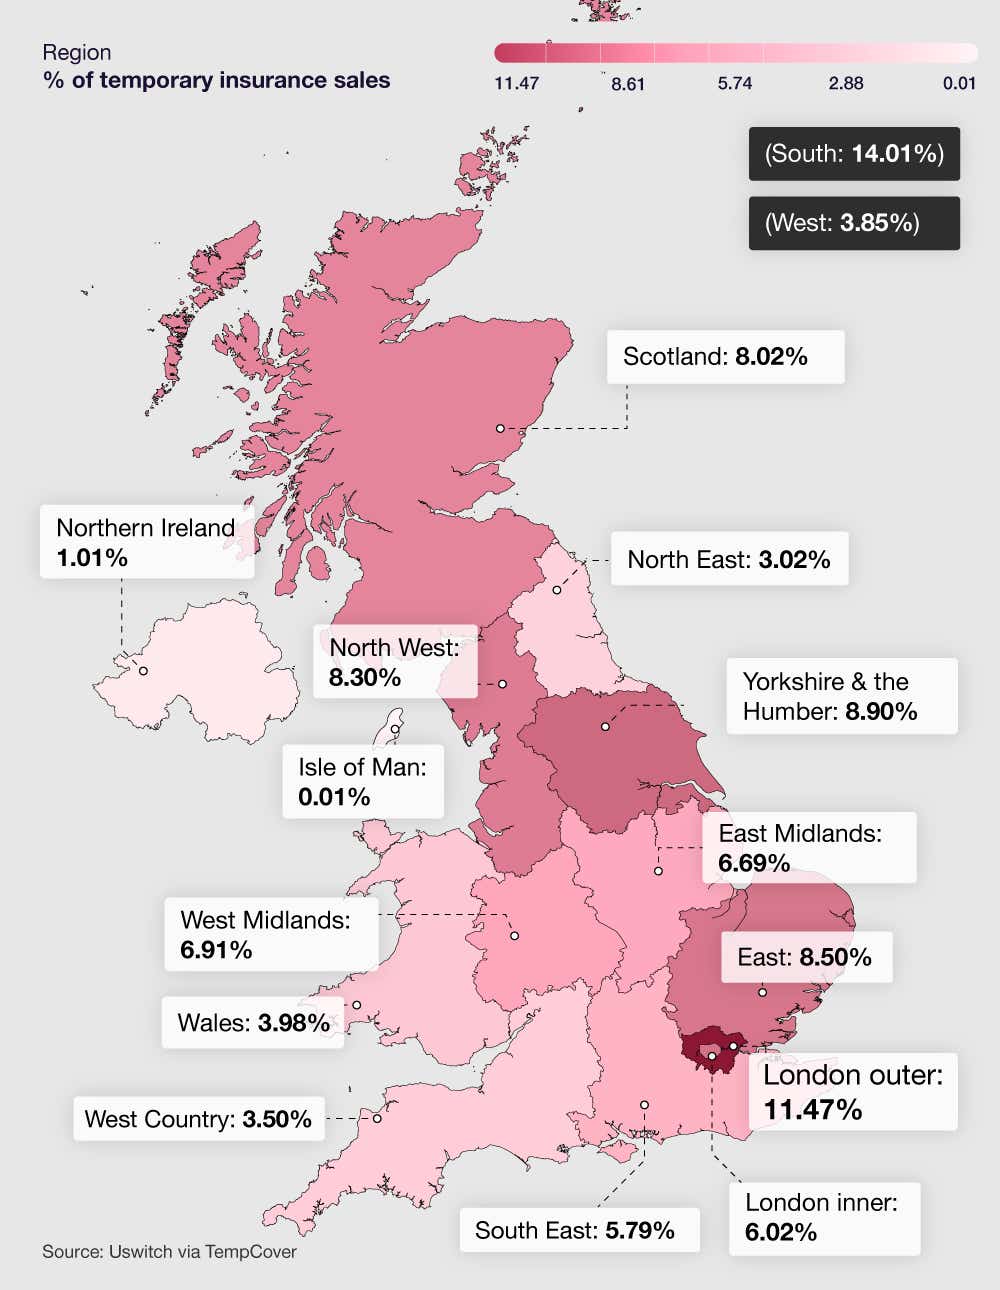
Drivers in England’s Southern region are most likely to use a form of temporary car insurance. Of all UK regions measured, seven in 50 temporary car insurance customers were from the south of the UK, almost 3% more than the next leading area of Outer London (11.47%).
A breakdown of temporary car insurance premium statistics by location
| UK region | % of temporary insurance sales |
|---|---|
| East | 8.5 |
| East Midlands | 6.69 |
| Isle of Man | 0.01 |
| London - inner | 6.02 |
| London - outer | 11.47 |
| Northern Ireland | 1.01 |
| North East | 3.02 |
| North West | 8.3 |
| Scotland | 8.02 |
| South | 14.01 |
| South East | 5.79 |
| Wales | 3.98 |
| West | 3.85 |
| West Country | 3.5 |
| West Midlands | 6.91 |
| Yorkshire & the Humber | 8.9 |
(Source: Uswitch via Tempcover)
In Yorkshire & the Humber, almost one in 10 (8.90%) drivers used temporary car insurance on a vehicle, just 0.40% more than temporary car insurance customers in the East Anglian region (8.50%).
In terms of the UK’s nations, England sees the most temporary car insurance policyholders, with almost 87 in 100 drivers (86.97%) utilising temporary car insurance for their vehicle.
Just over two in 25 drivers registered their temporary car insurance in Scotland. That figure decreased to just 3.98% in Wales and 1.01% of temporary car insurance policies in Northern Ireland.
A breakdown of UK temporary car insurance costs by different regions of the UK
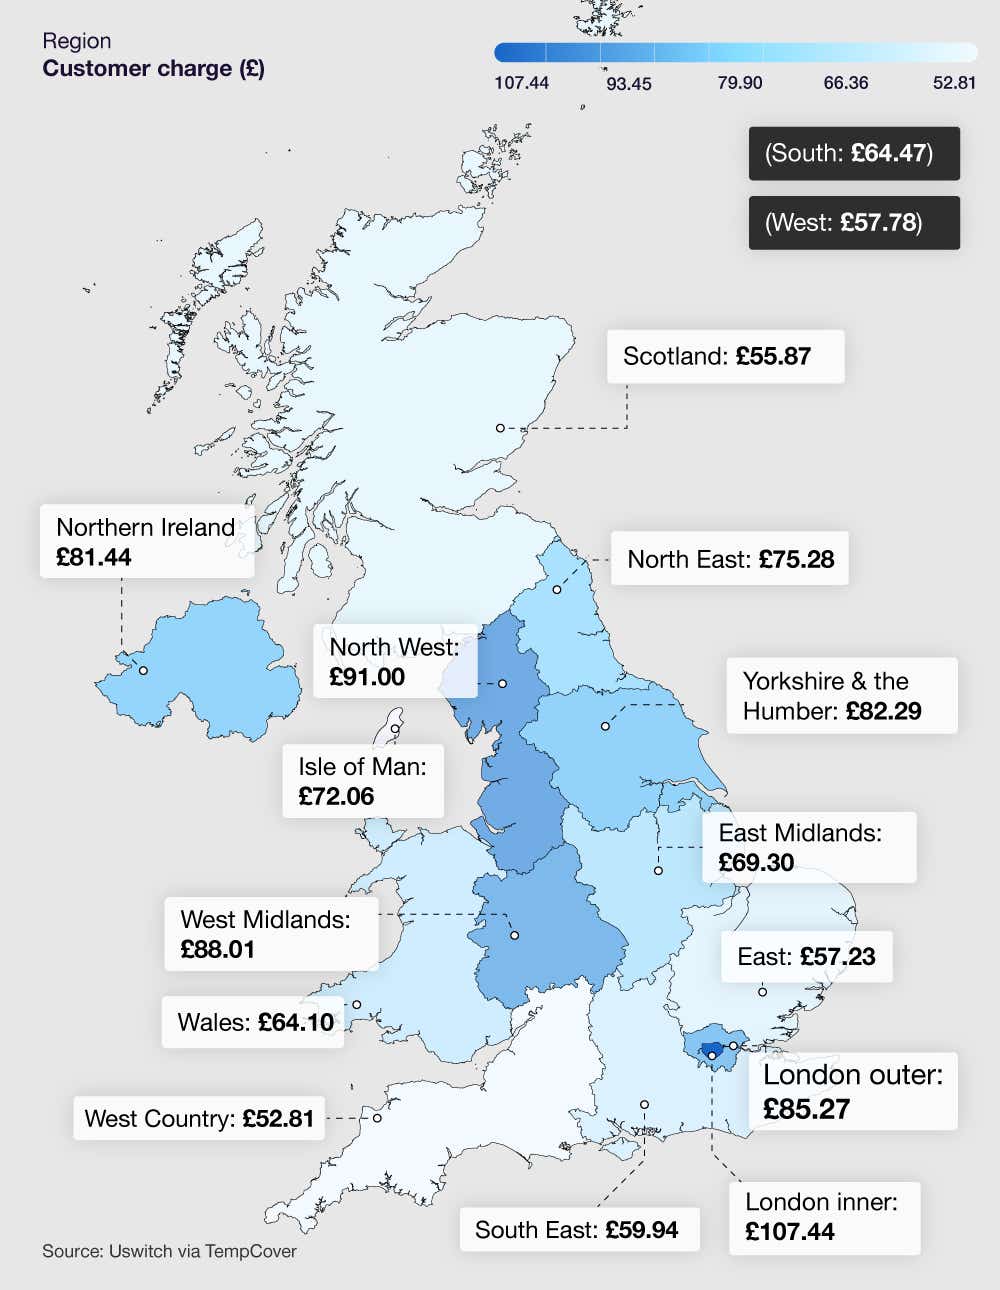
| UK region | Customer charge (£) |
|---|---|
| East | 57.23 |
| East Midlands | 69.3 |
| Isle of Man | 72.06 |
| London - inner | 107.44 |
| London - outer | 85.27 |
| Northern Ireland | 81.44 |
| North East | 75.28 |
| North West | 91 |
| Scotland | 55.87 |
| South | 64.47 |
| South East | 59.94 |
| Wales | 64.1 |
| West | 57.78 |
| West Country | 52.81 |
| West Midlands | 88.01 |
| Yorkshire & the Humber | 82.29 |
(Source: Uswitch via Tempcover)
The most expensive policies are found in the inner London region, with temporary car insurance standing at £107.44 on average. This is just over two-thirds (68%) more than the cheapest region, the West Country (£52.81).
The North West has the second highest temporary car insurance policies at £91 on average, whereas premiums in the West Midlands (£88.01) are almost a quarter (23%) more than its neighbour, the East Midlands (£69.30).
Outside of England, Scotland has the lowest average policy costs in the UK (£55.87), over 37% lower than Northern Ireland (£81.44) and almost 14% lower than Wales (£64.10).
UK temporary car insurance statistics between Monday-Thursday and Friday-Sunday
Temporary car insurance is a variable market, with scope for flexibility in terms of policy requirements. Different temporary car insurance consumers have varying requirements between midweek (i.e. Monday-Thursday) and weekends (Friday-Sunday).
A breakdown of the percentage difference in temporary car insurance uptake by customer age and day of the week
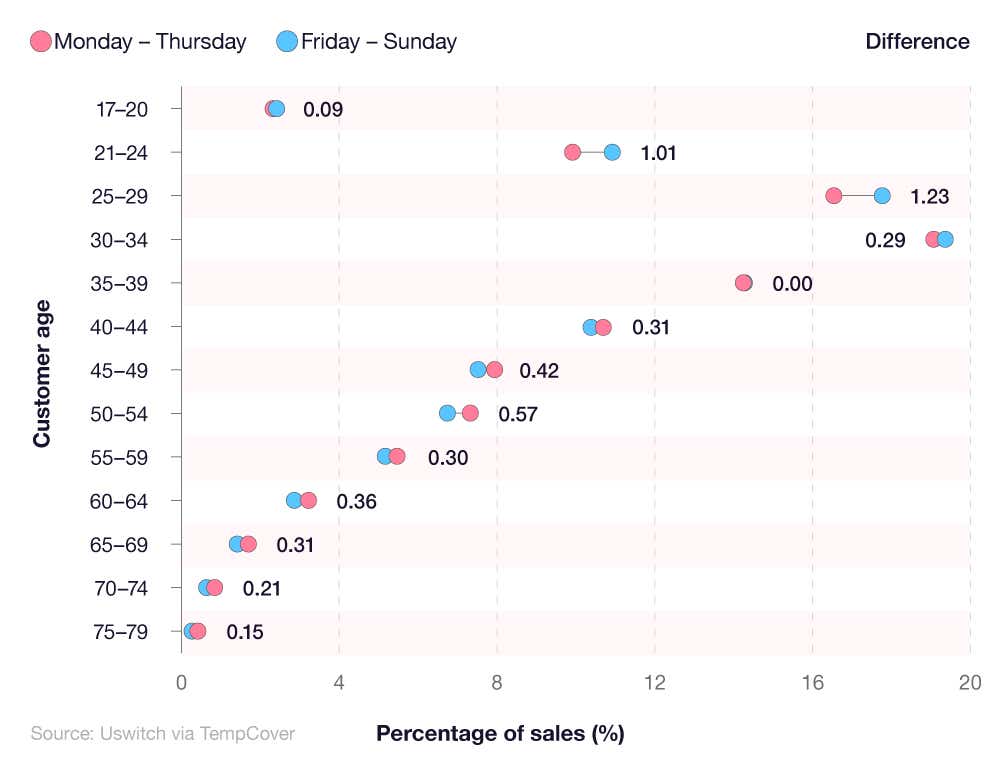
| Customer age | Monday - Thursday | Friday - Sunday | Difference |
|---|---|---|---|
| 17-20 | 2.33 | 2.42 | 0.09 |
| 21-24 | 9.94 | 10.95 | 1.01 |
| 25-29 | 16.58 | 17.81 | 1.23 |
| 30-34 | 19.12 | 19.41 | 0.29 |
| 35-39 | 14.32 | 14.32 | 0 |
| 40-44 | 10.72 | 10.41 | 0.31 |
| 45-49 | 7.96 | 7.54 | 0.42 |
| 50-54 | 7.33 | 6.76 | 0.57 |
| 55-59 | 5.48 | 5.18 | 0.3 |
| 60-64 | 3.23 | 2.87 | 0.36 |
| 65-69 | 1.73 | 1.42 | 0.31 |
| 70-74 | 0.85 | 0.64 | 0.21 |
| 75-79 | 0.42 | 0.27 | 0.15 |
(Source: Uswitch via Tempcover)
There is a clear split in consumer ages taking out temporary car insurance either during the week or on the weekend. Those between 17 and 34 are more likely to use this insurance on the weekend with 2.42% from Friday to Sunday, a 0.09% difference to policies taken out during the week.
For ages 40 through to 79, all temporary car insurance consumers are more likely to enact their policy midweek, as opposed to the weekend. The average difference between the percentage of policies taken out from Monday to Thursday compared to Friday to Sunday is 0.33.
The largest difference between consumer ages regarding temporary car insurance is seen between 25-29 years of age. This age group is 1.23% more likely to utilise a temporary car insurance policy on the weekend than midweek.
A breakdown of the percentage difference in temporary car insurance uptake by vehicle age and day of the week
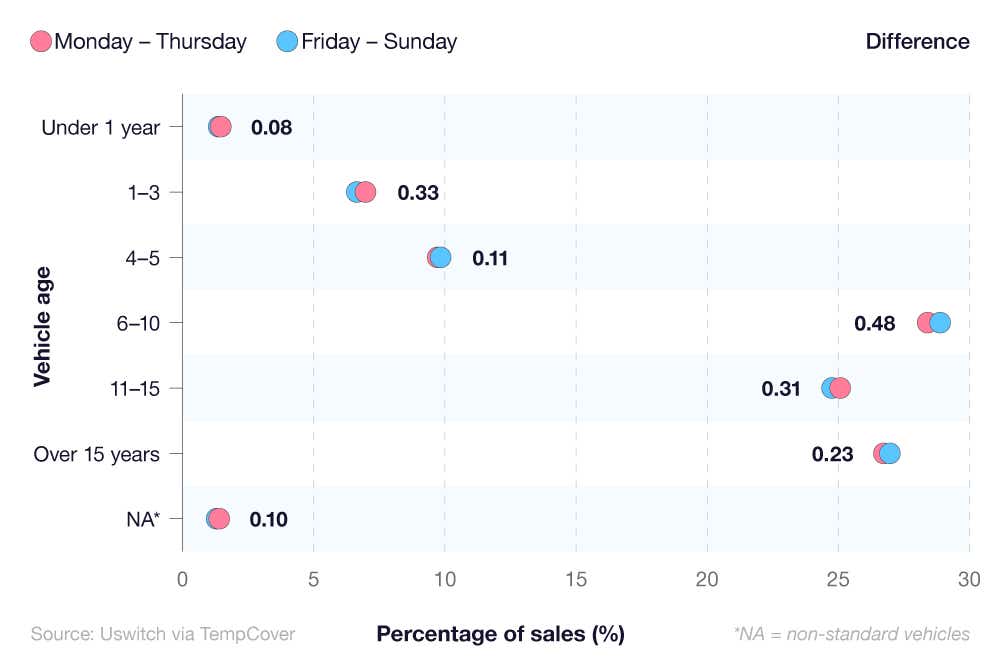
| Vehicle value (£) | Monday - Thursday | Friday - Sunday | Difference |
|---|---|---|---|
| 1-5,000 | 58.18 | 57.67 | 0.51 |
| 5,001-10,000 | 18.92 | 19.17 | 0.25 |
| 10,001-20,000 | 14.39 | 14.76 | 0.37 |
| 20,001-30,000 | 5.49 | 5.47 | 0.02 |
| 30,001-40,000 | 1.89 | 1.84 | 0.05 |
| 40,001-50,000 | 0.65 | 0.61 | 0.04 |
| 50,001-65,000 | 0.38 | 0.37 | 0.01 |
| 65,000 + | 0.11 | 0.1 | 0.01 |
(Source: Uswitch via Tempcover)
Temporary car insurance statistics highlight that cars worth between £5,001-£20,000 are more likely to be insured on a weekend than a weekday period. The average difference in the percentage of sales from Monday to Thursday and Friday to Sunday is 0.31%.
However, the lowest valued cars (between £1-£5,000) are more likely to be temporarily insured Friday-Sunday, as opposed to Monday-Thursday, at an increase of 1.19%.
Vehicles worth between £20,001 and £65,000+ are most likely to be insured using temporary car insurance on Monday-Thursday, with a combined 0.13% difference between midweek and the weekend.
A breakdown of the percentage difference in temporary car insurance uptake by region and day of the week
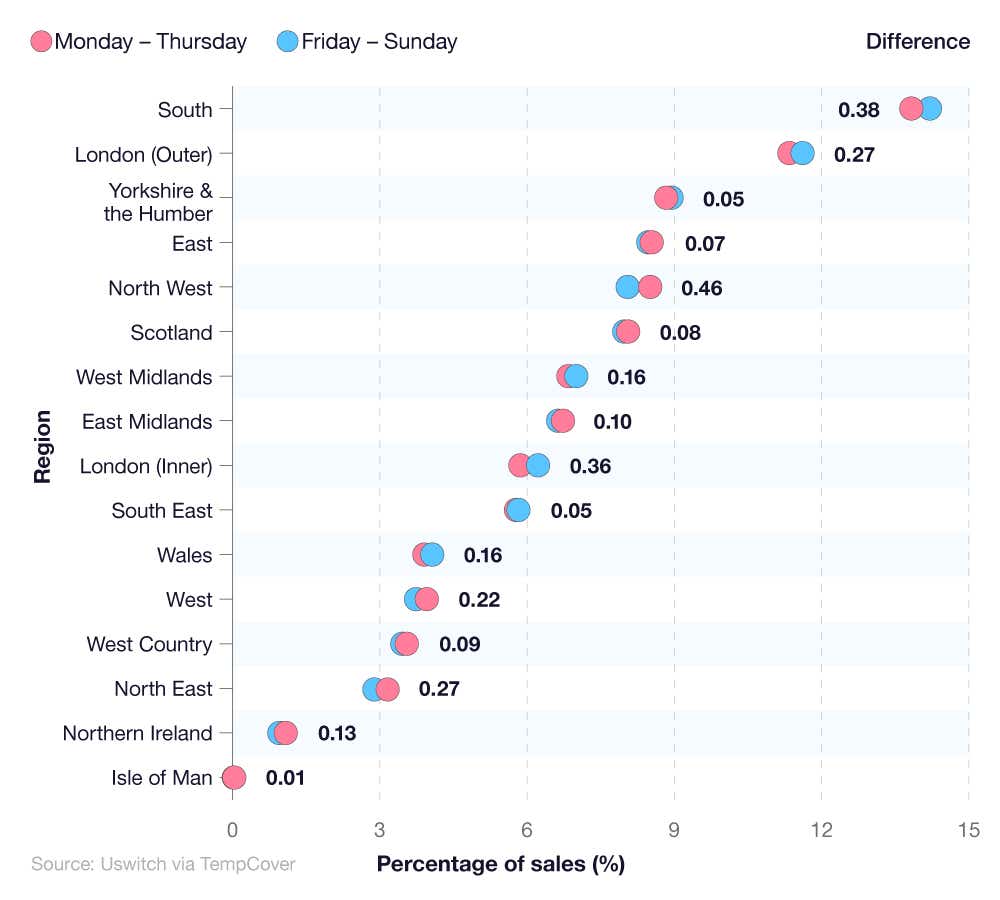
| Region | Monday - Thursday | Friday - Sunday | Difference |
|---|---|---|---|
| South | 13.84 | 14.22 | 0.38 |
| London - outer | 11.35 | 11.62 | 0.27 |
| Yorkshire & the Humber | 8.87 | 8.92 | 0.05 |
| East | 8.54 | 8.47 | 0.07 |
| North West | 8.51 | 8.05 | 0.46 |
| Scotland | 8.06 | 7.98 | 0.08 |
| West Midlands | 6.84 | 7 | 0.16 |
| East Midlands | 6.73 | 6.63 | 0.1 |
| London - inner | 5.86 | 6.22 | 0.36 |
| South East | 5.77 | 5.82 | 0.05 |
| Wales | 3.9 | 4.06 | 0.16 |
| West | 3.95 | 3.73 | 0.22 |
| West Country | 3.54 | 3.45 | 0.09 |
| North East | 3.15 | 2.88 | 0.27 |
| Northern Ireland | 1.07 | 0.94 | 0.13 |
| Isle of Man | 0.02 | 0.01 | 0.01 |
(Source: Uswitch via Tempcover)
Throughout the UK’s regions, the overall trend is to use a temporary car insurance policy midweek, with nine of the 16 areas measured demonstrating an increased demand over temporary car insurance usage on the weekend.
The North West sees the largest difference between midweek and weekend temporary car insurance customers. The area sees a 0.46% bias towards using temporary car insurance between Monday-Thursday, as opposed to Friday-Sunday (8.51% and 8.05%, respectively).
The South of England, where temporary car insurance sees the most demand, are 0.38% more likely to take out a temporary car insurance policy at the weekend compared to a weekday. Temporary car insurance policies in the South account for almost one in 15 (13.84%) midweek temporary insurance purchases nationwide, yet the figure for the weekend (14.22%) is marginally more than midweek.
Temporary car insurance average cost by hour
Temporary car insurance also allows learner drivers to gain further practice in a private vehicle such as their car, or one belonging to a family member. This is perfect for anyone learning to drive, who might only need temporary car insurance to over a driving lesson that lasts just one hour.
UK one hour temporary car insurance statistics by region
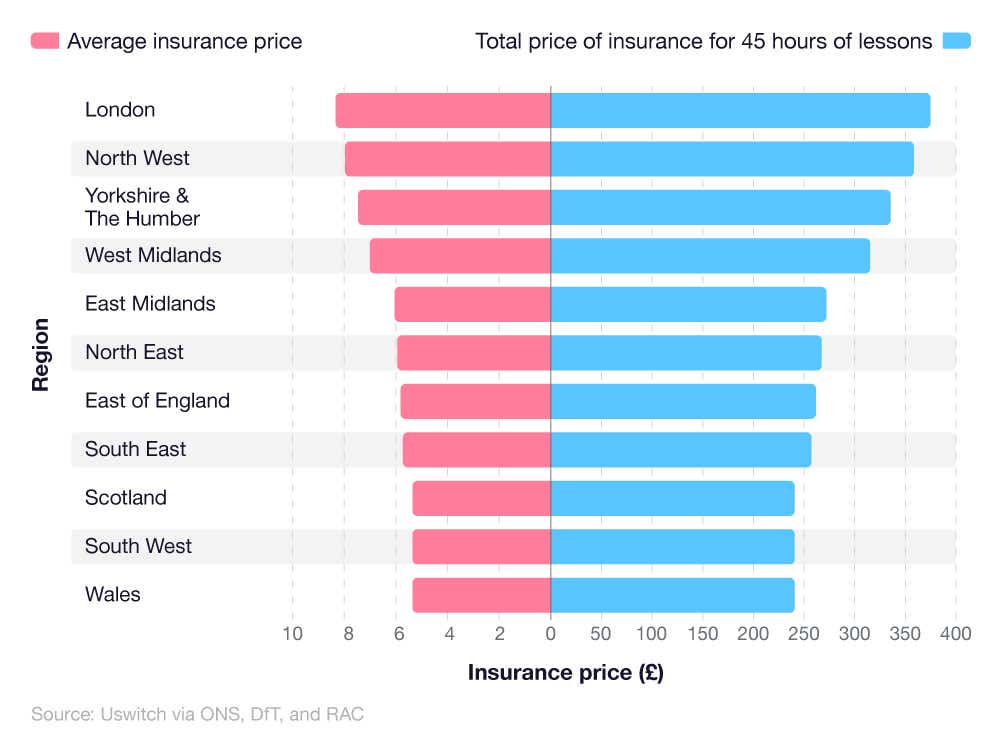
UK urban areas tend to be more expensive for one hour temporary car insurance, while rural places, like Wales and the South West, offer cheaper hourly premiums on average. Typically, London learners face far higher temporary insurance costs, paying over 43% more for 45 hours of driving lessons than those in Scotland.
A breakdown of prices for one hour of temporary car insurance on a provisional licence in a 2019 Ford Fiesta (2023):
Source: Uswitch via ONS, DfT, and RAC
The average cost of one hour of temporary car insurance in London is £8.33, which means 45 hours of lessons would cost £374.84. This is over 4% more than the second-highest region of the North West (£7.96 per hour, £358.36 total) and over 17% more than the third-highest region of the West Midlands (£7 per hour, £315.21 total).
By contrast, the cheapest temporary insurance can be found outside of England, in Scotland and Wales, where it costs around £5.35 per hour of temporary car insurance on average. This keeps the cost for 45 hours of lessons from £240.62 to £240.73 across these two countries on average.
UK non-annualised policy statistics 2023
Non-annualised Policyholders (NAP) versus annualised policyholders statistics
NAP statistics show that drivers using non-annualised policies have certain identifiable traits. For example, they tend to be younger than their non-NAP counterparts, have higher set incomes and live in metropolitan or urban areas. They also tend to have more children in the household.
It’s also worth noting that 12% of NAP users are gig economy drivers for ridesharing services, compared to only 1% of non-users. NAP users have a smaller amount of No Claims Discount, however that can be attributed to the overall lower expected age of NAP users.
UK NAP statistics by age and gender
Data reveals that the age group of 30-39 has the highest average use of non-annualised policies (NAPs), at 27%. This is followed by both 40-49 and 50-59, each accounting for a fifth (20%) of all NAP users.
A breakdown of UK non-annualised policy statistics by age
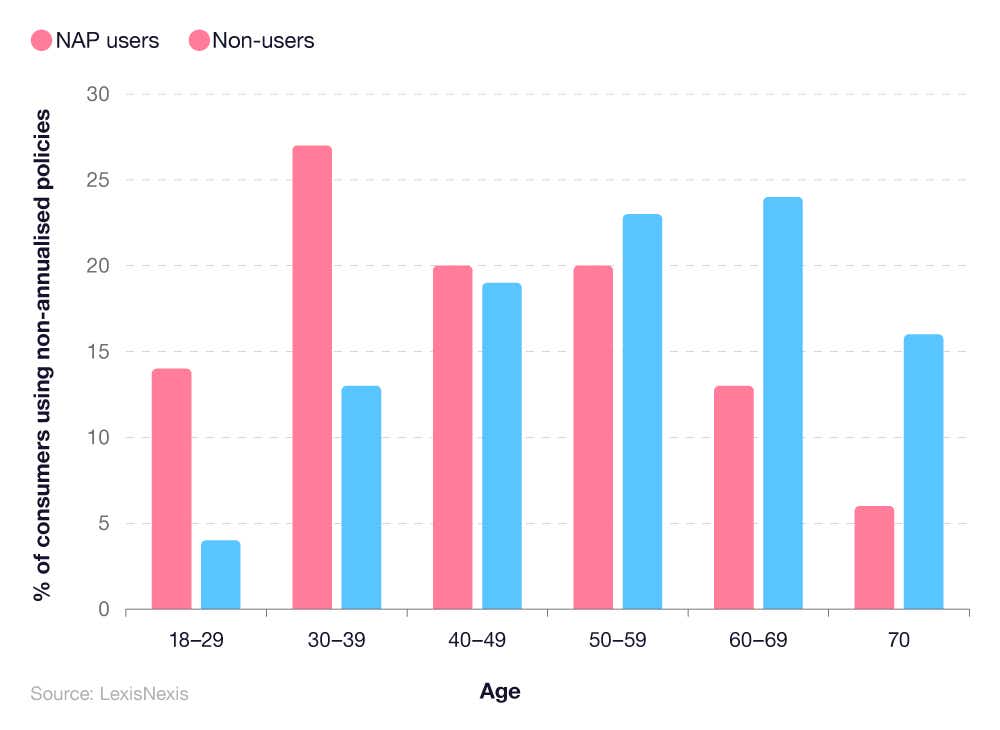
According to data collected for our UK car insurance statistics page, the lowest average yearly premiums belong to insured drivers over 50. Only 6% of all NAP users are 70+, the smallest percentage of those surveyed.
Those aged 18-29 are three-and-a-half times more likely to utilise a NAP product, such as temporary car insurance. Similarly, those in the 30-39 age bracket are more than twice as likely to use a NAP product. However, as the consumers’ age increases, their likelihood of using a NAP product diminishes: around one in six (16%) of annual policy holders (non-NAP) identified were over 70, whereas only 6% were NAP users.
A breakdown of non-annualised policy (NAP) statistics regarding gender
| Gender | NAP users | Non-users |
|---|---|---|
| Male | 52% | 48% |
| Female | 48% | 52% |
(Source: LexisNexis)
The gender divide between NAP users and non-NAP users is very tight, with just a 2% difference between the two genders surveyed. Males are marginally more likely to utilise a NAP product such as temporary car insurance, at 52% usage reported, whereas the female figure stands at 48%.
For non-NAP users, the figures are inverted: males are less likely to have an annual insurance premium (48%), while females are more likely to (52%).
A breakdown of UK non-annualised policy statistics by income
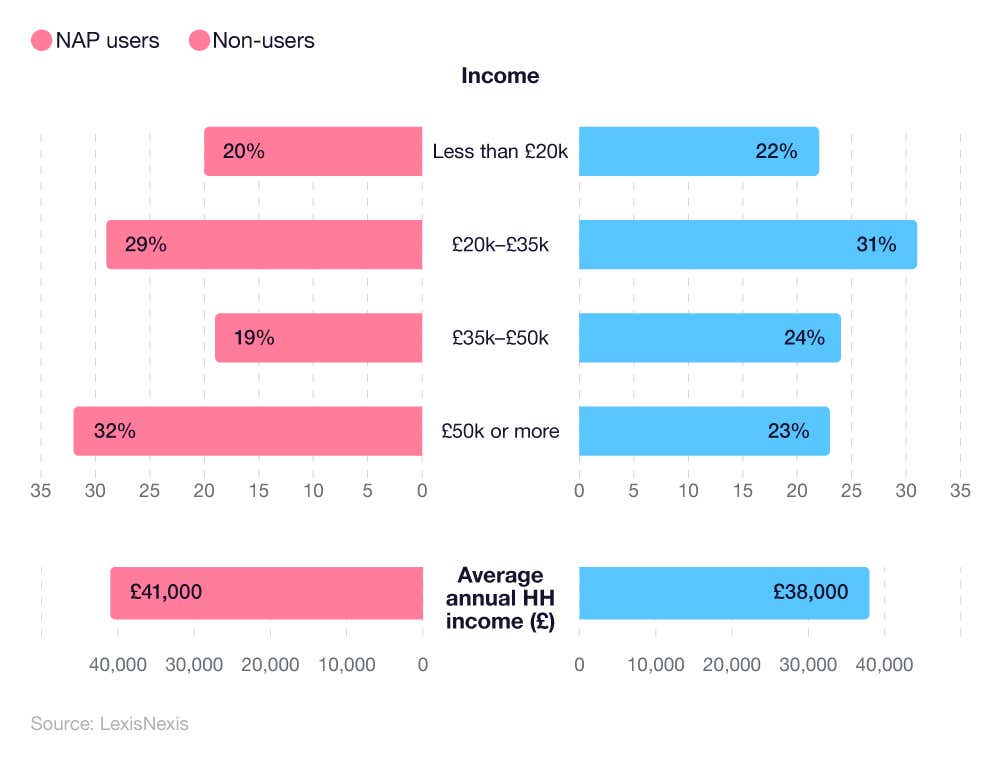
Income data from LexisNexis demonstrates that the average annual household income for NAP users is £41,000, around £3,000 higher than those who are non-NAP users (£38,000). Those on £50,000 or more a year have the highest share of NAP users, at 32%, whereas those earning £35k-£50k have the smallest share (19%).
Just under one in three (31%) non-NAP users earn between £20k and £35k a year, showing that those who pay an annual premium as opposed to a NAP product (such as temporary or subscription car insurance) earn less per year, on average.
A breakdown of UK non-annualised policy statistics by driving habits
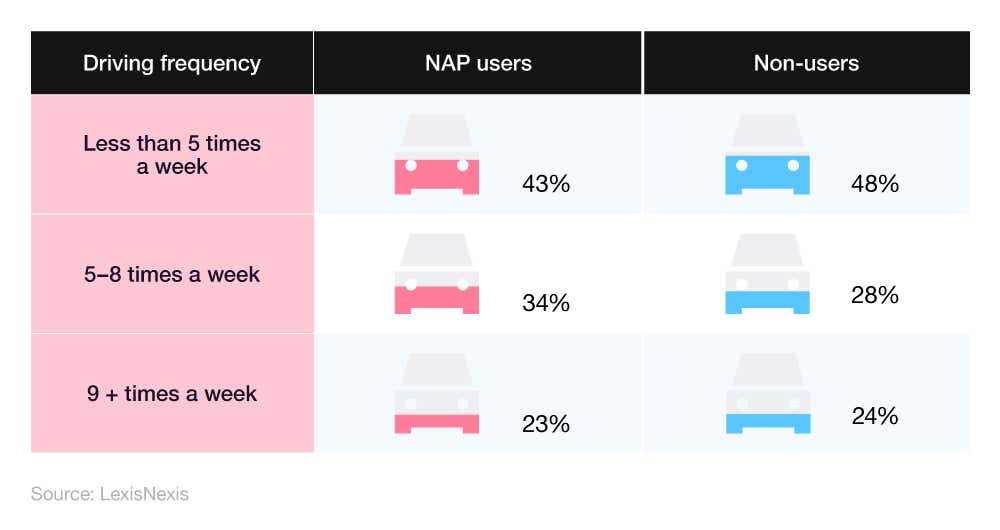
Drivers who use their vehicle less than five times per week, often defined as low mileage vehicle users, are 5% more likely to pay yearly for their insurance, even though their vehicle remains dormant for at least two full days per week.
Just over a third (34%) of NAP users drive their vehicles between five and eight times a week, with that figure dropping to 28% for those with annual car insurance. For drivers who use their vehicle nine times a week or more, 23% use NAP products and 24% have annual insurance, showing comparable figures in the high vehicle use market.
A breakdown of UK non-annualised policy statistics by number of years of No Claims Discount (NCD)
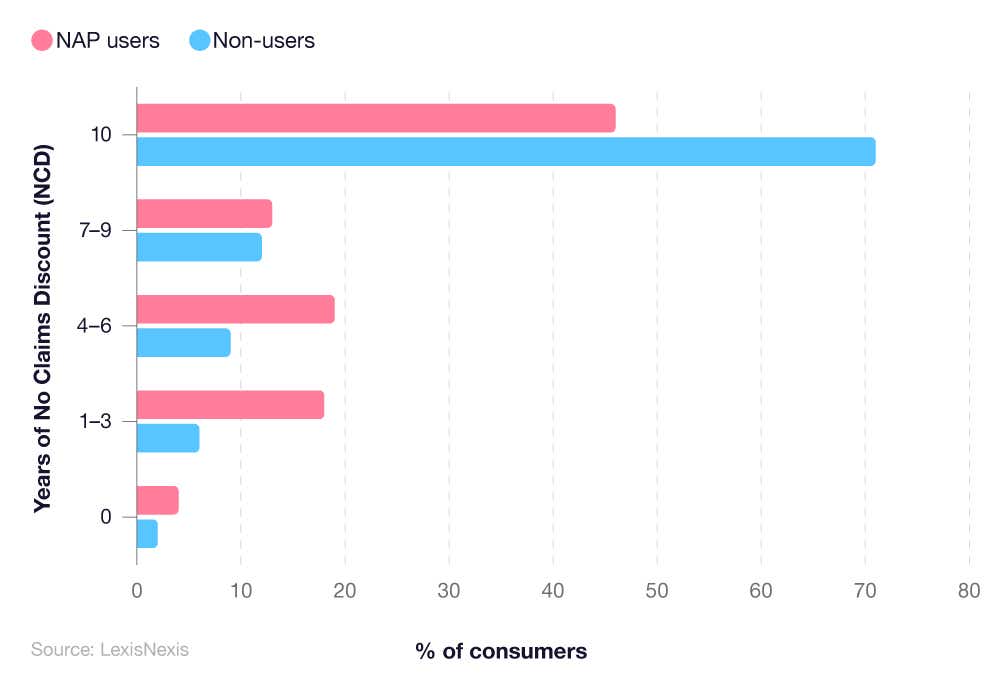
No Claims Discount (NCD) is the length of time a driver has insurance and doesn’t make a claim through their own fault. A driver’s NCD is protected if the affected vehicle is not at fault.
Drivers with zero NCD make up 4% of all NAP consumers, whereas that figure drops to 2% for non-NAP users.
The vast majority of drivers who utilise annual insurance policies and non-annual policies alike have at least ten years of NCD. For NAP users, that figure is 46%, while non-NAP users have 71%. That means those who use NAP products, such as temporary car insurance, have either been driving for a shorter amount of time, or have been involved in more at-fault accidents.
UK non-annualised policy statistics regarding technology
Non-annualised policies, such as temporary car insurance, are often tracked by the use of a black box or app. Using technology, like dash cams and black boxes, can reduce how much you pay for insurance.
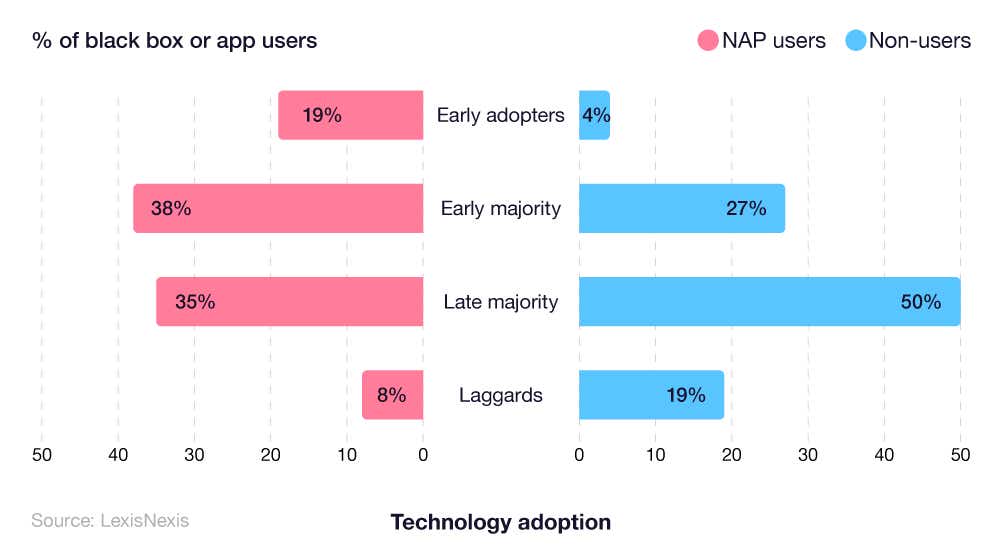
A breakdown of UK non-annualised policy statistics by black box or app users
Black box car insurance is where the insurer tracks vehicle attributes such as speed and distance travelled, with the aim of adjusting your insurance price accordingly. Drivers who do fewer miles, stick within speed limits, and drive during daylight hours may find their premiums lower than non-black box counterparts.
Users of non-traditional insurance types, such as temporary, subscription, or pay-as-you-go car insurance, were more inclined to use technology such as black boxes for insurance purposes. Less than a fifth (19%) of NAP users were early adopters of technology, compared to just 4% for non-users.
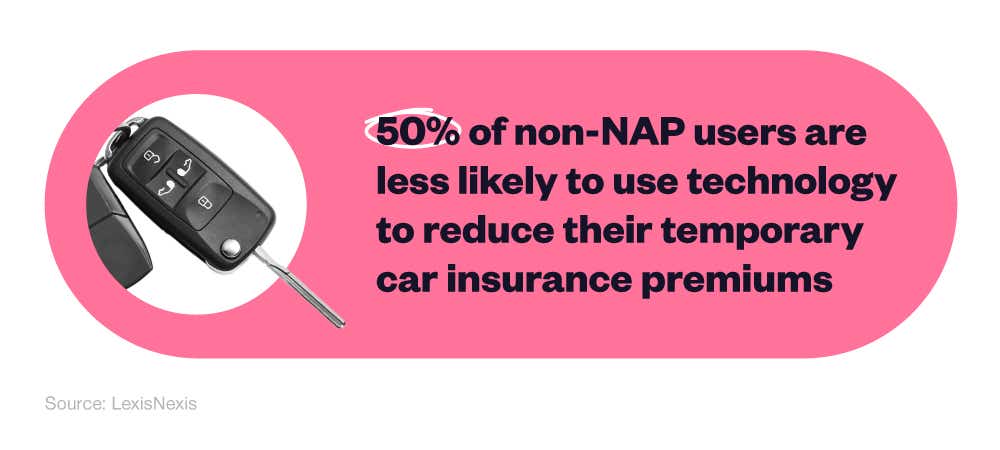
50% of all non-users regarding NAP products were defined as ‘late majority’ adopters, meaning slower than the mean average for technology uptake. The majority of NAP users (38%) identified as ‘early majority’.
Laggards, those who are slow to involve new technologies in their lives, represented 8% of NAP users surveyed. For non-users, that figure was over double that of NAP users, at 19%.
For more information, check out our guide on black boxes, or black box insurance for students if you’re heading to university this year.
UK non-annualised policy statistics regarding consumer awareness and intention
Pay-as-you-go car insurance is a service that utilises black box or app technology, monitoring driver behaviour and increasing or decreasing their monthly costs. Meanwhile, subscription car insurance is a NAP product like temporary car insurance, although it revolves more around the flexibility offered by companies for monthly payments.
Overall awareness of NAP products, such as temporary, subscription, or pay-as-you-go car insurance, was on average a ‘somewhat familiar’ concept to the surveyees, (50%). Only 21% said they were very familiar with NAPs, while 7% were not at all aware.
A breakdown of UK non-annualised policy statistics by customer awareness
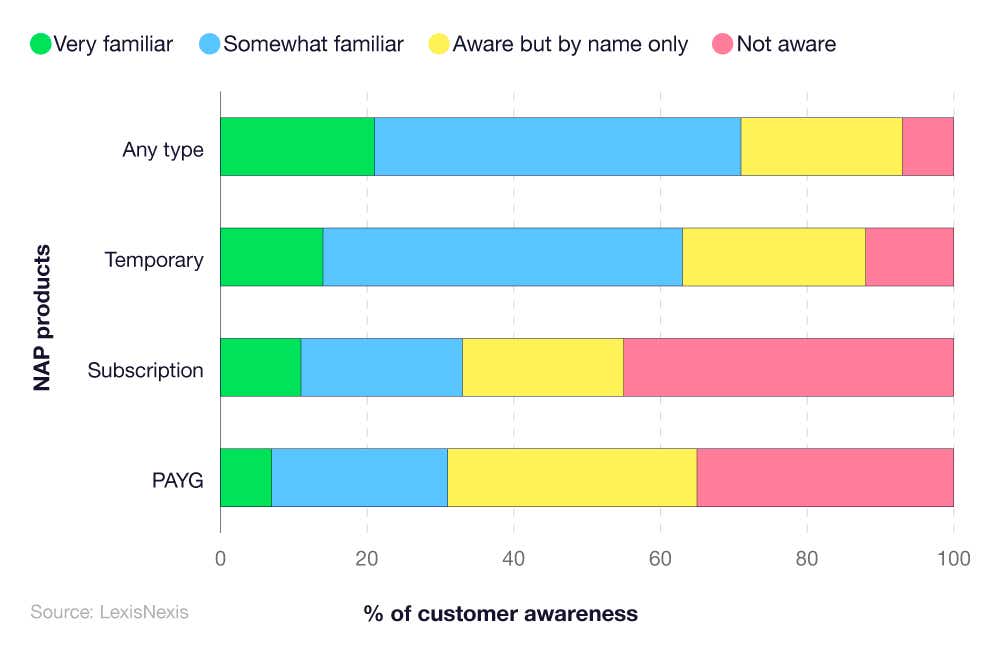
Regarding temporary car insurance specifically, 14% were very familiar, whilst just under half (49%) of people surveyed were somewhat familiar. Just over one in ten (12%) of the surveyees weren’t aware of temporary car insurance at all. Overall, temporary car insurance was the most recognisable, with almost two-thirds (63%) of people familiar, and only 12% not being aware.
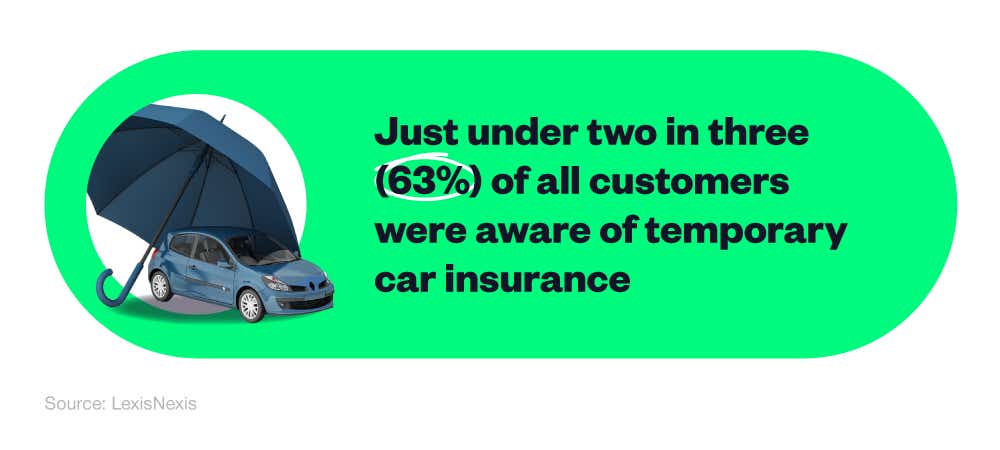
Subscription insurance, another type of non-annualised policy, was the least well-known. A third of people (33%) were somewhat or very familiar, and almost half (45%) were not aware of what subscription insurance was.
Of all surveyees, 7% were very familiar with pay-as-you-go insurance, and 21% somewhat familiar, meaning overall knowledge and awareness of PAYG insurance stands at just 31%. 35% of all consumers were not aware of PAYG insurance.
A breakdown of reasons why people purchase NAP products
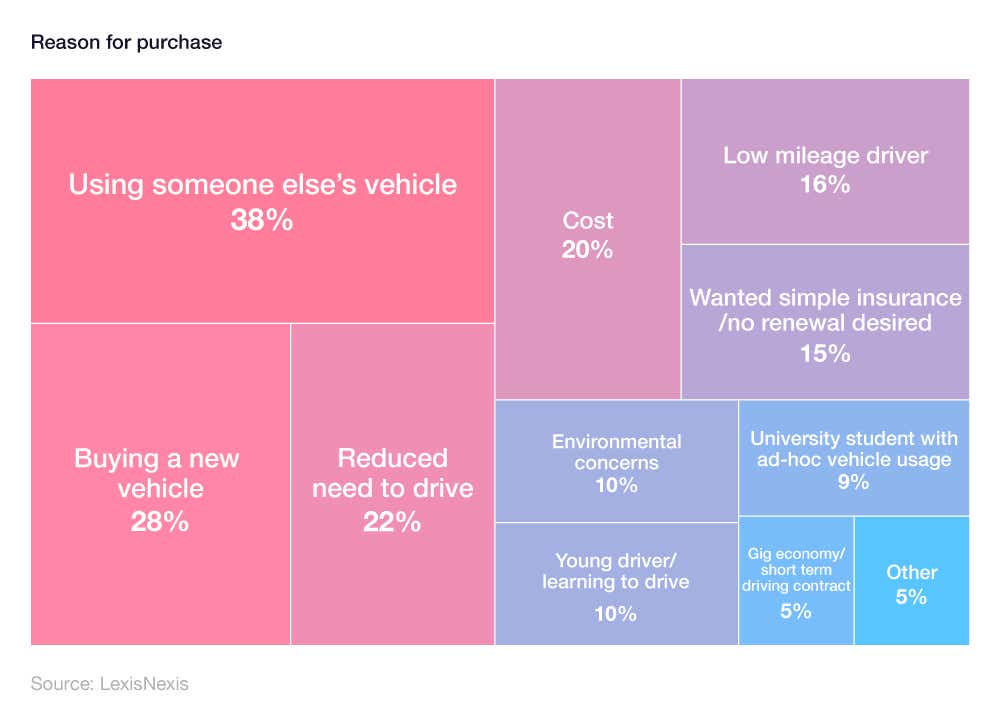
When asked reasons for purchasing a NAP product, almost two in five (38%) of those surveyed responded with ‘using someone else’s vehicle’ (the most popular response). That could involve borrowing a car from a family member or friend where, unlike renting a hire car, you would not be otherwise covered by a form of insurance.
Just under three in 10 (28%) of respondents stated ‘buying a new vehicle’ as a reason to purchase a NAP product. Commonly, after a car purchase, the new owner will drive the car to their respective home. Temporary, or pay-as-you-go, car insurance would cover that short distance.
Further down, more than a fifth (22%) listed ‘reduced need to drive’, while 20% found ‘cost’ to be a motivating factor to purchasing a NAP product. One in six (16%) defined themselves as a ‘low mileage driver’, and as such had no need for annual insurance policies.
Just 5% of all surveyees responded with ‘gig economy/short term driving contract’, which affects rideshare services and short term commercial contracts (such as takeaway deliveries).
How customers purchase their non-annualised policy products
When queried on NAP products in general, over half (51%) of purchasers stated they were looking for one specifically. More than a third (35%) were offered a traditional insurance type, such as an annual policy, and were then suggested a NAP product, whereas 14% weren’t interested in NAP products until offered.
A breakdown of UK non-annualised policy customer purchases and motivations
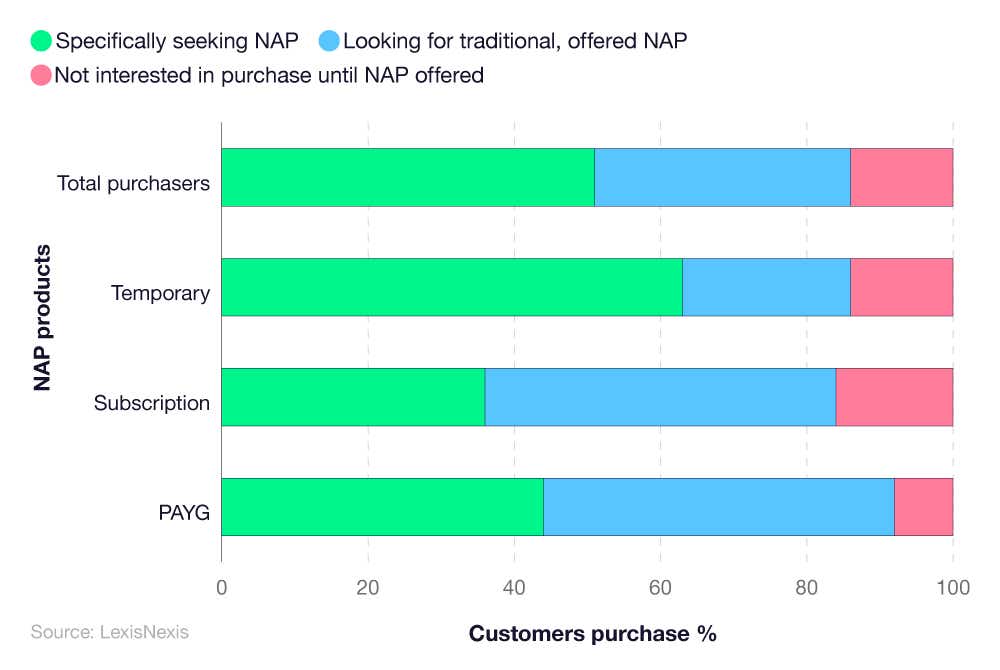
Regarding temporary car insurance, just under two-thirds (63%) of respondents said they were ‘specifically seeking NAP’, 12% more than the overall average result. This indicates a popularity for temporary car insurance within the NAP market. Less than a quarter (23%) were looking for traditional insurance but were instead offered a NAP, while 14% were not interested until a NAP product was offered.
For subscription insurance, only 36% were specifically seeking NAPs, with 16% not interested in a purchase until a NAP product was offered. Likewise, with pay-as-you-go insurance, 44% were specifically seeking NAPs, with 8% not interested until a NAP product was offered. For both insurance types, 48% of consumers were looking for traditional insurance and were instead offered a NAP product.
Consumers who shopped around for non-annualised policies
On average, before buying a NAP product, more than half (56%) of consumers actively shopped around before deciding on a deal. Less than half (45%) of temporary car insurance customers, and more than two-thirds (67%) of customers for both subscription and PAYG insurance, shopped around the insurance market.
Of those actively seeking a better deal on their insurance, 71% received an offer from an insurance company, as opposed to 48% who did not shop around.
A breakdown of non-annualised policy purchase channels
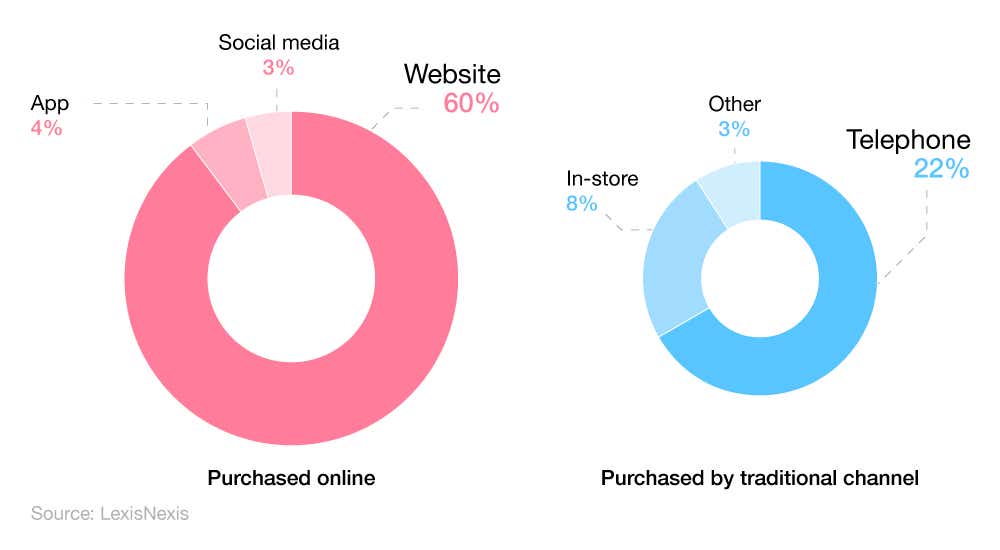
More than two-thirds (67%) of NAP consumers bought online, as opposed to a third (33%) who used traditional methods to secure their insurance. Of that 67%, 60% used a website, 4% used an app, and 3% found the best deal via social media.
Of the 33% of consumers who used traditional purchasing methods for their NAP insurance product, just over a fifth (22%) called up their insurance provider, while 8% visited a store and 3% used another method.
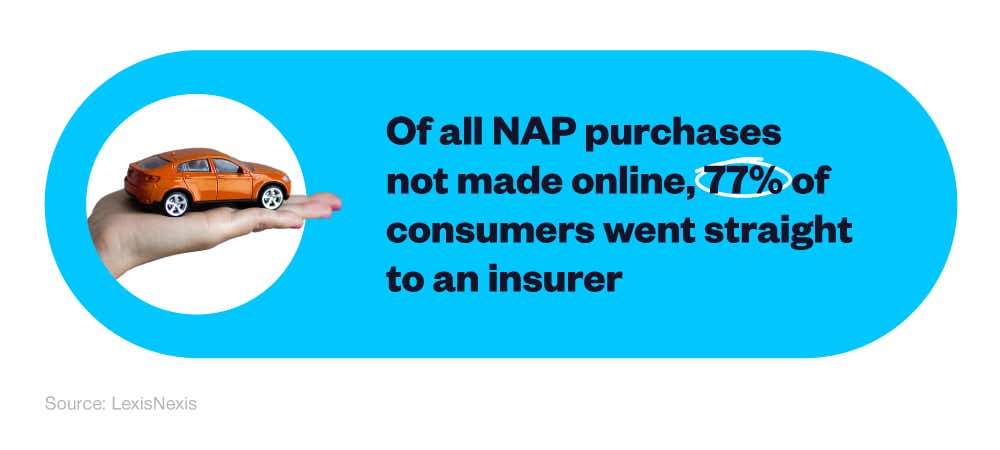
Regarding those who used traditional channels to purchase NAPs, 77% went straight to an insurer as opposed to using a price comparison service
Non-annualised policy statistics by required monitoring
Once purchased, almost two in five (39%) of all NAP consumers were asked by their insurer to track their driving through either a specific monitoring device or a downloaded app. This technology monitors driving behaviour on the road. Within that, more than a quarter (27%) of the apps registered for miles driven, whereas less than a fifth (19%) ranked exclusively on driving behaviour.
Non-annualised policy statistics regarding customer satisfaction
A breakdown of non-annualised policy statistics regarding customer satisfaction
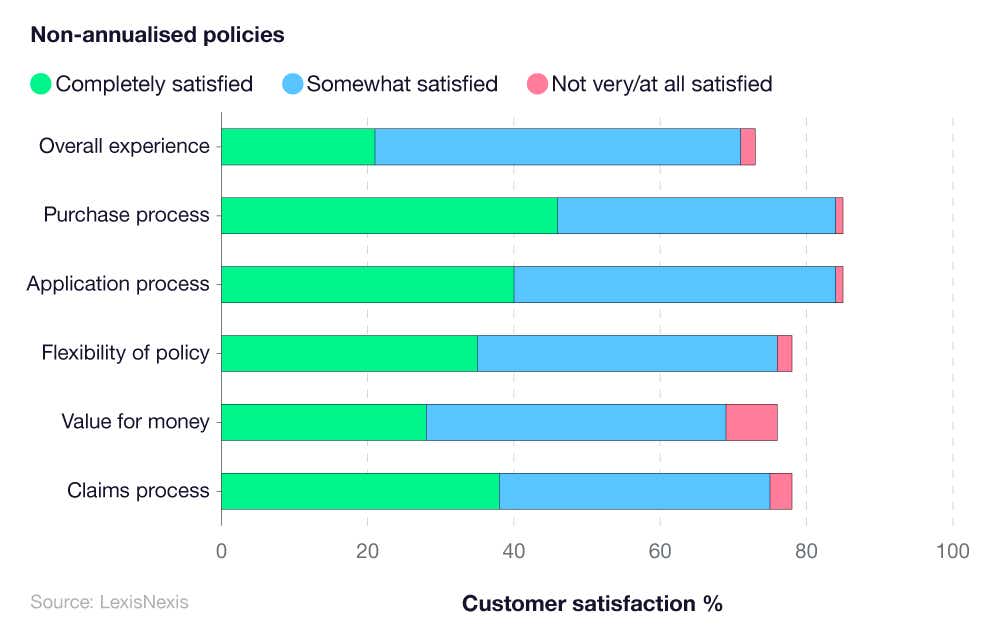
Regarding NAP customer satisfaction statistics, just over a fifth (21%) of consumers were completely satisfied with every aspect of their NAP purchase, with that figure rising to 50% in the ‘somewhat satisfied’ category. Only 2% of respondents were ‘not very/not at all satisfied’.
Half of all respondents were happy with their NAP product purchase, be it temporary car insurance, subscription, or PAYG. The most pressing issue for customers was ‘value for money’, with only 28% of respondents being completely satisfied, 41% being somewhat satisfied and 7% being not very/not at all satisfied.
Satisfaction with policy aspects, split by non-annualised policy type
Temporary car insurance specifically is the most popular type of NAP product, and as such has the best results in terms of customer satisfaction. Overall, less than half (46%) of temporary car insurance holders were completely satisfied with their NAP purchase, with 39% somewhat satisfied and just 2% not very/not at all satisfied.
A breakdown of non-annualised policy statistics regarding customer satisfaction with temporary car insurance
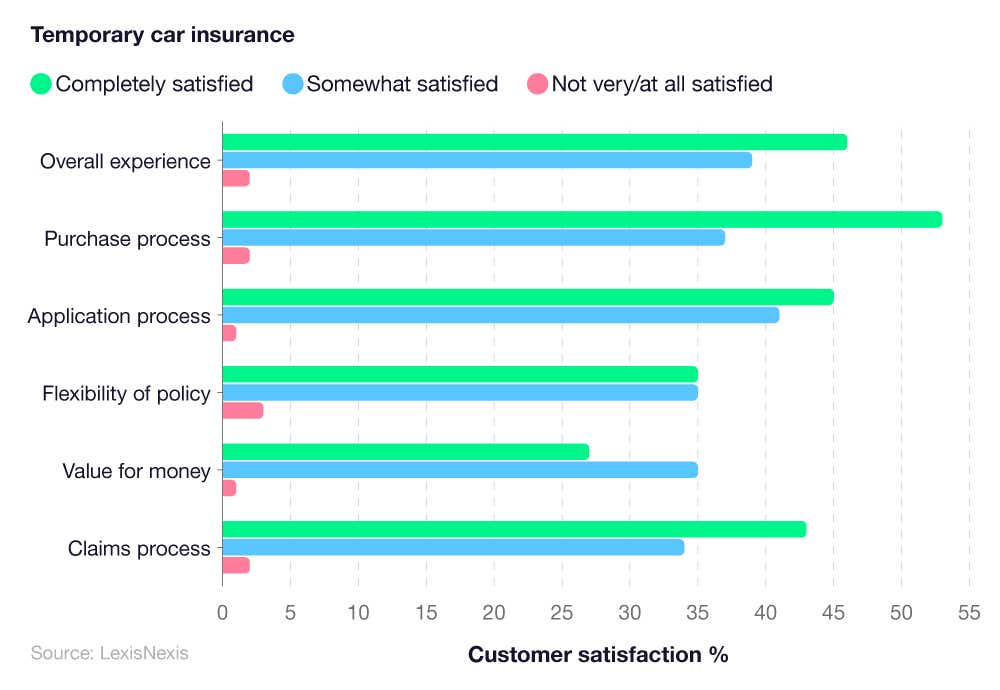
Of all sections, ‘purchase process’ earned the most plaudits from drivers, with more than half (53%) of all NAP purchasers completely satisfied. However, just 27% felt the same way about the value for money of their temporary car insurance deal. 3% were not satisfied at all with the flexibility of their policy.
A breakdown of non-annualised policy statistics regarding customer satisfaction with subscription car insurance
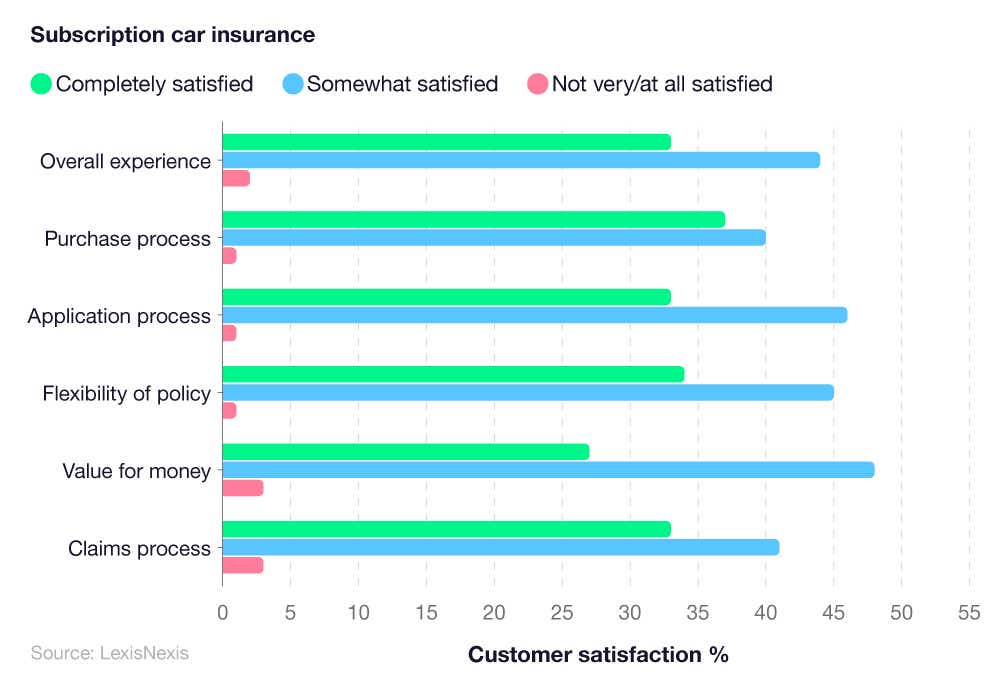
Subscription insurance has the lowest overall ‘completely satisfied’ rating among consumers, at just 33%. According to respondents, the most positive aspect of the experience was the purchase process (37%).
The joint most dissatisfying aspect of subscription insurance was both value for money and the ‘claims process’ (both 3%).
A breakdown of non-annualised policy statistics regarding customer satisfaction with PAYG car insurance
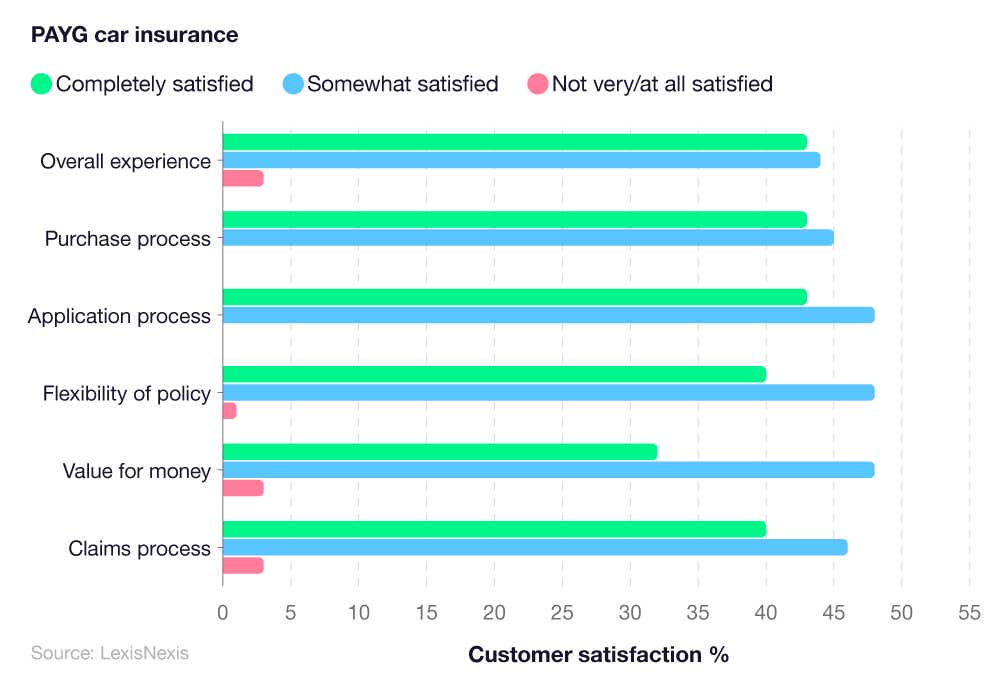
Around two in five (43%) of all PAYG customers were completely satisfied overall with the service and product they received—3% fewer than temporary car insurance but 10% more than that of subscription insurance.
Regarding both purchase process and ‘application process’, PAYG had zero complainants, beating the other NAP products on offer. However, 3% of consumers respectively were dissatisfied with the claims process, the value for money, and the overall experience.
A breakdown of non-annualised policy rate fairness (opinion survey)
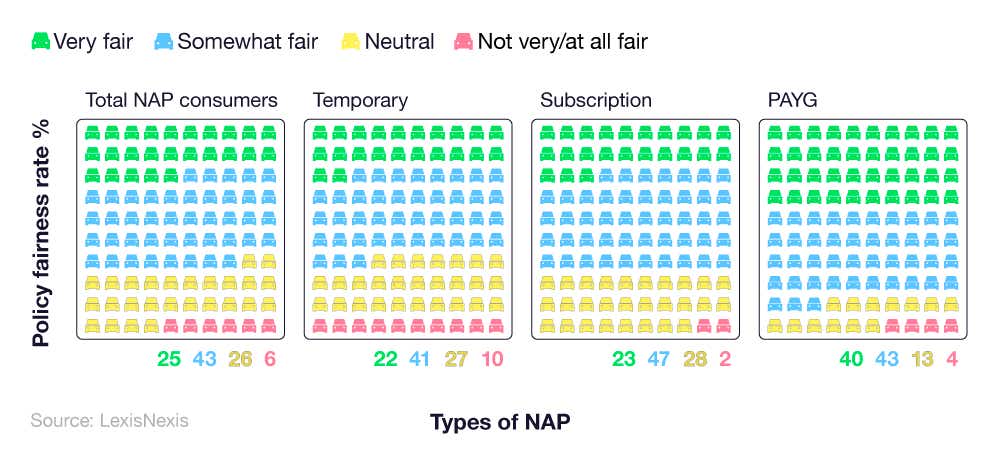
Of all NAP product consumers surveyed, an average of 25% deemed the service and policies ‘very fair’. A majority of 43% felt they were ‘somewhat fair’, while just over a quarter (26%) remained neutral and 6% felt they weren’t very or at all fair.
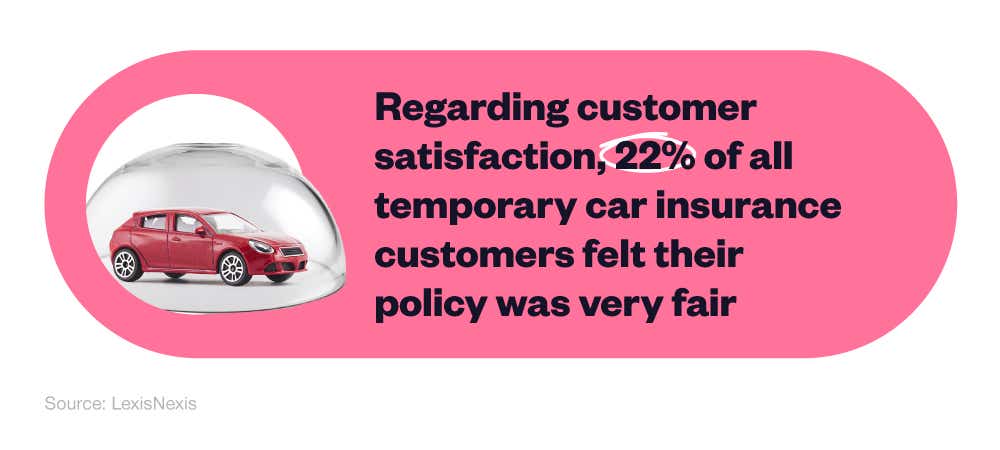
Within the three NAP products of temporary, subscription, and PAYG, the former yields the worst results. Just over a fifth (22%) of all consumers felt temporary car insurance was very fair, 41% said somewhat fair, 27% were neutral, and 10% deemed the service and policies offered not very or at all fair.
Subscription insurance customers felt marginally better than that of temporary car insurance. Less than a quarter (23%) felt it was very fair, almost half (47%) felt somewhat fair, 28% remained neutral and only 2% stated not very or not fair at all. Subscription insurance garnered the least dissatisfied customers.
PAYG customers rated the product highly, with 40% deeming the services and policy very fair. In addition, 43% felt it was somewhat fair, 13% remained neutral and only 4% were not satisfied with their NAP insurance product.
A breakdown of non-annualised policy statistics regarding repeat purchase likelihood
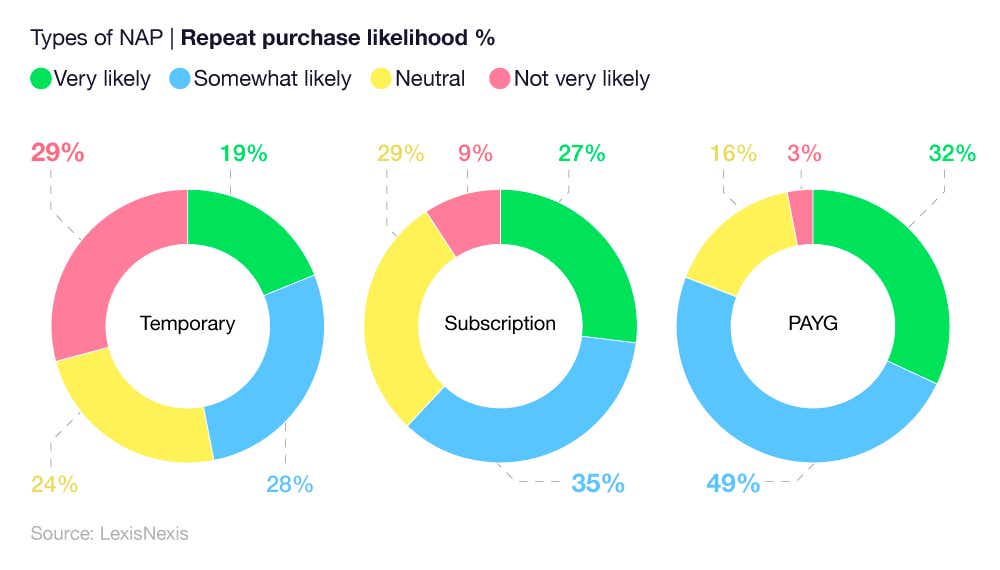
Of all NAP types available, PAYG is the one that survey respondents were most likely to buy again. Almost a third (32%) of participants indicated re-purchase as ‘very likely’, less than half (49%) responded ‘somewhat likely’, 16% were ‘neutral’ and just 3% were ‘not very likely’ to purchase again.
Subscription insurance had a 62% repeat purchase likelihood (27% very likely and 35% somewhat likely). Around one in three (29%) remained neutral, the most of any NAP type measured in the survey. However, 9% found themselves not likely to repurchase subscription insurance.
Temporary insurance had a 19% ‘very likely’ repeat purchase rate, with 28% of people saying it was somewhat likely, and 24% remained neutral. In this survey, temporary insurance had the highest rate of consumers not looking to repeat purchase, at 29%.
Impact of cost of living crisis on temporary car insurance statistics
In the UK, high inflation and especially energy costs have contributed to a cost of living crisis. Up and down the country, households are tightening their belts and looking at easy ways of saving money.
A breakdown of price changes regarding insurance premiums in the UK
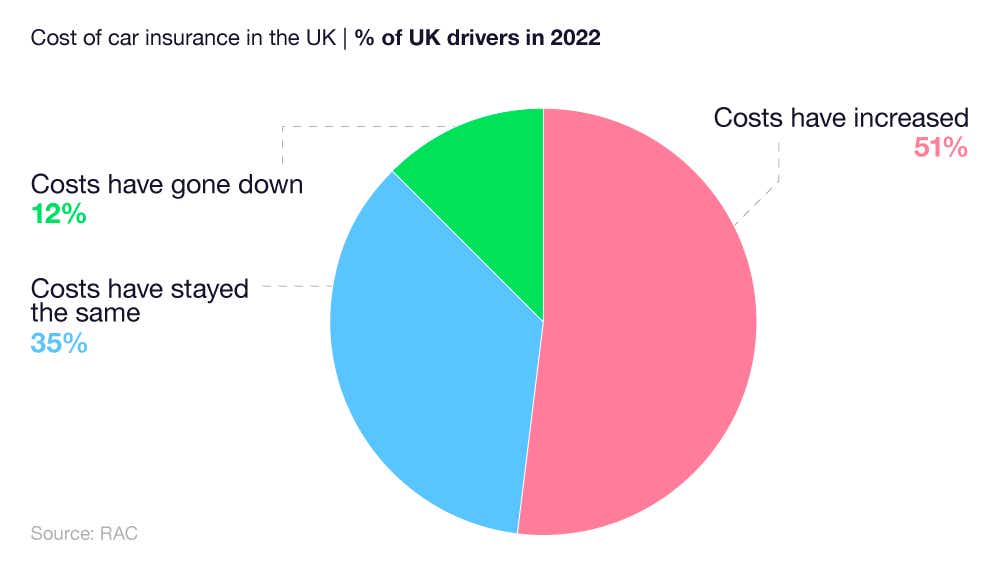
A 2022 RAC survey showed that just over half (51%) of drivers in the UK pay more for their car insurance than in the same period in 2021. Only 12% of drivers stated that their insurance premiums have reduced, while over a third (35%) of consumers found their premiums staying the same.
In terms of vehicle usage for work, the figure for drivers commuting to their job and back has fallen from just under half (49%) pre-pandemic to 41% in mid 2022, an average drop of 8% nationwide. Of that, 13% now only commute to work one day a week in their car, a figure which stood at just 4% pre-pandemic.
FAQs about temporary car insurance
Why can't I get temporary car insurance?
While every company’s policies are different, there are a few reasons as to why you may not be applicable for temporary insurance. This may include:
Serving a driving ban or having prior convictions.
Being too young to be covered by a certain supplier. (Young driver insurance deals may be comparable to temporary car insurance costs, so compare quotes and policy details and see what fits you best).
Not having your licence for a sufficient time.
Trying to insure a vehicle where the risk factor is too high (such as a supercar).
You may also struggle to secure temporary car insurance if you have a record of at-fault claims, although this again depends on the policy specifics of the insurance supplier.
Does paying car insurance monthly affect my credit score?
Paying for annual insurance policies per month does have a positive effect on your credit score, as the bank or lender can clearly see correct repayments are made on time. However, temporary car insurance, as a one-off or non-concurrent purchase, will not have as large an impact on credit scores.
What is pay as you go car insurance
Pay as you go (PAYG) car insurance is where telematics, such as an app or black box, will keep track of your driving behaviour, such as how far you drive and overall driving standard. Your insurance premiums will then be adjusted accordingly. So, the less you drive, and the more attuned you are with road rules, the cheaper it will be. In general, an annual policy will charge a set rate per month, whereas PAYG premiums change depending on how you drive and miles covered. However, it’s worth noting that policies like PAYG do charge a monthly fee for protection of the vehicle against criminal damage or theft.
How long can you have temporary car insurance for
This can change with each insurance provider. The typical limit for temporary insurance is one month, although some companies cap it at 28 days. Some companies will allow periods, such as two months of temporary car insurance. However, some criteria, such as how long you’ve been a licence holder will come into play. Always read the terms and conditions set by your temporary car insurance provider before taking out a policy, and compare different quotes for different policies to ensure you’re getting the best insurance deals out there.
Can I get temporary insurance if I'm younger than 21?
According to UK car insurance statistics 2023, one in four new drivers makes a claim on their insurance, which is why insurance firms lower their prices the older a driver is. Temporary car insurance can be offered from the age of 18, and learner policies affecting 17-year-olds can be purchased. Some insurance providers require drivers to have an unblemished licence, or to have had their licence for at least a year before being offered insurance. Temporary car insurance may be a cheap way for new drivers to get insured.
Does temporary insurance affect no claims?
Drivers who take out temporary car insurance will have a separate policy to any annual policy containing No Claims Discount (NCD). This gives additional flexibility to consumers looking for temporary car insurance. However, your annual car insurance may be affected by accidents that happened under a temporary car insurance policy. Traditionally, insurers will ask if you’ve made ‘any claims’, as opposed to ‘claims on this policy alone’.
Glossary
Black box car insurance
Black box insurance is a variety of telematics insurance, where the insurer provides the prospective driver with a small device to insert either inside or underneath their car. This box is then used to track certain features of driving, such as the average speeds, distance travelled, with some boxes going so far as to judge the driver’s acceleration and braking harshness. Insurers can use this data to either adjust the price or invalidate a policy, depending on the terms and conditions.
Early adopters
An early adopter is someone who’s more likely to upgrade or utilise new technology. For example, those that bought the first smartphones, or the first laptops. They’re ahead of the technological curve.
Early majority
Early majority is where people buy or use new technology slightly faster than the average consumer, but still slower than that of ‘early adopters’.
Late majority
Late majority relates to a group of consumers that buy into or use new technology later than the average person, but not by much.
Laggards
Regarding the use of technology, a laggard relates to a group of people that are not technologically minded. Therefore, they will not be inclined to use technology such as black boxes in their vehicles, even if it results in a lower insurance cost.
Non-annualised policy (NAP)
A NAP product, such as temporary car insurance, pay-as-you-go, and subscription, are all forms of insurance that don’t require you to purchase an entire year’s worth in one go. If you’re a driver who uses their car infrequently, a NAP product may save you money in the long run.
Telematics
Much like black boxes, telematics insurance uses driver information like distance travelled and at what time. The difference is, all information required can be achieved via a mobile app, giving both the insurer, and the driver looking to be insured, added flexibility when taking out a telematics policy. Whereas black boxes were designed specifically for younger drivers, telematics is more widely available.


