Promoted
100 GB of 5G data
24 month contract
£21.00 a monthuntil April 2027then price rises every April in contract by £2.50£899.00 upfront costPrice details
£1453.00 total cost
Roam in 44 destinations
via Samsung Direct
Looking for a new phone contract? We can help you find your ideal handset on a pay monthly plan that suits your needs. Happy with your current phone? Compare SIM only deals instead.
Choosing the right mobile plan for you depends on what best suits your preferences and needs.
A fixed contract provides stability and potential device savings, especially if you want unlimited data. SIM only plans offer greater flexibility and affordability.
For more information, read our ‘SIM only vs pay monthly’ guide
Firstly, consider your usage so you don’t pay for more data than you need and avoid charges for exceeding your allowance.
Next, consider the handset you want. Deals for older and mid-range phones tend to be more affordable than those for the latest models.
For more information, read our ‘How to choose a mobile phone contract’ guide
24 month contract
£1453.00 total cost
Roam in 44 destinations
Brands


Sponsored

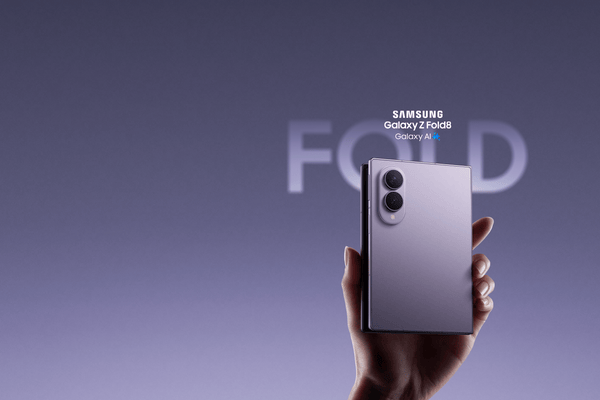
Samsung
Galaxy Z Fold 8 Graphite 256GB


Samsung Galaxy S26
200GB of 5G data
£29.00 upfront
£27.00 per month
until April 2027then price rises every April in contract by £2.50Price details

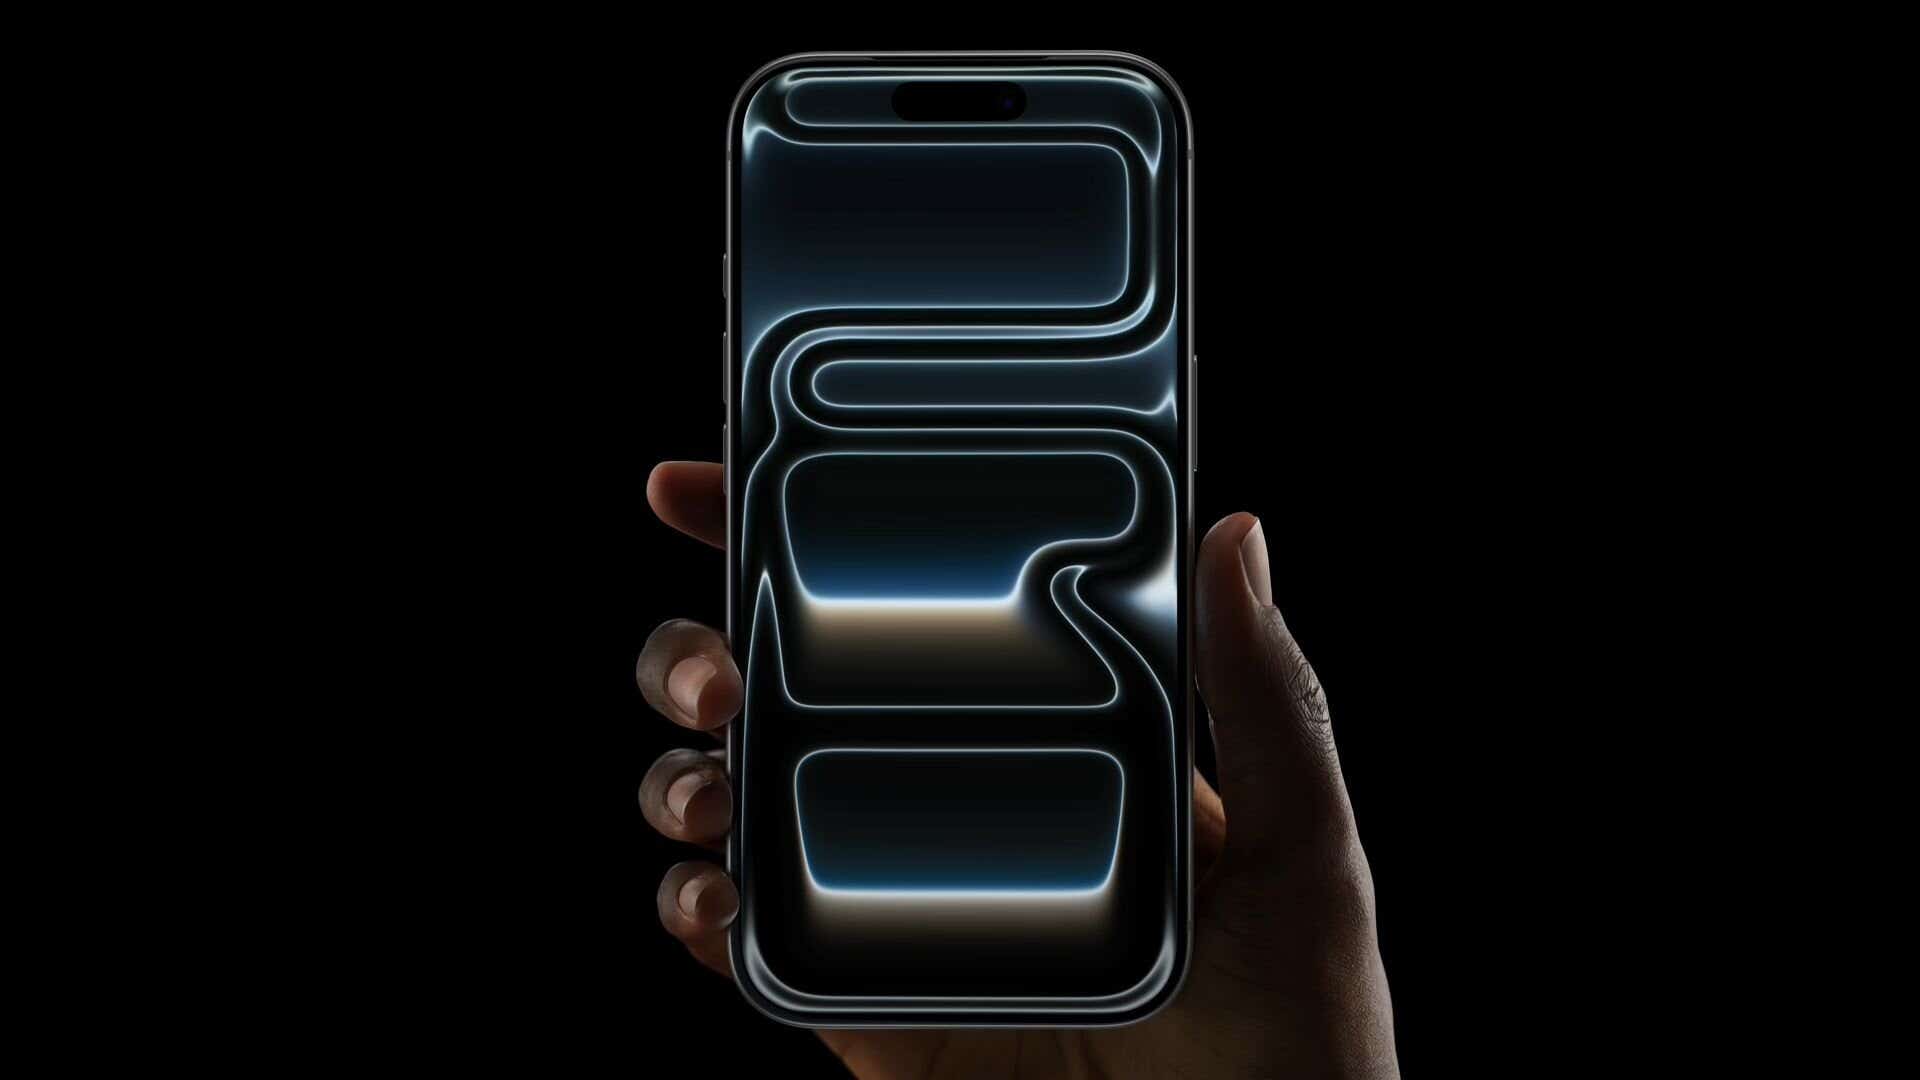
Apple iPhone 17
Unlimited 5G data
£25.00 upfront
£41.00 per month
until April 2027then price rises every April in contract by £2.50Price details
Apple iPhone 17
Unlimited 5G data
£25.00 upfront
£41.00 per month
until April 2027then price rises every April in contract by £2.50Price detailsUswitch services are provided at no cost to you, but we may receive a commission from the companies we refer you to. If a deal is "promoted" on Uswitch's tables, then it has been lent additional visibility as a result of us securing exclusivity on a great deal, or a commercial agreement to showcase what we believe to be market-leading value to consumers. Learn more about how our site works.
*Switching from an ending 24-month handset contract to a SIM-only contract (and keeping your existing handset) could save you £304 (£304.54) per year, or £25.38 per month. This calculation is based on the price of the top selling 24 month handset package in Jan 2024 (Apple iPhone 15 with Unlimited data) against the cheapest equivalent SIM only deal on the Uswitch site as of Jan 2026 (iD Mobile Unlimited Data £15.00 per month, 24 month contract). Correct as of Jan 22 2026. See more here: Uswitch savings
‡This figure is the quoted trade in offer value for an iPhone 17 Pro Max, 256GB, in Excellent condition by Uswitch, Powered by Reboxed, as of February 16th, 2026, & is subject to terms & conditions available here.
Whether you're looking for the latest iPhone, Samsung Galaxy, Google Pixel, or any popular smartphone, we can help you choose a new pay-monthly phone contract.
With Uswitch, you can compare thousands of offers and find the best package to meet your needs with a range of up-to-date deals from all your favourite providers, including O2, Three, Vodafone and more.
Our mobile phone deals include options such as:
Perfect for budget-conscious users, these contracts under £20 offer great value and essential features without the high cost.
Ideal for value-seekers, these Android phone deals offer top features and performance at an affordable price.
Great for speed-lovers, these 5G mobile deals offer faster browsing and streaming without the premium price.
Perfect for savvy shoppers, refurbished iPhones offer premium quality at a lower price. All refurbished phones are fully tested, cleaned, and ready to go.
Ideal for cost-conscious users, these no upfront cost deals let you get a new phone without paying anything today.
Uswitch’s most popular mobile phone deals currently include a selection of top-tier smartphones from your favourite brands, such as:
When selecting a plan, consider how you use your phone to avoid a contract that doesn’t suit your needs. Here are some things to consider:
Whether it is the AI features on the iPhone 17 Pro or the Samsung S26 Ultra, choose a model with all your favourite specs.
Consider how much you’ll use your phone for texting, calling, streaming, or browsing, and pick a package that matches. Not sure how much data you need? Use our mobile data calculator to get a helpful estimate.
Some areas don't have great mobile phone coverage, so check the mobile coverage for your chosen provider before signing up for a pay monthly contract that could tie you in for as long as 36 months.
You pay for the handset and allowances in monthly instalments over the length of your contract. You may have to pay something upfront to help cover the handset cost. If you can afford to pay more upfront, your monthly costs will be lower because you’ll pay less over the duration of your contract. If not, many mobile contracts are available without upfront costs, although you'll likely have to settle for higher monthly prices.
Phone contracts usually last 12 to 36 months. A longer contract allows you to spread the cost over a longer term, so you won’t have to pay as much every month for your phone, but you'll usually pay more in the long run than with shorter contracts.
Uswitch makes comparing mobile prices quick and easy by offering exclusive deals and tariffs you won’t find elsewhere. Uswitch gives you access to top brands and networks like Apple, Samsung, Google, O2, Vodafone, and Tesco. You will find great offers on mobile phone contracts and information on the latest devices, helping you decide when to upgrade.
With a Trustpilot score of 4.7 from over 37,000 reviews, you can trust Uswitch to help you find the best deal. Our commitment to customer satisfaction and industry expertise ensures you’ll receive accurate, reliable advice when comparing mobile phone contracts.
We make finding a new mobile phone pay monthly deal easy by presenting offers from all the major networks, including O2, Vodafone, Sky, Three, iD Mobile, Tesco Mobile, and Talkmobile, on easy-to-compare deal tables.
We offer phones at every stage of their lifecycle—from refurbished models to the latest pre-orders—so you can enjoy tech your way.
We bring you the latest handsets as soon as they launch—and work to secure the best deals even before release.
Our experts live and breathe mobiles, keeping up with new releases, industry changes and exclusive insights, so you always get the latest and best information.
“Switched away from my current provider, O2 after their outrageous renewal offer over to... also O2 but with more of everything for a fraction of the cost. Super easy with Uswitch.”
Here are some of the benefits you can look forward to when you sign up for a pay-monthly phone contract (and a few potential cons to be aware of).
Pay monthly packages are a great way to get the latest phones without paying a lot upfront.
You usually get larger text, call and data allowances than pay-as-you-go deals. Perfect if you’re always on the phone.
There’s no need to fuss with top-ups. You can set up your Direct Debit, and your payments will automatically come from your account.
Your pay-monthly plan may include a reward or gift, such as a subscription to a streaming service. However, consider whether this is a good value before signing up.
Pay monthly contracts typically last 12, 24, or 36 months, so you’re making a long-term financial commitment.
Most networks require you to pass a credit check before you can sign up for a pay-per-month contract.
Since you’re not covering the phone's total cost upfront, you’ll usually pay a little more than if you bought the device outright.
If you’re on the hunt for a budget-friendly mobile phone deal, there are several options to consider:
Flagship models often get the spotlight, but mid-range and budget devices can offer excellent value without breaking the bank. Consider popular options like:
Refurbished phones are a fantastic cost-saving alternative to buying new ones. These devices are pre-owned but have been professionally inspected, tested, and restored to good working condition.
When new versions of last year’s flagship models are released, they often have significant price drops. These phones typically still offer excellent performance and features while being far more affordable, such as the iPhone 15, Samsung Galaxy S23, and Google Pixel 8.
Once you have found a device you are happy with, take advantage of our deals table with filters such as ‘Total Cost’ to ensure you are getting the best and cheapest price.
If you are switching to a new mobile phone plan and want to keep your current number, you can port it over with a few simple steps. All you need is your PAC code. Here's how to get it:
Want to know which mobile provider goes above and beyond for its customers?
Every year, the Uswitch Telecoms Awards celebrate top-performing networks, honouring those that excel in customer support, coverage, roaming, and other key areas.
These industry awards are based on in-depth consumer research and expert evaluations from a panel of tech journalists and industry specialists, making them a true mark of excellence.
Check out the 2026 winners to see which networks stood out across various categories.
| Award | Winner | Decided by |
|---|---|---|
| Mobile Network of the Year | VOXI | Public Choice |
| Best SIM Only Mobile Network | VOXI | Public Choice |
| Best Mobile Network for Customer Service | Tesco Mobile | Public Choice |
| Best Mobile Network for Data | VOXI | Public Choice |
| Best Mobile Network for Roaming | Lebara | Judges' Choice |
| Best Value for Money Mobile Provider | VOXI | Public Choice |
| Best Mobile Network for Perks | Three | Public Choice |
| Most Popular Mobile Network | Lebara | Public Choice + Sales Data |
| Best Mobile Network Coverage | O2 | Powered by Opensignal |
| Fastest Mobile Network Overall | EE | Powered by Opensignal |
| Best Mobile Handset Contract Network | giffgaff | Public Choice |
| Best Mobiles Reseller | Fonehouse | Judges' Choice |
“Find out when your current mobile contract is coming to an end, then plan ahead and shop around. Those upgrade offers on shiny new handsets can be incredibly tempting, but there’s often great value elsewhere.
“Switching from an ending 24-month handset contract to a SIM only contract (and keeping your existing handset) could save you £304 per year, while switching to a new handset contract with a top smartphone could save you £84 per year.
“Even if you’re happy with your current provider, it’s still worth knowing what else is out there. To avoid overpaying - the key is to take action.”
A SIM only deal gives you data, call and text packages without purchasing a handset, making it ideal if you have a phone you're content with. These plans are significantly cheaper than monthly contracts.
Unlike contracts, SIM only plans don't require a long-term commitment, and they often allow changes or cancellations after 30 days. The lack of a lengthy commitment also means simplified credit checks, making it an efficient and fuss-free option.
For more information, check out our ‘What is a SIM only deal and is it better than a pay monthly?’ guide.
Obtaining a new phone contract might not appear as significant as a mortgage or credit card, but it still involves a credit check. Some providers conduct these checks to ensure your ability to meet payment obligations.
Yes. Networks like Smarty and VOXI frequently offer SIM only deals or pay-as-you-go plans, catering to individuals with poor credit.
On the other hand, networks like TalkMobile conduct a 'soft search' on your credit file to confirm your identity without performing a full credit check. For more information, check out our guide on how to get a mobile phone deal with poor credit history.
The upfront cost for a phone contract varies based on the device you opt for. High-end brands often require an upfront payment of at least £50 in addition to the monthly contract payment.
If the initial payment is a concern, alternatives, including contracts with no upfront fees, are available on selected phones.
If you have a contract phone and the contract ends, you've fully paid for the handset and now own it. If you’re happy to keep your handset, you can reduce your monthly bills by opting for a SIM only or pay-as-you-go deal.
Pay monthly customers typically benefit from a standard warranty for their phones. If your phone experiences malfunctions, verify if it's covered under warranty. If not, most networks charge a potentially high cost for repair services.
For handset faults, consider contacting the manufacturers directly. Apple, renowned for its exceptional customer service, offers appointment scheduling at local Apple Stores. Regarding water damage, refer to our guide on how to fix a water-damaged phone.
Text INFO to 85075 to get information about your contract.
If you’re not sure whether you’re still under contract with your provider and whether you would have to pay early termination charges, you can find out without requesting a switching code.