The world of mobile technology is in a perpetual state of evolution, with new trends and models appearing each year, making the old ones seemingly redundant. In this comprehensive analysis, we delve into the dynamic landscape of UK mobile phone market statistics in 2023, highlighting the latest trends that shape the industry as well as comparing mobile phone brands.
This page focuses on the health of the mobile market, looking at how mobile usage compares with that of desktop and other devices, as well as providing a global perspective on how smartphone use and sales vary across the world.
Top 10 UK mobile phone market statistics
Mobile phones account for less than half (46%) of the electronic device market.
Half of the phones sold in the UK are made by Apple.
As of 2023, there are over 85 million mobile subscriptions in the UK.
In 2023, 1,340 million smartphones have been sold worldwide.
In Q2 2023, Samsung sold over eight million more mobile phones than Apple worldwide.
Close to 38% of connections to the Internet came from mobile devices.
Throughout 2022,O2 users spent two-thirds of their mobile time connected to Wi-Fi.
By 2025, the UK mobile phone market is expected to be worth £3.1 billion.
In 2021, a third of the UK population was just using mobile phones to access the internet.
In 2021, there were more mobile sales in greater China than in North America and Europe combined.
UK mobile phone sales statistics 2023
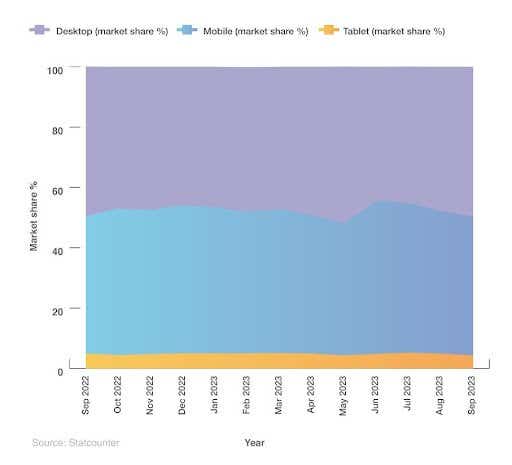
According to Statcounter, mobile phones accounted for almost 46% of the electronic device market in October 2023, compared to just under 50% for desktop computers and less than 5% for tablets.
In April 2022, the mobile phone market share exceeded 50% for the first time (surpassing desktops by around 7%), before falling in the year that followed.
A breakdown of UK electronic devices by market share 2022-23
Since they became more widely available in the UK, the smartphone penetration rate has increased year-on-year, reaching 92% in 2021.
UK mobile market statistics show that in 2016, less than 50% of those aged 55 and over owned a smartphone, which rose to 83% five years later in 2021.
Most popular phone in the UK
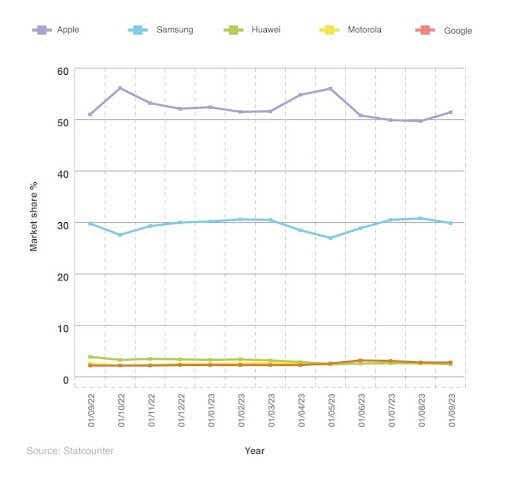
Across mobile phone brands, Apple continues to dominate the UK market. In September 2023, Apple contributed over 50% of UK mobile phone sales, compared to almost 30% for Samsung, and under 3% for Huawei. This means that Apple phones are clearly the most popular phone in the UK.
A breakdown of the market share of the most popular mobile phones in the UK (2022-23)
(Source: Statcounter)
UK mobile phone market statistics show that the popularity of once mainstream brands is in sharp decline. Motorola and Google each accounted for less than 3% of mobile phone brand ownership in 2023, with Nokia at a mere 0.7%.
Throughout 2022 and 2023, Apple’s dominance remained between 49.9% and 56.1%. Samsung remained second behind their technological rivals, with a UK mobile market share of between 27% and 30.8%.
UK mobile phone statistics also show significant disparity in terms of which apps Samsung and Apple users favour. Over 95% of Apple users have downloaded Facebook, whereas that figure is just 73% for Android.
Most common mobile phone brands survey
Mobile phone survey results show that Apple and Samsung followed a similar trend to national figures, with almost four in every five people surveyed having one of these two brands for their mobile phone.
A breakdown of the most common mobile phone brands in the UK
| Mobile phone brand | Percentage |
| Apple | 44.18% |
| Samsung | 35.44% |
| Other, please specify | 5.62% |
| Huawei | 4.77% |
| 3.33% | |
| Motorola | 2.34% |
| Nokia | 1.94% |
| Sony | 1.79% |
| Unsure | 0.60% |
(Source: Uswitch, September 2022. 2,000 respondents)
Over 44% of people owned an Apple mobile, compared to more than 35% for Samsung. Less than 5% had a Huawei mobile, followed by 3% with a Google device.
UK mobile phone market outlook statistics
As of 2021, the total annual UK search revenue was around £11.7 billion, which is more than double that of 2016. Over half (56%) of this can be attributed to mobile phone devices, amounting to £6.6 billion (more than three times the amount for 2016).
| UK | 2016 | 2017 | 2018 | 2019 | 2020 | 2021 |
|---|---|---|---|---|---|---|
| Annual revenue (£bn) | 5.1 | 5.9 | 6.8 | 8 | 8.4 | 12 |
| Mobile share | 38% | 45% | 51% | 57% | 56% | 56% |
| Annual mobile contribution to total annual revenue (£bn) | 1.9 | 2.7 | 3.5 | 4 | 4.7 | 7 |
(Source: Ofcom)
In Q1 2022, mobile phone services generated around £3 billion in retail revenue – a £3 million increase from the previous year (0.1%). The average monthly retail revenue per subscriber was just under £12 in Q1 2022, with postpaid subscribers generating about £10 more per month than prepaid subscribers (£14.36 and £4.87, respectively).
A breakdown of UK mobile subscribers by monthly phone contract and pay-as-you-go
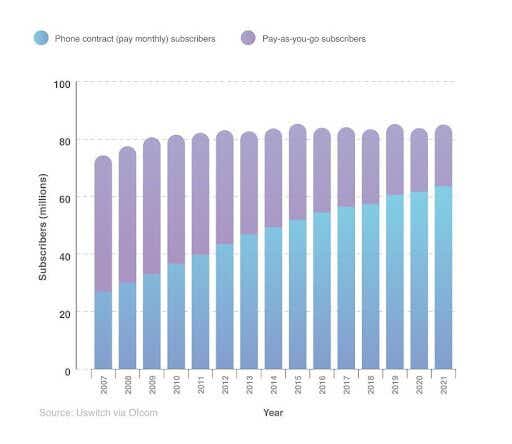
Up until the end of 2021, there were just over 85 million mobile phone subscriptions in the UK. Of these, 75% had a monthly phone contract, equating to more than 63.5 million subscriptions, with over 21 million pay-as-you-go customers nationally.
The number of UK mobile phone subscriptions grew gradually between 2007 and 2021. Some years (notably 2013, 2016, and 2020) saw a decrease in year-on-year numbers, the most being in 2020 by -1.4%. This could have been a consequence of the Covid-19 pandemic, and a resulting change to people’s income around this time.
The number of people on a monthly phone contract has increased yearly since 2007, going from nearly 27 million to over 61 million in 2020. As a percentage of total mobile subscriptions, in 2007, this was 36%. By 2020, this has more than doubled to 73%.
UK mobile phone growth statistics
In Q1 2022, UK mobile phones revenue was just over £3 billion, which was slightly down on Q4 2021.
Since 2018, the vast majority of revenue has been generated by contract bundles (including SIM-only deals), contributing 82% in Q1 2022. Data charges are the next largest category (just over 10%), followed by SMS and MMS (3.5%). If you’re concerned about your data usage, then visit our page on how to limit your data usage to prevent overspending.
A breakdown of the total revenue and number of contract bundles sold in the UK over time
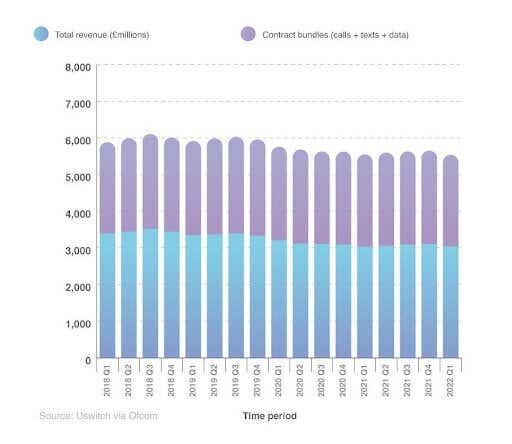
These patterns have largely followed since Q1 2018, however, revenue has slowly decreased quarter-on-quarter. In Q1 2018, mobile phones generated almost £3.4 billion, reaching a peak of over £3.5 billion in Q3 2018. Since then, it has been on a steady decline reaching a low of just over £3 billion in Q1 2021. In all, mobile market statistics indicate that the market has remained relatively stable throughout 2022 and 2023.
A breakdown of predicted UK mobile phone growth in revenue (2022-25)
| Time period | Forecasted total revenue (£millions) |
|---|---|
| 2022 Q2 | 3,136 |
| 2022 Q3 | 3,159 |
| 2022 Q4 | 3,169 |
| 2023 Q1 | 3,173 |
| 2023 Q2 | 3,173 |
| 2023 Q3 | 3,170 |
| 2023 Q4 | 3,165 |
| 2024 Q1 | 3,158 |
| 2024 Q2 | 3,149 |
| 2024 Q3 | 3,140 |
| 2024 Q4 | 3,129 |
| 2025 Q1 | 3,118 |
(Source: Uswitch.com)
Based on the revenue of the mobile phone market between Q1 2018 and Q1 2022 (via Ofcom), we estimate the total revenue of mobile phones in the UK to fluctuate over the coming months and years. Our forecasts predict that it will rise to a peak of £3.173 billion at the beginning of 2023, before gradually decreasing to just over £3.1 billion at the start of 2025.The data shows that the future of mobile phones is not as certain as many would presume
Global mobile phone market statistics
Ever since the first smartphones hit the mobile phone market in the early 1990s, the number of smartphone users has continued to grow. In 2014, this figure surpassed three billion for the first time.
After a small dip in smartphone users in 2018, the number has since recovered. In 2021, the number of smartphone users exceeded four billion for the first ever. Global mobile phone market statistics show that as of 2023 there are 4.6 billion smartphone users worldwide.
The sale of new smartphones seems to have plateaued at around 1.5 billion units per year, largely due to a growing demand for used and refurbished devices.
In terms of value, it’s estimated that the global market for used phones is somewhere between £39-52 billion.
In 2021, smartphones reached almost 6.3 billion units (a 43% increase from 2016). This number exceeded 6.5 billion at the end of 2022. Predictions estimate that by 2027, there will be 7.7 billion smartphones spread across the globe.
A breakdown of the number of smartphones in circulation over time
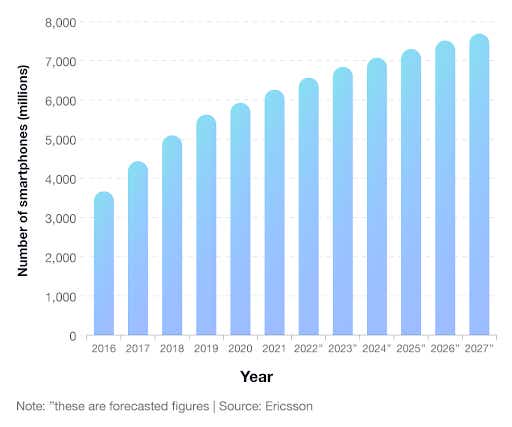
Perhaps unsurprisingly, the highly-populated countries of China, India, and the USA have the highest number of smartphone users. There is room for future expansion, given that the penetration rates for these countries are below 70% in China and India, and over 80% in the USA.
The world’s leading mobile phone manufacturers are Samsung and Apple. These two companies alone account for about half of all global smartphone shipments.
A breakdown of global mobile phone unit sales over time
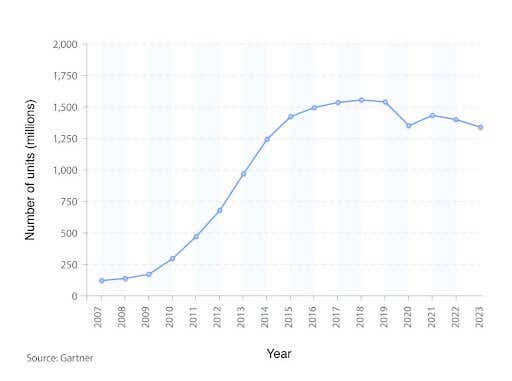
Global smartphone sales exceeded 1.4 billion in 2021. However, this was 122 million less than the peak of over 1.56 billion in 2018.
In 2022, the number of smartphones sold dipped below 1.4 billion, for only the second time in eight years. This number reduced again in 2023, by around 4%.
In 2016, less than half of the world’s population owned a smart device, yet the global smartphone penetration rate had reached over three-quarters (78%) by 2020.
Mobile phone market statistics by country
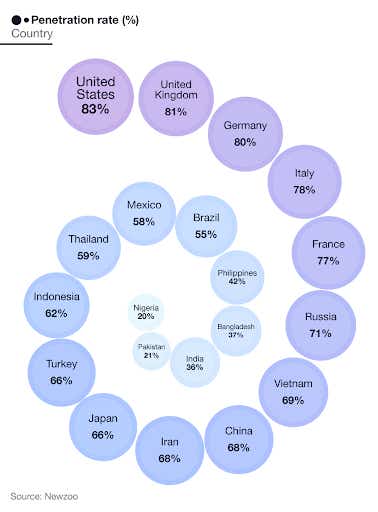
In 2021, China had more smartphone users than any other country in the world, with over 950 million. India followed in second place, with almost half as many as China (492 million).
Most advanced economies of the world have a smartphone penetration rate of over 70%. This generally applies to European countries and the USA from those countries with the most smartphone users.
A breakdown of mobile phone penetration rates for different countries of the world in 2022
A breakdown of the countries with the most smartphone users
| Country | Number of smartphone users (millions) | Population (millions) |
|---|---|---|
| China | 953.55 | 1,402 |
| India | 492.78 | 1,380 |
| United States | 273.76 | 330 |
| Indonesia | 170.4 | 274 |
| Brazil | 118.53 | 213 |
| Russia | 102.21 | 144 |
| Japan | 83.03 | 126 |
| Mexico | 74.78 | 129 |
| Vietnam | 66.9 | 97 |
| Germany | 66.15 | 83 |
| Bangladesh | 61.34 | 165 |
| Iran | 57.19 | 84 |
| Turkey | 55.14 | 84 |
| United Kingdom | 54.45 | 67 |
| France | 51.52 | 67 |
| Pakistan | 47.1 | 221 |
| Italy | 46.51 | 60 |
| Philippines | 45.91 | 110 |
| Nigeria | 41.69 | 206 |
| Thailand | 41.47 | 70 |
(Source: Newzoo)
The USA has the highest penetration rate of smartphones (83%). Nations, such as Nigeria and Pakistan, are located towards the bottom of the list, with around one in five people using a smartphone.
Cost of mobile phone statistics by country
In 2021, a smartphone’s average selling price (ASP) was around £275, a rise of £30 from 2016. Fortunately, the diversity in the mobile phone market now means there are a variety of offers available for consumers, ranging from cheap mobile phone deals to more expensive models, such as the Samsung Galaxy Fold, which retails at around £1,700.
Different brands provide products under contrasting economic circumstances depending on where you are in the world. This means the pricing of mobile phones can vary considerably from region to region. For example, in 2019 in Latin America, 58% of all smartphones sold for $199 (£172) or less compared to 83% of those shipped to Africa.
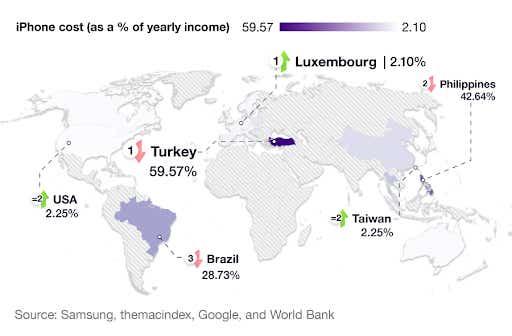
A breakdown of iPhone 14 Pro costs as a percentage of yearly income for different countries in the world
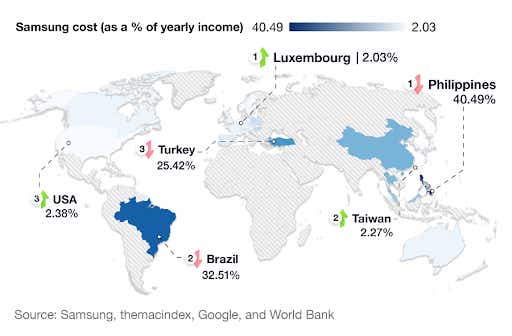
A breakdown of Samsung S22 Ultra costs as a percentage of yearly income for different countries in the world
Most expensive countries in the world to purchase iPhone 14 Pro and Samsung S22
As a percentage of yearly income, Turkey is the most expensive place in the world to afford an iPhone 14 Pro. With a median income of just over £6,000 a year, the average person will need to save almost 60% of their annual salary in order to purchase the new iPhone 14 Pro. Buying this make and model in Turkey will set you back over £3,600 – the most expensive out of all the countries in our study.
The second most expensive country to buy an iPhone is the Philippines, which has the lowest average income out of all 32 countries in our study at just over £2,700 a year. To afford an iPhone 14 Pro, the average person will need to save almost 43% of their yearly salary.
Brazil is the third most expensive country to purchase an iPhone 14 Pro based on salary. With an income of just under £4,900 (the third lowest), the new iPhone 14 Pro will set you back over £1,400 (the third most expensive). This means almost a third (29%) of the average Brazilian’s income is needed to make this purchase.
Incidentally, these three countries are also the most expensive countries in the world to purchase the new Samsung S22 Ultra 256GB, as a percentage of average income. Those in the Philippines will need to save over 40% of their annual take home pay, compared to almost a third (32.5%) in Brazil, and just over a quarter (25.4%) for Turkish citizens.
Most affordable countries in the world to purchase iPhone 14 Pro and Samsung S22 Ultra
By contrast, Luxembourg is the most affordable place in the world to live in if you want to purchase either the iPhone 14 Pro or Samsung S22 Ultra. With a median income of almost £58,000 per year, this is the highest in our study (and over 20 times more than the average Filipino earns). This means you only need to save around 2% of your income to buy either the iPhone 14 Pro or Samsung S22 Ultra..
Taiwan is the second most affordable country for purchasing the iPhone 14 Pro or the Samsung S22 Ultra. With an average income of over £47,000, and relatively low prices of around £1,000 per model, Taiwanese citizens can expect to save around 2.25% of their income in order to buy the iPhone 14 Pro or Samsung S22 Ultra.
The USA is marginally behind in third place, with 2.25% of income required for the iPhone 14 Pro, and almost 2.4% for the Samsung S22 Ultra.
Global mobile phone sale statistics by region
In 2021, more smartphones were sold in Greater China than in any other region in the world, at almost 410 million units. In previous years, annual global smartphone sales reached around 1.5 billion, but dropped to around 1.38 billion in 2020 due to the Covid-19 pandemic.
A breakdown of global mobile phone sales in different regions of the world
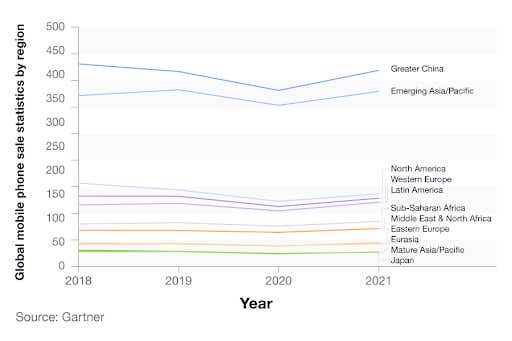
By 2021, sales had returned to over 1.5 billion units again, with just over a quarter (26%) coming from Greater China, less than a quarter (24%) from Emerging Asian and Pacific countries, and just under 10% from North America.
Global internet access by mobile and other devices
In 2021, a third of the UK population was just using mobile phones to access the internet. Only 6% solely used their computers for their internet usage, compared to 61% who used a combination of computer and mobile.
A breakdown of global internet access by mobile and other devices for different countries of the world
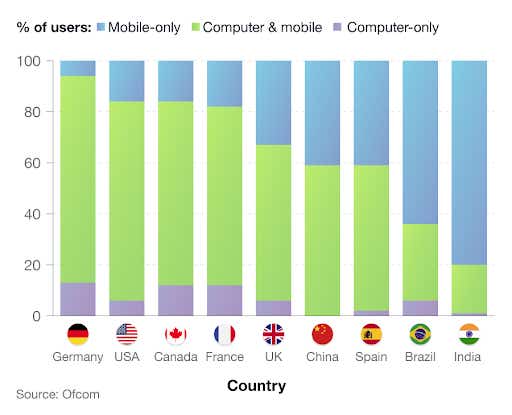
By contrast, 80% of India’s population only used their mobile for internet access, compared to just 6% in Germany. Mobiles were also the primary source of internet usage in Brazil. However, for the vast majority of countries, a combination of mobile and computer is the preferred method.
Global mobile phone market share 2023
In terms of global market share, Samsung reigns supreme, occupying 20% in Q2 2023 compared to 17% for Apple.
Since 2020, Samsung has dominated the market with figures around 20%. Although in Q4 2021, it was knocked off its perch by Apple, whose market share reached 22%, while Samsung’s share was just 19%. This only lasted one quarter, as by Q1 2022, Samsung had returned to the top once again.
A breakdown of the global mobile phone market by company 2020 to 2023
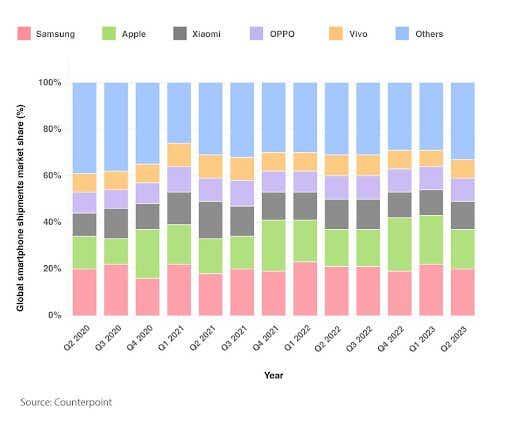
Globally, Chinese smartphone manufacturer, Xiaomi, remains the third most popular mobile phone brand, occupying at least 11% of the market between 2020 and 2023. In Q3 2021, its market occupation was just one percentage point less than Apple.
A breakdown of the global shipment of smartphone over time by company
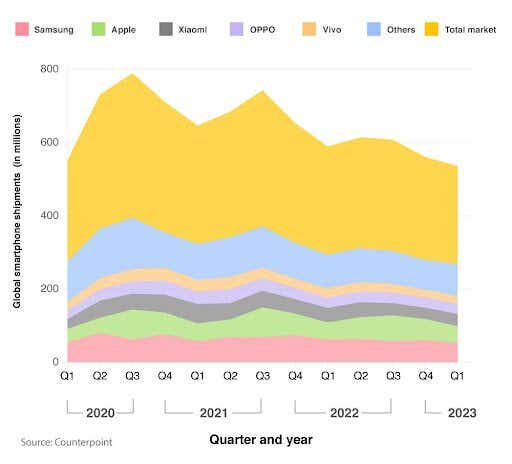
The global smartphone market fluctuated significantly between 2021 to 2023. In Q4 2021 smartphone shipments were as high as 371.4 million, yet come Q2 2023, shipments decreased by over a quarter (27%), to £268 million. Samsung’s shipments also dramatically decreased during this period. Despite performing strongly in the years prior, their sales dropped from 74.5 million to 53.5 million.
Since 2010, Samsung has generally been the best mobile phone manufacturer in terms of sales. However, in Q4 2021, Apple briefly usurped Samsung selling 81 million copies compared to Samsung’s 69 million. This reversal was largely thanks to iPhone 13 series sales.
Over time, Apple’s smartphone sales have been relatively cyclical in nature, and peaked in the fourth quarter each year. In Q4 2021, just under a quarter of all new smartphones sold were iPhones, which has a considerable effect on mobile phone global market share statistics.
A similar feat occurred in Q4 2022 when Apple sold close to 12 million more smartphones than Samsung. This is thought to have generated revenue for Apple in the region of $192 billion (£167 billion).
Samsung mobile phone market share 2022
Since 2009, Samsung and Apple have remained part of the top five smartphone companies in the world. With new models and attractive deals on Samsung devices, this has made it a consistent forerunner in the global mobile phone market .
In Q1 2022, it accounted for almost a quarter of the market, up from 19% the previous quarter. From the inception of the Samsung Galaxy in 2009, Samsung’s global market share has grown from 3% to over 32% in 2012.
A breakdown of Samsung’s share of the global shipping market over time
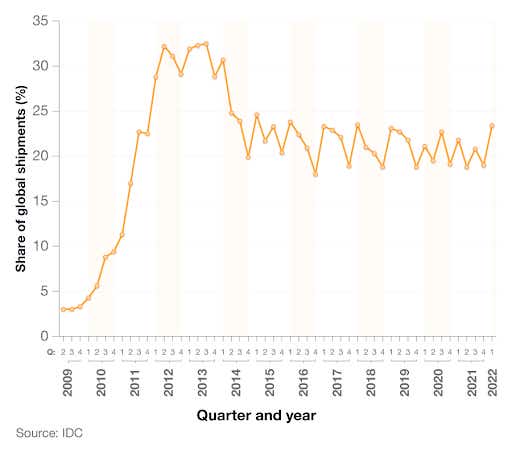
By contrast, in 2007, Nokia led the industry with around 50%. However, this dropped to a low of 3% in 2013.
Apple mobile phone market share 2022
By April 2022, the Apple operating system iOS occupied almost half (47%) of the UK mobile market, down from just over 50% the previous year.
In Q1 2022, Apple claimed less than a fifth (18%) of the smartphone market (5% behind rivals Samsung). Large quarterly fluctuations in revenue are normal for Apple. However, 2017 saw two consecutive quarters in which they generated less than $30 billion (£26 billion) in revenue from the iPhone.
In Q2 2022, Apple generated over $50 billion (£43 billion) in revenue from iPhone sales. This has proven to be one of the biggest successes in the smartphone industry. Since 2007, when it was first introduced to the mobile phone market, Apple has sold more than 1.5 billion smartphone units worldwide. Since then, newer technologies and various iPhone deals have made Apple one of the most desirable brands in the world.
In Q1 2009, iPhone sales contributed to around a quarter (25%) of Apple’s income. By Q2 2015, this figure was almost 70% (around $40 billion or £35 billion). Between 2010 and 2020, Apple sales quadrupled, from around 55 million to over 200 million, with more than 90 million iPhones sold in Q4 2020 alone.
It’s worth noting that these figures are only on the sale of brand new phones, and therefore doesn’t include sales for refurbished iPhones. During 2021, refurbished smartphones saw a 15% year-on-year increase, with Apple leading the way at 40% of the market.
If you’re considering purchasing a refurbished mobile, as opposed to a brand new one, our guide to buying a refurbished phone will provide you with helpful hints and tips to ensure you buy the phone that is right for you.
UK mobile phone market FAQs
When did smartphones come out?
The history of the mobile phone began back in 1985, when Motorola released the Dynatac 8000X, affectionately known as the brick. However, the concept of a smartphone has evolved over time, but one of the earliest commercially available smartphones was the IBM Simon Personal Communicator, which was released in 1994. It had features like a touchscreen interface and the ability to make calls, send faxes, emails, and even had basic apps. However, it was not as widely adopted as modern smartphones.
The modern era of smartphones, characterised by devices like the iPhone and Android smartphones, began in the late 2000s. The original iPhone was released by Apple in 2007, and Android smartphones started gaining popularity around the same time.
What are smartphones used for?
Smartphones are versatile handheld devices that are used for a wide range of purposes. These include communication, internet browsing, sending and checking emails, using social media as well as gaming and photography.
How much was the first smartphone?
Widely considered to be the first of the modern smartphones, the price of the original iphone varied depending on storage capabilities. The initial price for the 4GB model was $499 in the United States, whereas the 8GB was priced at $599.
How many smartphones are there in the world?
As of 2023, there are 16.8 billion smartphones in the world. This figure has grown by close to a fifth (19.2%) since 2020. The number of smartphones is expected to continue to rise, with estimates suggesting that there will be 18.2 billion by 2025.
What percentage of the world population own a smartphone
Currently, 6.92 billion people globally own a smartphone. This is equivalent to 85.8% of the world’s overall population.
Methodology and sources
https://www.statista.com/statistics/788557/global-average-selling-price-smartphones/
https://www.ofcom.org.uk/about-ofcom/latest/media/media-releases/2020/uk-internet-use-surges
https://www.statista.com/statistics/288562/uk-mobile-network-annual-retail-revenues-by-call-type/
https://www.statista.com/statistics/288571/uk-mobile-network-quarterly-call-volume-by-call-type/
https://gs.statcounter.com/platform-market-share/desktop-mobile-tablet/united-kingdom
https://www.ofcom.org.uk/__data/assets/pdf_file/0018/264600/mobile-matters-2023-report.pdf
https://www.ofcom.org.uk/research-and-data/multi-sector-research/cmr/2023/interactive
https://www.statista.com/statistics/1285042/uk-daily-time-spent-mobile-usage/
https://www.statista.com/statistics/466240/mobile-phone-use-by-frequency-of-calling-in-the-uk/
https://www.ofcom.org.uk/about-ofcom/latest/features-and-news/decade-of-digital-dependency
https://www.statista.com/statistics/300452/mobile-phone-use-to-go-online-uk/
https://www.ofcom.org.uk/__data/assets/pdf_file/0013/220414/online-nation-2021-report.pdf
https://www.ofcom.org.uk/__data/assets/pdf_file/0023/238361/online-nation-2022-report.pdf
https://www.counterpointresearch.com/global-smartphone-share/
https://www.statista.com/statistics/271492/global-market-share-held-by-leading-smartphone-vendors/
https://www.statista.com/statistics/276477/global-market-share-held-by-samsung-smartphones/
https://www.statista.com/statistics/216459/global-market-share-of-apple-iphone/
https://www.statista.com/statistics/330695/number-of-smartphone-users-worldwide/
https://www.statista.com/statistics/748053/worldwide-top-countries-smartphone-users/
https://www.statista.com/statistics/539395/smartphone-penetration-worldwide-by-country/
https://www.statista.com/statistics/263437/global-smartphone-sales-to-end-users-since-2007/
https://www.statista.com/statistics/755388/global-smartphone-unit-sales-by-region/
https://www.counterpointresearch.com/refurbished-smartphone-market-2021-infographic/
https://www.statista.com/statistics/263402/apples-iphone-revenue-since-3rd-quarter-2007/
https://www.counterpointresearch.com/refurbished-smartphone-market-2021-infographic/


