- Uswitch.com>
- Mobiles>
- Studies >
- UK Mobile Phone Statistics 2024 - Stats Report
UK mobile phone statistics, 2023

Smartphones have become commonplace since the late 2000s, with more than nine in 10 (92%) UK mobile users now owning a smartphone, as of October 2023. However, the origin of these devices can be traced back to the early 1990s.
Our research allows us to compare mobile data over time and analyse trends to judge how UK mobile statistics have evolved in recent years.
Top 10 UK mobile phone statistics 2023
In 2022, 86% of people used their mobile to go online, compared to 28% in 2009.
Almost all (98%) UK adults aged 16-24 now have a smartphone.
Close to four in ten people (39%) use their mobile for gaming.
Between 2021 and 2022, the number of minutes spent making phone calls in the UK decreased by 9.2%
In March 2022, the number of active UK mobile subscriptions was over 83 million.
According to data from 2022, two in five people play games on their mobile.
As of 2023, half of all nine-year-olds in the UK own a smartphone.
Data from 2022 shows that one in 20 adults with a mobile plays Candy Crush Saga.
In 2022, close to a third (32.1%) of mobile users are very satisfied with their network provider.
A survey from September 2022, showed that 38% of people update their mobile every two years.
UK mobile phone user statistics
At the start of 2022, there were 71.8 million mobile connections in the UK (4.2 million more than the UK population) – an increase of 3.8% from 2021 (around 2.6 million). This is likely because many people will have more than one connection registered to them (i.e. personal and work phones).
By 2025, it’s predicted that the UK population will reach 68.3 million, and that 95% (roughly 65 million people) will be smartphone users.
A breakdown of UK age groups over time and the percentages that own a smartphone
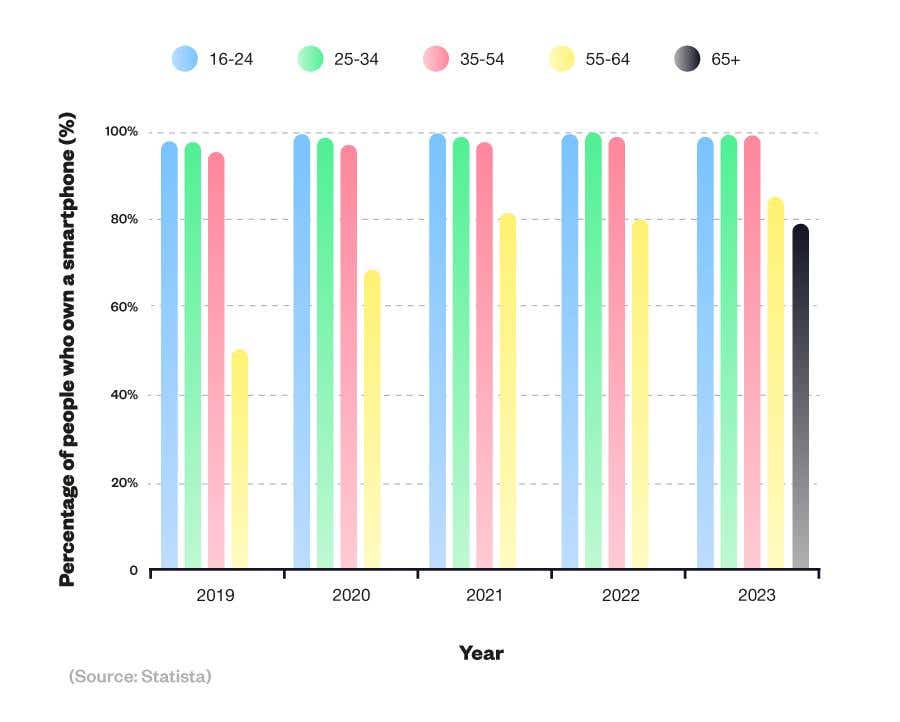
Mobile phone user statistics show that, as of 2023, 98% of all adults aged 16-24 in the UK have a smartphone. Among the older age groups, 86% of those aged 55-64 owned a smartphone device compared to 80% aged 65 and above.
These figures have increased dramatically since 2012, when only two-thirds (66%) of 16-24 year-olds had a smartphone. In 2012, only 5% of people in the 55+ age bracket owned a smartphone, compared to 60% of 25-34-year-olds.
UK mobile subscribers statistics
From the turn of the millennium, UK mobile subscriber numbers steadily increased from just over 43 million to a peak of 85.3 million in Q3 2015.
A breakdown of UK mobile cellular subscriptions over time (2007-2022)
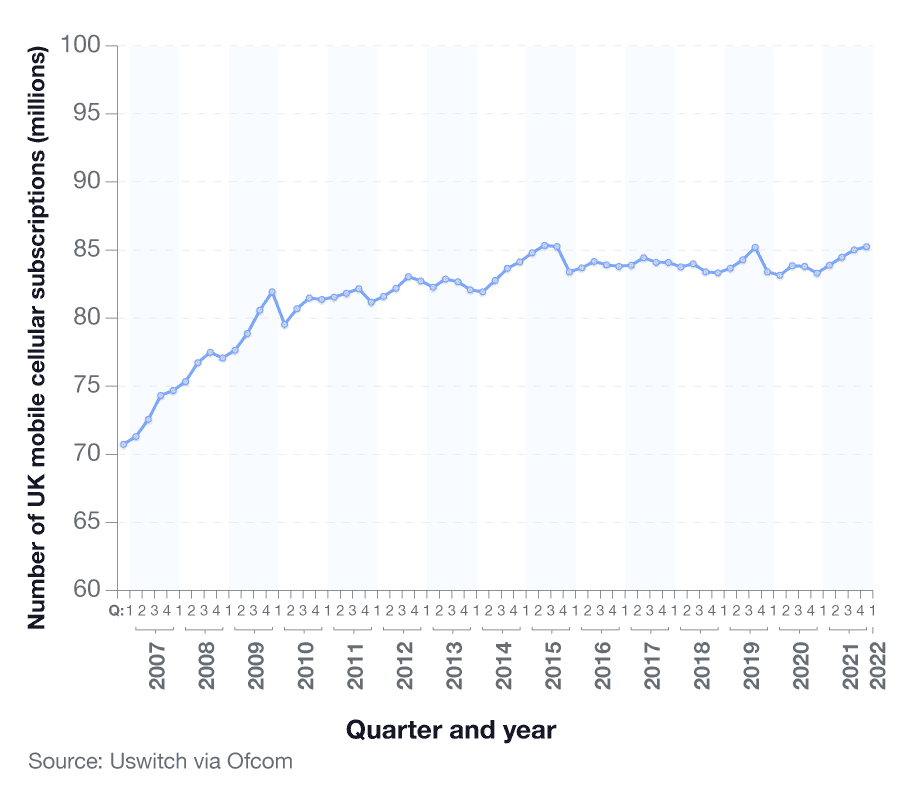
From the turn of the millennium, the number of UK mobile phone subscriptions has steadily increased from just over 43 million in 2000 to a peak of 85.3 million in Q3 2015.
At the end of March 2022, the number of active UK mobile subscriptions, excluding machine-to-machine (M2M), was 83.25 million. This was an increase of about 2% from March 2021. Over the same time period, the number of dedicated mobile broadband subscriptions also increased from 4.7 million to 5 million.
This refers to mobile device technology that enables the exchange of information without the need for human assistance.
A breakdown of UK mobile cellular subscriptions per 100 inhabitants over time
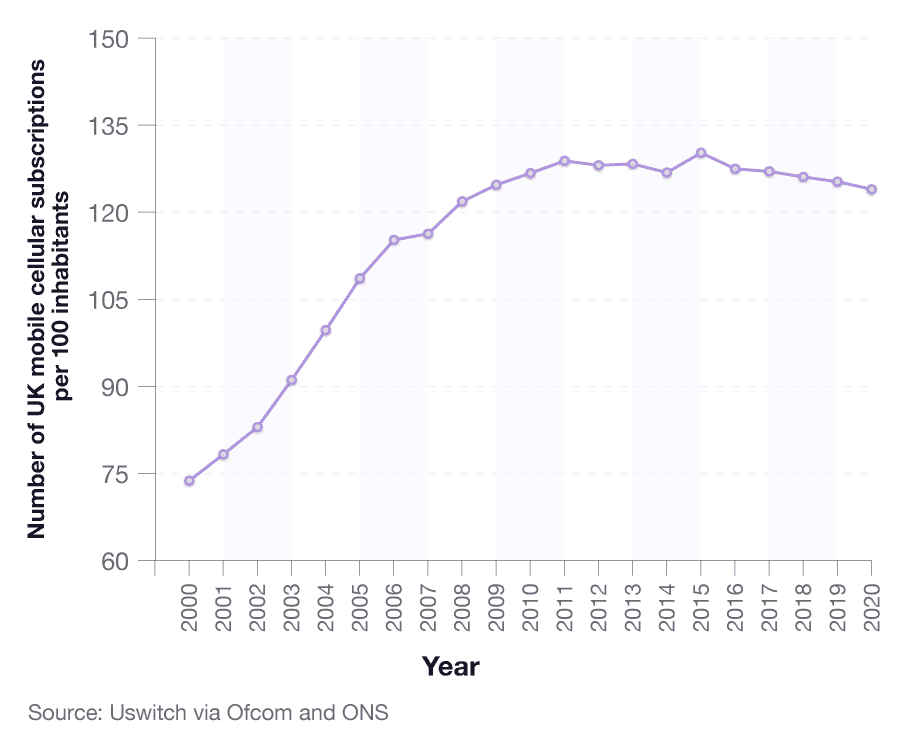
When broken down by population, there were over 73 mobile phone subscriptions per 100 UK inhabitants in 2000, rising to a peak of 122.9 per 100 inhabitants in 2008. By 2020, this dropped to 117.82 mobile phone subscriptions per 100 people, before increasing up to 118.6 by 2021.
UK mobile contract cost statistics
When choosing a mobile phone it is vital to consider how expensive the contract might be. And there are many factors that can affect the average cost of a customer’s mobile phone contract, such as:
The type of phone they own
The provider their contract is with
Where in the country they are located.
Average phone contract price based on location
Between August 2022 and August 2023 a significant number of people took out mobile phone contracts through Uswitch. The average cost of a mobile phone contract during this period was £903.48
The location with the highest average cost per mobile phone user was Ilford. The 101 Uswitch customers in the East London area paid on average £1,036 between August 2022 and August 2023. This equated to 13.7% more than the national average.
Residents in Harrow paid around £2 less on their mobile contract compared to mobile users in Ilford.
Southampton and Wolverhampton are the only postcode areas where users typically pay more than £1,000 for a mobile phone contract in a 12-month period.
A breakdown of the top 10 postcode areas with the most expensive mobile phone contract (2022-23)
(Source: Uswitch)
*Note, only areas with 10 or more registered users between August 2022 and August 2023 were included in the final stats.
The area with the most new mobile phone users between August 2022 and August 2023 was Edinburgh. Throughout the 12-month period, the city’s mobile phone users were also paying the highest average contract costs in Scotland, with residents in the Scottish capital paying 8.4% more than mobile users in nearby Glasgow.
In terms of highest total mobile phone costs, London paid the most between 2022 and 2023. In total, Uswitch customers in London paid £901,895 for their mobile phone bills, largely due to the fact that London has almost a third (31%) more mobile phone users than the second most populous area, Birmingham.
A breakdown of the top 10 postcode areas with the least expensive average mobile phone contract (2022-23)
(Source: Uswitch)
At the other end of the spectrum, mobile users in Haverhill are spending less on their contract price than anywhere else. Typically, they pay £745.52 over their contract – around a quarter (23.6%) less than mobile users in Wembley spend on their average phone contracts.
Mobile users in Winchester had the second lowest average costs in our study. Throughout the year, residents here paid £26 more for their mobile phone contract than users in Haverhill.
Mobile users in Coatbridge had the lowest average mobile phone bill in Scotland. Residents here typically pay around 1.3% less for their mobile contract than those in Perth.
Of the UK areas with the lowest average costs for mobile phone contracts, half are outside of England. In Wales, Neath had the lowest average contract cost in 2022-23, with the average mobile contract costing £780.66 over the contract.
Carrickfergus had the lowest costs in Northern Ireland, with the average Uswitch customer paying £780.55 for their mobile contract.
To find out which cities spend the most on mobile data, check out our mobile data calculator.
Average phone contract price based on type of phone
Typically, Apple’s iPhone 14 Pro Max users have the highest average mobile contract price in the country. Released in September 2022, Uswitch customers who took out a contract for the mobile pay an average of £1,506. This is around two-thirds (68%) more than the cost of the average mobile contract in the UK.
The Apple iPhone 15 Pro Max has the second highest contract, costing 3% less than the 14 Pro Max.
The third most expensive phone for contract cost, and the most expensive Samsung on our list, is the Samsung Galaxy Z Fold 4. Users pay an average of £1,406 for their mobile contract, which is actually £14 more than users of the next most expensive Samsung, the Samsung Galaxy Z Fold 5.
A breakdown of the top 10 mobile phones with the most expensive average mobile phone bill
(Source: Uswitch)
Apple’s iPhone 13 Pro Max had the next most expensive average mobile phone bill on our list. Users of the phone paid 111% more on average for their contract than owners of the least expensive iPhone, the iPhone 8.
Within the top 10 most expensive mobile phone contracts, six are iPhones and four are Samsung phones.
The most popular phone in the top 10 is the Apple iPhone 14, which had 2,275 new users between 2022 and 2023, based on our data. This is almost 1,500 more than the next most popular phone in the top 10, the iPhone 14 Pro. Incidentally, the Apple iPhone 14 is also the least expensive, on average, from our study.
Paying too much for your mobile phone contract? Look to compare cheap mobile phones to see how we can save you money.
A breakdown of the bottom 10 mobile phone users with the cheapest average mobile phone bill
(Source: Uswitch)
The mobile with the lowest average mobile phone bill was the Samsung Galaxy A13. Even though it was released in March 2022, the Samsung Galaxy A13 boasted an average cost per user of just £358.68 between August 2022 and August 2023, making it one of the best phones for value. This is 123% less than what users of the most expensive Samsung paid.
The least expensive Apple phone from our study is the iPhone 8. Used by just 52 Uswitch customers between 2022 and 2023, the average mobile bill for an iPhone 8 is 77% less than what the UK average mobile user pays.
The list of the top 10 cheapest mobiles includes two Honor phones, as well as the Google Pixel 6a. Boasting over 300 new Uswitch users between 2022 and 2023, a Google Pixel 6a mobile contract is £95 a year less expensive on average than the Google Pixel 7a.
Average phone contract price based on service provider
The service provider with the highest average phone contract price between 2022 and 2023 was Sky Mobile. Sky’s average cost per user was £1,360, which was 40% more than what the UK average mobile phone user paid between 2022 and 2023.
The second most expensive is EE, with users typically paying £115 less than customers of Sky Mobile.
(Source: Uswitch)
In terms of users, Mobile Phones Direct is the most popular, with 4,194 Uswitch new customers taking out a contract with the provider between 2022 and 2023. Mobile Phones Direct customers paid an average of £894.79 for their mobile phone contract between August 2022 and August 2023 – just £9 less than what the UK average mobile phone customer paid in the same period.
Tesco’s 19 Uswitch customers paid on average £620.56 across the year, around £740 less than typical Sky mobile’s customers. This equates to a saving of £61 each month, or £14 a week by comparison.
Remember, switching your mobile phone provider can be a great way of saving you money on your monthly mobile contract.
Mobile phone usage statistics
Smartphones have multiple uses and functions. From using search engines to checking emails, from accessing social networks to contacting friends and family, consumers around the world spend time on their mobile phones on various activities.
A recent Uswitch screentime report found that UK adults spend half of every day in front of a screen, with overall screen time increasing by two hours since the start of 2020.
UK mobile phone usage statistics: Phone calls
According to Ofcom, the number of mobile-originated voice call minutes decreased by 5.4% in 2022 to 42.3 billion minutes, year-on-year. Also, mobile phone statistics show that in the same period, landline calls decreased by 11.3%, to 8.4 billion minutes.
In 2022, mobile phone usage statistics show that the volume of on-net UK mobile calls exceeded 49 billion minutes. However, off-net mobile calls occupied the majority of calls in 2021, with over 75.91 billion minutes (an increase of almost 47 billion minutes from 2007). Q4 2022 alone amounted to 12.4 billion on-net calls and 18.9 billion off-net calls.
Overall, the number of minutes people in the UK are spending making phone calls is down 9.2% compared to 2021.
A breakdown of mobile phone usage by types of phone calls and messages in the UK
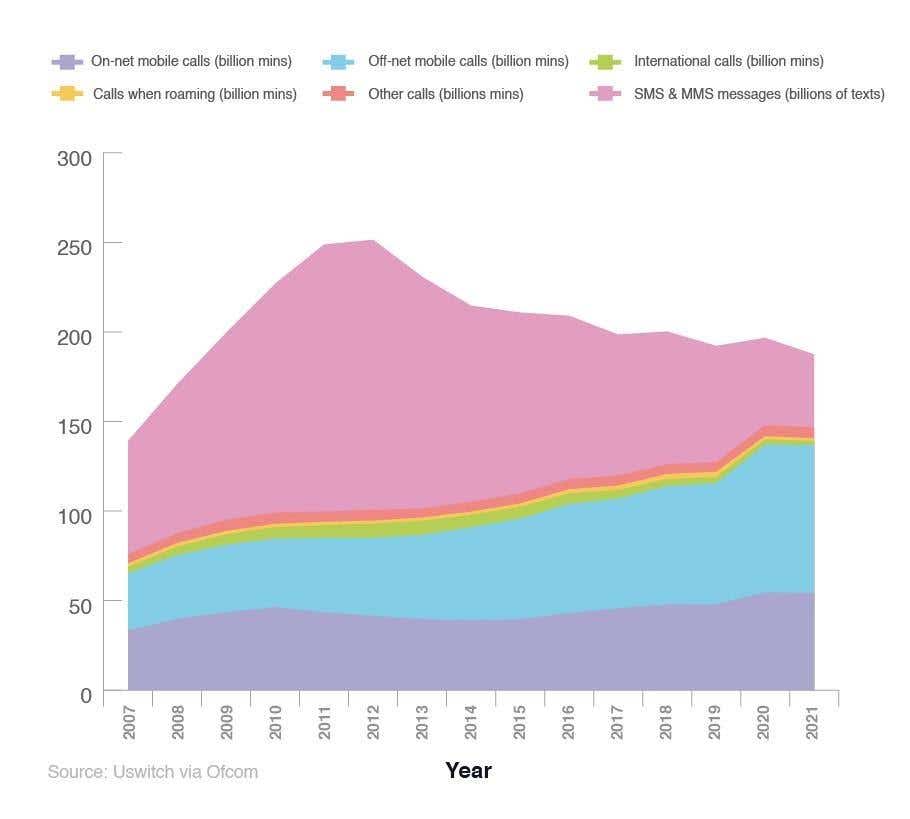
The number of UK international calls has decreased, from a peak of 7.93 billion minutes in 2013 to just 1.76 billion in 2022. This could be due to a number of factors, such as cost, plus the advancement of Wi-Fi technologies around the world which make it easier and more convenient to call, without the additional charges. Apps (such as Zoom, WhatsApp, and FaceTime) also make it possible to also see the person you’re talking to without having to directly pay for it, which is an added benefit for a lot of people.
Between February 2019 and February 2020, the daily use of online calls was marginally lower than mobile voice calls (31% vs 38%, respectively). The average length of a UK standard mobile call increased by almost two minutes from March to April 2020 (the first six weeks of the Covid-19 lockdown in England) to five minutes 26 seconds. In 2021, the figure fell back down to pre-pandemic levels, with the average call lasting three minutes and 40 seconds.
Another mobile phone fact is that there has been a dramatic decrease in messaging in recent years. Over 100 billion annual texts were sent between 2009 and 2015. However, since then, the number has rapidly dropped year-on-year, to 36.4 billion in 2022. Again, this could be attributed to the rise of online alternatives, such as WhatsApp and Facebook Messenger, to contact people.
(Source: Ofcom)
In 2021, people in England and Scotland spent marginally longer on voice calls compared to Wales and Northern Ireland, by around 15 seconds. There was very little difference between those in rural and urban areas, with those living in the UK countryside making calls an average of five seconds longer than those in UK cities.
a breakdown of the length of mobile phone calls across different time periods in the UK

Mobile phone statistics show that 71% of voice calls in 2021 were under five minutes, compared to 77% in 2020 post-lockdown. In 2021, the vast majority of phone calls (59%) were under 90 seconds, with just 4% greater or equal to 20 minutes.
One of the reasons why fewer people may be spending less time making phone calls, is that 4G and 5G coverage is getting better and better. This makes it easier for mobile phone users to text or use messaging apps as opposed to making phone calls.
Frequency of mobile phone usage statistics
In 2021, UK mobile phone users spent an average of four hours per day on their devices. This is an increase of 0.3 hours in previous years, which has steadily increased since 2019.
According to a 2021 Ofcom survey, the amount of time people spend on their smartphones is increasing year-by-year:
People in the UK check their smartphone, on average, every 12 minutes of the waking day.
Two in five adults (40%) look at their phone within five minutes of waking up.
This figure reaches 65% for those aged 35 and under.
Similarly, 37% of adults check their phone five minutes before going to sleep.
For under-35s, this figure rises to 60%.

Mobile phone stats covering frequency of mobile phone usage show a relatively even split between males and females. In 2019, males were slightly more likely to use their mobiles to make several calls a day, with almost half (49%) doing this compared to 46% of females. However, less than a quarter (24%) of females claimed to make daily calls compared to a fifth (21%) of males. Only 1% of males and 1% of females surveyed admitted to never using their mobile phones to make calls.
UK mobile phone usage statistics by internet access
Between 2009 and 2022, the percentage of UK internet smartphone users more than tripled.
A breakdown of the percentage of people who use their mobile phone to go online

By 2022, 86% of people who use mobile phones do so to access the internet (a 207% increase on figures from 2009).
UK smartphone usage statistics by age
In 2022, (under a fifth (18%) of internet users accessed the internet exclusively from their smartphone. This is 3% less than the percentage in 2021, which stood at 21%.
When broken down into groups, over a fifth (21%) of those aged 45-54 only used their devices to access the internet – the most of any age group. Conversely, only 12% of the over 65s used their smartphones to solely access the web.
(Source: Ofcom)
Over a quarter (27%) of financially vulnerable people were likely to only use their smartphone to access the internet, compared to 19% for those financially secure and just 11% for those with a financial surplus.
Women were also more likely than men to be smartphone-only internet users, with 24% compared to 18% of men.
A breakdown of the UK’s digital population by device and age group
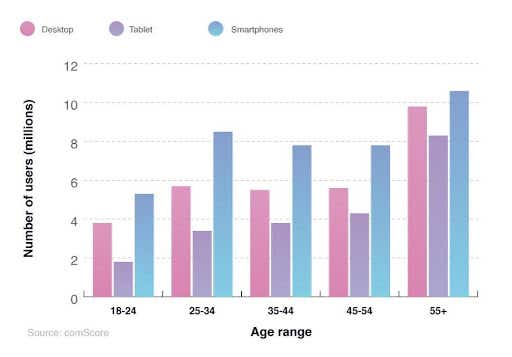
As of March 2021, the UK digital population accounted for approximately 40 million unique users on smartphones, compared to 21.6 million tablet users, and 30.4 million desktop users.
The over 55s dominate the different age groups, with 10.6 million unique smartphone users, compared to just 5.3 million for those aged 18-24.
UK mobile phone use statistics by operating system
When comparing the most-used apps by operating system, YouTube is more popular on Android devices compared to iPhones.
YouTube can be found on 75% of Android phones, compared to just 62% of iPhones. In contrast, WhatsApp is used on 89% of iPhones, but only 86% of their Android counterparts.
Google Play, Google Search, Gmail and YouTube all come pre-installed on Android devices, whereas Apple Weather and Apple Maps are the only pre-installed apps on iPhones. This could account for their respective high reach percentages.
A breakdown of mobile phone application use between Android and iPhone users
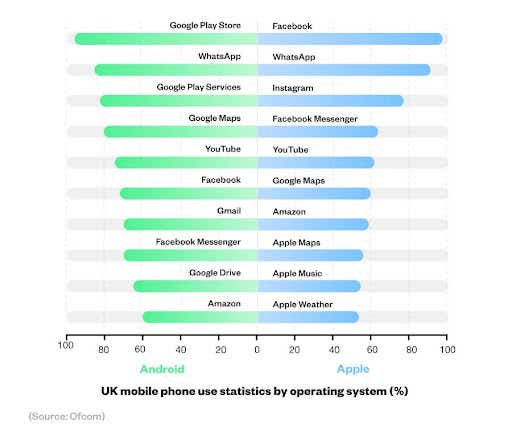
Mobile phone OS statistics showcase that six of the top 10 apps on Android are owned by Alphabet, and two are owned by Facebook, compared to two and four, respectively, on iPhones.
When comparing figures from 2019, WhatsApp has seen its reach increase by 22 percentage points on Android and 44 percentage points on iPhones.
Conversely, Snapchat was the second most used iPhone app in 2019, with 81% of users having the social media app, yet now it’s dropped out of the top ten, meaning fewer than 54% of iPhone users have the app.
UK mobile market statistics reveal that half of all phones sold in the UK are made by Apple.
What people use their mobile phone for
When Marty Cooper made the first mobile phone call in 1973, even he couldn’t imagine how the technology would evolve. His goal was that the mobile phone would be “something that would represent an individual, so you could assign a number not to a place, not to a desk, not to a home, but to a person.”
We’ve gone far beyond that now. Mobile phones are more than just a tool for calls and messages but a camera, newspaper, and gameboy all rolled into one.
Most popular apps in the UK
According to Ofcom’s 2022 Online Nation Report, approximately 42.5 million UK adults (94% of the online adult population) used applications (apps) on their smartphone or tablet devices.
By comparison, around 39.9 million (88% of the adult online population) use apps purely on their smartphones.
A breakdown of mobile phone applications by adult reach population and time spent using them

In 2021, YouTube was the most popular app across all UK mobile devices, reaching almost 32 million people (75% of the online adult population). However, by 2022, the video streaming site had been dethroned, with Facebook and Messenger now the most used app. 94% of adults made use of Facebook in 2022, two percentage points more than those who used YouTube.
The third most popular app in 2022 was WhatsApp. In all, 82% of adults used the app, a growth of ten percentage points compared to the year before. What’s more, WhatsApp had quite an even spread of users in regards to age, with 19% of users aged between 25-34, 18% aged 45-54, and 31% aged over 55.
The fourth most used app is Instagram, with close to three-quarters (73%) of mobile users having the app. There is a fairly significant gender disparity in regards to who uses the app – 54% of all Instagram users are female.
X, formerly known as Twitter, also expanded its reach in 2022. Whereas the year before it didn’t even reach the top 10, in 2022, around six in 10 (62%) UK mobile phone users had downloaded the app.
Mobile e-commerce accounts for almost three-quarters (73%) of total retail commerce in the UK. In 2022, the number of unique UK visitors to Amazon websites on mobile devices exceeded 44 million. This was the most visited online shopping app of 2022, followed by eBay (with over 25 million) and Apple (at just over 23 million).
UK mobile phone use statistics for accessing the news
As of February 2022, 64% of respondents from a YouGov survey used their smartphone to access the news.
From 2012, the percentage of people using their phones to access the news steadily increased, from 28% to a peak of 68% in 2021.
(Source: YouGov)
Mobile phone news statistics suggest that the percentage of people using their mobile for news may now be in decline. According to the University of Oxford, news consumption via smartphones fell by four percentage points between 2021 to 2022.
UK mobile phone use statistics for online gaming
In 2021, around 230 billion apps were downloaded across the globe, and by 2027, this is expected to generate over $366 billion (£290 billion) in revenue.
A 2022 Ofcom survey found that almost two in five (39%) respondents had played games on their mobile devices, up from 37% the previous year. Considering that, in 2009, only 6% of mobile users had played online games, this is a significant rise over the previous 13 years (33 percentage points).
(Source: Ofcom)
At the beginning of 2020 (during the outbreak of the Covid-19 pandemic), mobile gaming made double-digit gains across all age groups, with those aged 35-44 seeing the biggest growth of 24 percentage points.
A breakdown of how much money consumers are spending on mobile games
(Source: Ukie; VGC; Omdia)
In 2021, almost three-quarters (73%) of time spent online by UK adults was on a smartphone.
This year also saw UK consumer spending on online gaming exceed £1.46 billion, making it the second-largest gaming software segment of the economy behind digital console game sales.
Despite there being a slight drop of £40 million between 2020-21, total spending on online games has risen considerably year-on-year since 2011, from £158 million to £1.5 billion in 2020. This is an increase of almost 850% across the previous decade.
Online gaming statistics show that UK online adults spend more time using mobile devices than tablets and computers. 85% of those aged 25-34 prefer to use a smartphone for online gaming, compared to 80% of 35-44-year-olds, 78% of 15-24-year-olds, and 74% for those between 45 and 54. For those aged over 55, the corresponding figure is just over half (55%).
A breakdown of the percentage of people who use their mobile for gaming
(Source: Ofcom)
Almost two in five (37%) of UK smartphone users utilise their mobile phones for online gaming. The most popular groups are those between 16-24 and 25-34, where half (50%) reported using their devices to game online.
Generally, as the age groups increase, the percentage of mobile online gamers decreases. Only 11% of over 65s in the UK used their smartphones for online gaming in 2021.
When broken down by gender, women were more likely to use their mobile phone to play games in the UK compared to men (41% vs 33%) in 2021. However, men were more likely to play games on a console (39% vs 22%), and computers (29% vs 14%).
Among the gamers surveyed, women were more likely to opt for a game based on puzzles or quizzes (66%), compared to men (39%).
A breakdown of the popularity of different types of mobile phone games in the UK
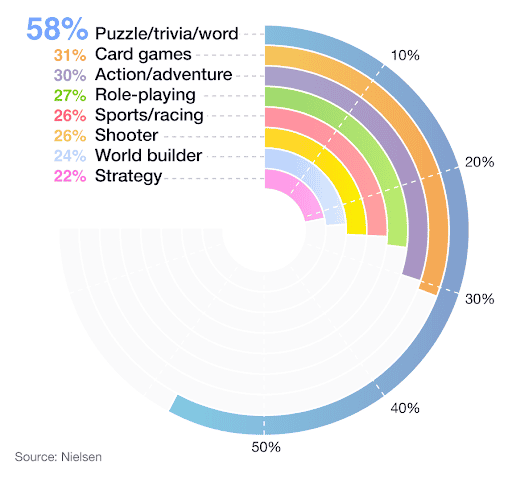
Puzzle, trivia, and word games are the most popular option for the UK adult online population, with 58% opting for this type of game. Just under a third play card games and action/adventure-based games, with a respective 31% and 30%.
Strategy games are the least preferred gaming option for smartphone users, at 22%.
A breakdown of competitive and cooperative game play on mobile phones and games consoles across different age groups in the UK
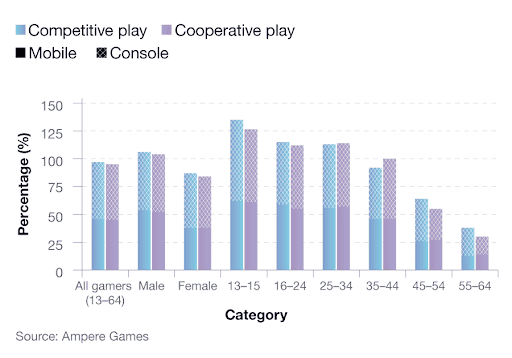
When comparing competitive and cooperative online gaming, the figures are fairly similar across mobile and games consoles.
For competitive play, less than half (46%) of online gamers prefer mobile devices, compared to 51% for consoles. For cooperative play, the corresponding values are 45% and 50%, respectively.
Males tend to play more online games compared to females, with 54% competitive play and 52% cooperative play compared to 38% for both types of games for females.
The most dominant age group in mobile online gaming is 13-15, with 62% for competitive gaming and 61% for cooperative gaming.
Generally, as the age groups increase, the percentage of people playing online games decreases. Just 13% of those aged 55-64 play mobile competitive play, with 14% for cooperative mobile play.
In almost all categories across all age groups, consoles outweigh mobile as the preferred platform to play online games. The two exceptions are those aged 35-44 for competitive play (tied at 46% for both mobile and console) and those aged 25-34 for cooperative play (tied at 57% for both).
A breakdown of the top 10 reaching gaming apps for UK mobile phones

Candy Crush Saga is the most popular gaming app on UK mobile devices, having been downloaded by 2.5 million UK adults in February 2022 alone (5% of the online adult population). This game is most popular with women, with 1.7 million female adults downloading the app in February 2022. This made up more than two-thirds (68%) of the total adults who visited the app, with the average daily audience in this time period exceeding 1.2 million.
By comparison, Pokemon Go sits in second place, with 1.6 million visits in February 2022 (3.1% of the online adult population). An average daily audience of 725,000 is more than double that of third-place Roblox.
Roblox is in third place largely due to its total target reach of 1.5 million (3%). The average daily audience of 322,000 is the eighth largest out of the top 10, with only 8 Ball Pool in ninth position having a smaller average daily audience (313,000).
If you can’t get enough of Candy Crush Saga or any of the other apps mentioned and are considering buying a new mobile, then check out our best gaming phones page.
Children mobile phone statistics
Research by Ofcom’s Children’s and Parents’ Media Literacy Tracker shows that smartphones are the second most popular way for children aged 3-15 to access the internet (68%, compared to 72% for tablet devices).
There is, however, significant variation between different age groups. As children get older, they are increasingly likely to use a smartphone to go online, from 39% of 3-4-year-olds to 94% for children between the ages of 12 and 15.
A breakdown of the percentage of children that use mobile phones to go online
(Source: Ofcom)
By the age of 10, the majority of children (61%) possess their own smartphones. This will go some way to explain why 71% of this age group use a mobile phone to access the internet.
A breakdown of the percentage of children who own a smartphone
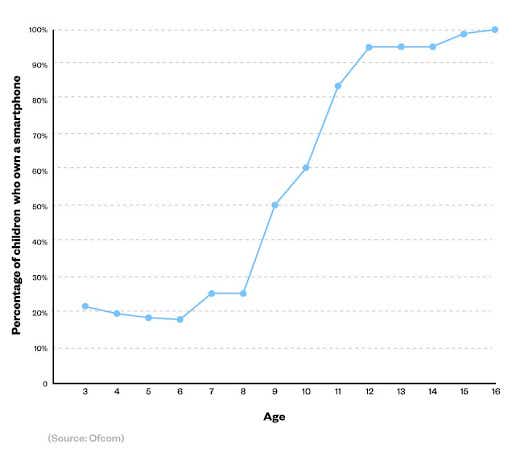
Mobile phone statistics indicate that half of children own a mobile phone by the age of nine. By the age of ten, a further 10% more get their first mobile device.
When children turn 11, and typically start secondary school, the percentage of them with a smartphone increases substantially. By this age, just 17% do not have a smartphone.
If your child has a smartphone, our mobile phone safety guide outlines ways you can keep your child safe while using their smartphone. Alternatively, if you’re considering buying a phone for your child then visit our page listing the best mobile phones for kids.
Uswitch.com mobile phone survey (September 2022)
We polled 2,012 mobile phone users over the age of 16 in the UK to find out what network provider, device, and network they use, as well as their mobile phone usage, habits, and experiences of using a mobile device, and more.
Most common network providers in the UK
(Source: Uswitch, September 2022. 2,000 respondents)
According to our study, EE is the most popular network provider in the UK, with over 22%, followed by O2 (17.5% of respondents) and Vodafone (just over 12%).
The remaining providers each occupied less than 10% of the number of respondents. Over 95% of people surveyed were supplied by one of the top 12 companies in the country.
How reliable is your general network service on your mobile phone?
(Source: Uswitch, September 2022. 2,000 respondents)
Of the 2,012 people surveyed, only 2% stated that they received a bad network service from their provider. Over 80% were extremely satisfied, with almost half (47%) stating their level of service was good, and nearly 36% claiming it was excellent. Just under 15% were satisfied with their network and claimed it was an acceptable standard.
How satisfied are you with your network provider as a whole?
(Source: Uswitch, September 2022. 2,000 respondents)
In terms of general service as a whole, 79% of people were either satisfied or very satisfied with their provider. Over 7% were not pleased with the service they received from their mobile network. 13% were on the fence and did not express a positive or negative response.
How often do you change your mobile phone?
(Source: Uswitch, September 2022. 2,000 respondents)
Mobile phone statistics indicate that 38% of people update their phone every two years, with a further 30.8% changing it every three years. More than 18% stated that they only change their mobile when it is absolutely necessary, while only 6% change on an annual basis.
What would be your reasons for changing your mobile phone device?
(Source: Uswitch, September 2022. 2,000 respondents)
Mobile users have various reasons for changing their device. For some it is a matter of routine, for others it only occurs when their current mobile is beyond repair.
Statistics show that:
Over half of those surveyed (51%) claimed that they only change their device or mobile plan due to being offered a cheaper mobile phone deal, with more than a quarter (26%) are tempted to change due to a promotional bundle offer.
One in five consumers claimed they wanted to upgrade their phone to one that is more efficient, especially if offered a cashback deal on their old device.
20% stated there was no specific reason that would cause them to change their phone.
13% claimed that they would purchase a new mobile phone device or plan by claiming on their warranty or through a recycling scheme.
How many hours a day do you spend on your mobile device?
(Source: Uswitch, September 2022. 2,000 respondents)
When comparing mobile phone usage, nearly one third (32%) of people spend 3-4 hours a day on their mobile phones, followed by nearly 23% who said they spend between 5-6 hours.
One in five people spend 1-2 hours a day on their devices, with 10% opting for 7-8 hours of screen time.
Less than 4% spend under an hour, compared to 7% who spend between 9-10 hours a day on their phones. Nine people out of the 2,012 surveyed admitted to spending over 10 hours a day on their mobiles, with one respondent claiming up to 15 hours a day of screen time.
What activities do you do on your mobile phone device?
The most popular activity undertaken on mobile phones by our surveyed audience was sending text messages (78%), followed by just under three-quarters (74%) using their phones to send and receive email communication. Phone calls were the third most popular activity, at 73%.
A breakdown of the most popular activities completed on a mobile phone

Over 70% use their devices for browsing the internet, while over two-thirds (67%) would use their mobiles to check social media accounts.
A breakdown of the most popular activities on mobile devices (2022)
(Source: Uswitch, September 2022. 2,000 respondents)
Reading books was the least popular activity completed on mobile phones, at just under 12%. Over a quarter of people would track their health on their devices, using apps to monitor exercise and food consumption. Almost a third of people (32%) would watch TV or videos on their mobile phones.
Do you refuse access to your personal data when installing apps?
(Source: Uswitch, September 2022. 2,000 respondents)
Nearly 18% said that they always refuse access to their personal data when installing apps, with over 38% stating they usually did it, but not always.
Almost a quarter (23%) said that they currently don’t, but they might consider it in the future, with less than 5% claiming they never refuse access to their personal data and never will.
6% said they didn’t refuse access because they did not know it was possible.
Methodology and sources

Read more:

UK broadband statistics, 2022
We’ve collated the latest UK broadband statistics for 2022, covering broadband access, usage, speed, cost, and more.

Porting your mobile phone number
Here you can find a for a step-by-step guide to keeping your mobile number and how to use a PAC code.

Mobile phone coverage
Here, we take a look at each of the major carriers and outline the sort of coverage and connection speeds you'll receive, as well as any perks and sweeteners you can expect for choosing that network, whether you're on a pay monthly or SIM only deal.

How to switch mobile phone provider
In this guide we’ll answer all your questions about switching your mobile phone network.

Best network for international roaming
International roaming and travel restrictions - which countries can you currently visit?

Internet data allowances
Here, you will find everything you need to know about internet data allowances.