Compare mortgages
Use an expert mortgage comparison call to save an average of £357 a month* Let our broker partner Mojo find the best mortgage rates for you.
Mortgage comparison from over 70 lenders across the whole of the market
Mojo Mortgages is our award-winning broker partner. They can search across the market to find the best deals for you


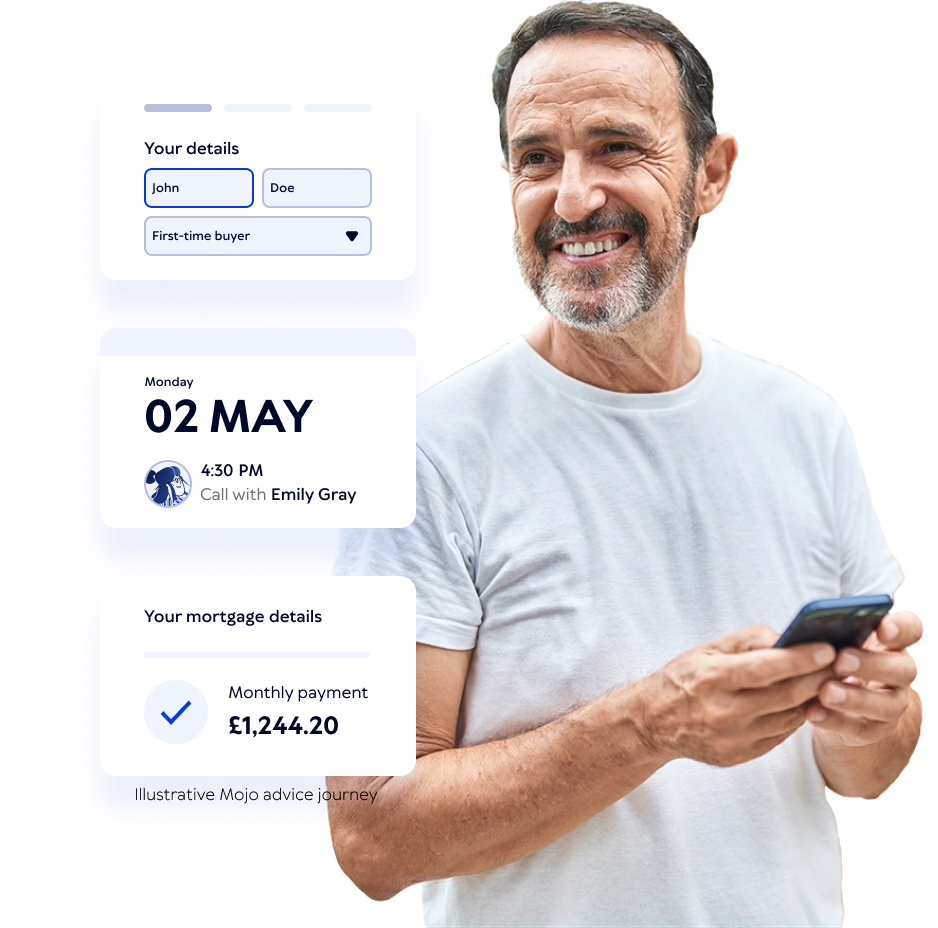
How to compare mortgages with Uswitch and Mojo
Add your details
Provide your details so Mojo Mortgages can find mortgage deals that are suited to you and your circumstances
Compare mortgages with a recommendation
Your Mojo expert will compare the best mortgage deals and call you to recommend those suited to you
Get your mortgage
Your Mojo expert will help you secure your mortgage deal.
YOUR HOME/PROPERTY MAY BE REPOSSESSED IF YOU DO NOT KEEP UP WITH YOUR MORTGAGE REPAYMENTS.
The FCA does not regulate mortgages on commercial or investment buy-to-let properties.

How much can I borrow for a mortgage?
To find out what sort of mortgage offers you might get from lenders, you need to know your:
Earnings before tax
Deposit amount
Earnings before tax for any joint applicants
Most mortgage providers will also take your credit history and broader financial circumstances into consideration, however.
Mortgage affordability calculators can be helpful at the start of your home buying journey – they allow you to focus your search on properties within your budget.
What kind of mortgage do I need?
First-time buyer mortgages
A first-time buyer is someone who has never owned a property anywhere in the world. If you have owned a property, even if you didn't use a mortgage or inherited it, you normally won't be classed as a first-time buyer by mortgage lenders.
For joint mortgage applications, all applicants must meet this definition for the purchase to be considered a first-time buyer application.
Although certain first-time buyer mortgage deals exist, the majority of mortgages are available to all buyers. Stamp duty relief and certain home ownership schemes are only available to first-time buyers that meet the above criteria though.
Remortgage
A remortgage is when you change mortgage deal, either by switching mortgage provider or getting another deal with your existing lender. This is used to repay the mortgage on a property that you already own, rather than to buy a new one.
Most people remortgage when they are approaching the end of their current deal – you can compare mortgage deals and usually secure a new rate around six months before your existing deal term ends.
If you're on your lender's standard variable rate (SVR), you can remortgage at any time without early repayment fees.
According to UK remortgage statistics, around 1.4 million UK households will come to the end of their existing mortgage deal in 2023, representing almost 57% of UK mortgage owners.
Moving house mortgage
When you move house, you can often take your existing mortgage with you – this is known as porting your mortgage. It can be an easier option, but won't always be the cheapest, so make sure to look at the best mortgage rates that other lenders have available too.
Most, but not all mortgages are portable, so you may have no choice but to take out a mortgage with another lender if you're keen to move. Look out for early repayment charges (ERCs) and exit fees if you're still in a fixed-rate or introductory rate period.
Buy-to-let mortgage
A buy-to-let mortgage is to buy rental properties for investment purposes, so is typically only used by landlords.
With buy-to-let mortgages, lenders base your borrowing on the potential rental income (or rental yield) of the property, rather than your personal income. Usually they will expect this to cover 125-145% of the monthly mortgage repayments.
You'll also need a higher deposit compared to a residential mortgage. Most lenders ask for at least 25% of the property value, although it can vary between 20-40%.
Best mortgage rates
The table below shows some of our best mortgage deals on fixed-rate products, based on the initial rate available and different loan-to-value (LTV) ratios (LTV is the amount you borrow compared to the value of the property). The initial rate is what you pay during the introductory deal period (for a two-year fixed-rate mortgage, the introductory period is two years).
We've also included the Annual Percentage Rate of Change (APRC) after the initial rate for each deal. The APRC takes fees and the lender's standard variable rate (SVR) – which you're moved onto after the introductory period – into account, so it can be useful for comparing different mortgage deals and all their associated costs.
But bear in mind that many people choose to find a new remortgage at the end of their introductory mortgage deal, rather than moving onto the SVR.
| LTV | 2-year fixed | 5-year fixed |
|---|---|---|
| 90% | Nationwide BS Initial rate: 5.14% | APRC: 7.8% Repayment mortgage of £252,000.00 over 25 years, representative APRC 7.8%. Repayments: 24 months of £1,492.28 at 5.14% (fixed), then 276 months of £1,913.19 at 7.99% (variable). Total amount payable £563,855.16. Early repayment charges apply until 2 years. Arrangement, mortgage discharge, valuation and CHAPS fees total £1079. | Clydesdale Bank Initial rate: 4.64% | APRC: 7.6% Repayment mortgage of £252,000.00 over 25 years, representative APRC 7.6%. Repayments: 63 months of £1,420.80 at 4.64% (fixed), then 237 months of £2,060.11 at 9.49% (variable). Total amount payable £577,756.47. Early repayment charges apply until 5 years. Arrangement, mortgage discharge, valuation and CHAPS fees total £1823. |
| 80% | NatWest Initial rate: 4.79% | APRC: 7.8% Repayment mortgage of £224,000.00 over 25 years, representative APRC 7.8%. Repayments: 28 months of £1,282.22 at 4.79% (fixed), then 272 months of £1,727.99 at 8.24% (variable). Total amount payable £505,915.44. Early repayment charges apply until 31-Aug-2026. Arrangement, mortgage discharge, valuation and CHAPS fees total £1525. | NatWest Initial rate: 4.47% | APRC: 6.9% Repayment mortgage of £224,000.00 over 25 years, representative APRC 6.9%. Repayments: 64 months of £1,241.25 at 4.47% (fixed), then 236 months of £1,668.49 at 8.24% (variable). Total amount payable £473,203.64. Early repayment charges apply until 31-Aug-2029. Arrangement, mortgage discharge, valuation and CHAPS fees total £1525. |
| 70% | Santander UK Plc Initial rate: 4.68% | APRC: 7.2% Repayment mortgage of £196,000.00 over 25 years, representative APRC 7.2%. Repayments: 28 months of £1,108.45 at 4.68% (fixed), then 272 months of £1,421.26 at 7.5% (variable). Total amount payable £417,619.32. Early repayment charges apply until 02-Sep-2026. Arrangement, mortgage discharge, valuation and CHAPS fees total £1224. Legal fees £184.75. | NatWest Initial rate: 4.37% | APRC: 6.8% Repayment mortgage of £196,000.00 over 25 years, representative APRC 6.8%. Repayments: 64 months of £1,075.02 at 4.37% (fixed), then 236 months of £1,457.29 at 8.24% (variable). Total amount payable £412,721.72. Early repayment charges apply until 31-Aug-2029. Arrangement, mortgage discharge, valuation and CHAPS fees total £1525. |
| 60% | Santander UK Plc Initial rate: 4.61% | APRC: 7.1% Repayment mortgage of £168,000.00 over 25 years, representative APRC 7.1%. Repayments: 28 months of £943.39 at 4.61% (fixed), then 272 months of £1,217.58 at 7.5% (variable). Total amount payable £357,596.68. Early repayment charges apply until 02-Sep-2026. Arrangement, mortgage discharge, valuation and CHAPS fees total £1224. Legal fees £184.75. | NatWest Initial rate: 4.19% | APRC: 6.7% Repayment mortgage of £168,000.00 over 25 years, representative APRC 6.7%. Repayments: 64 months of £904.49 at 4.19% (fixed), then 236 months of £1,244.98 at 8.24% (variable). Total amount payable £351,702.64. Early repayment charges apply until 31-Aug-2029. Arrangement, mortgage discharge, valuation and CHAPS fees total £1025. |
The above fixed rates are provided by Mojo Mortgages and updated every 12 hours. THEY MAY NOT BE AVAILABLE WHEN YOU'RE READY TO SUBMIT AN APPLICATION.
How do mortgage interest rates work?
When you borrow a mortgage loan, you pay it back with interest (extra money on top of the amount you borrowed), as this is how the lender makes money.
The mortgage interest rates available to you will depend on your financial circumstances, market competition and the Bank of England base rate.
How the base rate impacts your mortgage repayments depends on the type of mortgage you have (whether it's fixed or variable).
How to get the best mortgage rates in the UK
If you're looking for the UK's cheapest mortgage rate, you may be surprised to find that even 'mortgage best buys' are much higher now than they were a few years ago. This is due to economic factors and multiple increases in the Bank of England's base rate of interest.
However, there are still ways to increase your chances of securing a competitive mortgage deal:
Save as large a deposit as you can afford. Generally the lowest interest rate is achieved with the greatest deposit, as lower LTV mortgages are seen as less risky by lenders
Speak to a whole-of-market mortgage broker who can compare all of the best mortgage providers, current mortgage rates and the best mortgage deals from across the market to see what's available to you
Why use our partner, Mojo Mortgages?
"I made an online search via Uswitch which recommended Mojo... fixed an appointment for 2 days later... by that evening I had signed a deal! In less than 24 hours it was all done!I am happy with my new mortgage thanks to Mojo and their wonderful team."
Trustpilot review, September 2023
What are the different types of mortgage rate?
Fixed-rate mortgages
With fixed-rate mortgages your interest rate won't change for a set period of time. There are various deal lengths available and you fix the rate for that amount of time, usually two, five or 10 years.
Knowing that your rate won’t increase within a specific time frame makes budgeting for your monthly repayments much easier. But you won't benefit if interest rates decrease whilst you're on a fixed-rate deal.
Variable-rate mortgages
There are three different types of variable-rate mortgages:
Standard variable rate (SVR)
Discount
Tracker
All variable interest rates are subject to change at any time. The introductory period of variable rate deals can be cheaper than a fixed-rate deal initially, but become more expensive if rates rise (or cheaper if rates fall).
Standard variable rate (SVR)
This is the mortgage lender’s default rate and is usually higher than any of their other deals. You will normally end up on this rate at the end of any other type of deal, unless you remortgage to another deal.
Discount mortgages
With discount mortgages, you get a discount on the lender’s SVR for a specified period of time. Your rate will go up or down along with the SVR, but there's no guarantee that this will happen or by how much.
Tracker mortgages
With tracker mortgages, during the initial deal period, your mortgage rate is a certain level above an external financial indicator, usually the Bank of England base rate. Your rate will follow its movements, matching how much it rises and falls by.
Offset mortgages
With offset mortgages, your savings are offset against your mortgage loan so that you pay less interest. For example, if you have savings of £50,000 and a mortgage of £200,000, you would only pay interest on £150,000. Your savings would not accumulate any interest though. You can get fixed or variable offset mortgages.
How does a mortgage work?
Repayment mortgages
If you take out a mortgage on a repayment basis, you repay some of the capital (loan amount) you borrowed and some interest each month. Most residential mortgages are taken out on a repayment basis.
This means by the end of the mortgage term, you'll have repaid the mortgage in full and will own your home outright.
Interest-only mortgages
With interest-only mortgages, you only pay the interest on the mortgage each month – you don’t repay any of the loan, which is paid in full at the end of your mortgage term.
For this reason, interest-only mortgages are usually only used to purchase buy-to-let properties - but they are available for residential properties in certain circumstances.

Help for first-time buyers
If you're buying a home for the first time, it can be really tricky to save up the money required. However, there are some schemes designed to help you get on the property ladder.
Mortgage guarantee scheme
The mortgage guarantee scheme was launched in 2021 to encourage more lenders to offer 5% deposit mortgages. It was due to end in December 2023 but has been extended to June 2025.
Stamp Duty relief
As a first-time buyer in England and Northern Ireland, you get stamp duty tax relief on properties up to £425,000. On properties up to £625,000 you only pay tax on the amount above £425,000. In Scotland you get relief up to £175,000, and in Wales it's £225,000.
Our stamp duty calculator helps you work out how much you need to pay.
Lifetime ISA
If you're struggling to save a deposit for your first home and are between the ages of 18-40, it might be worth opening a Lifetime ISA. The government will provide a 25% tax-free bonus on your savings, helping you save a deposit more quickly.
First Homes scheme
The First Homes Scheme provides designated properties for first-time buyers and key workers in England at 30-50% below market value. These properties are in limited locations, but availability is expected to increase in the coming years.
Shared Ownership
If you're struggling to save up a deposit for a mortgage on a home that meets your needs, shared ownership may be an option for you. You buy a 10-75% share of a home and pay rent to a housing association who own the rest.
Right to Buy
The Right to Buy Scheme allows certain council tenants to buy their rented home at a discount. Different rules apply across the UK so check your government's website for details. The Right to Acquire Scheme is a similar scheme for housing association tenants.


With so much change in the mortgage market over the past year or so, it's more important than ever to get expert advice. Consult a broker who can compare mortgages from across the market to find the best deal for you.”Kellie Steed, Mortgage Content Writer
Mortgage FAQs
What is a mortgage?
A mortgage is a loan from a bank, building society or other lender that you use to buy property. You normally repay the mortgage plus interest over a set period of time (the mortgage term), normally around 25-30 years.
This type of loan is secured on the property you’re buying, meaning that if you default on payments (fail to repay the loan), the lender could potentially repossess your home (take it back). This is usually a last resort, but it's important to understand that you won't own the property outright until the entire loan has been repaid.
You can use a property bought with a mortgage as soon as the purchase has been completed. Being able to continue doing so depends on you keeping up with the repayments each month.
How can mortgage comparison save me money?
When applying for a mortgage, it's important to get a competitive rate, as this will determine how much you pay each month.
An independent mortgage broker carry out mortgage rates comparison across the whole market very quickly, and help find the mortgage deal that's most suited to your individual circumstances.
Important questions to consider when choosing a mortgage are:
How much will my monthly mortgage payments be?
What arrangement fees will I need to pay?
If I choose a variable-rate mortgage, what happens when interest rates rise?
Always factor in the fees as well as the interest rate when you're deciding which is the most affordable option overall. The easiest way to do this is to look at the total cost over the deal period.
The mortgage market is incredibly dynamic and it's a good idea to stay ahead of any major changes and keep an eye on current mortgage rates, whether you're buying your first home, or have had a mortgage for many years. Checking out the latest mortgage statistics and following mortgage market news will help you stay in the know.
How long is a mortgage term in the UK?
The typical length of a mortgage in the UK is around 25-30 years, but the term can be shorter or longer, depending on your preference, income and age.
A longer term mortgage will allow you to keep your monthly costs lower, as it will spread out the repayments over a longer duration. But this also means that it takes you longer to repay the mortgage, and you’ll pay more interest overall as a result.
What is loan to value (LTV)?
The LTV is the ratio between the value of your property and the amount you're borrowing. For example, if you take out £112,500 mortgage on a £150,000 property, the loan would be 75% LTV. You would therefore need a deposit of 25% (or £37,500).
All mortgages have a maximum LTV that it's possible to borrow, and typically, the higher the LTV (the more you borrow compared to the cost of the property), the higher interest rate you’ll pay.
First-time buyers tend to need to borrow a higher percentage of the property’s value than existing homeowners. This is because if you already have a home, you typically build up equity in the property as you repay the loan and when house prices rise. Equity can be used as a deposit when you find a new remortgage or move home.
What is the APRC?
APRC stands for Annual Percentage Rate of Charge and is a way of comparing different mortgages. It takes the overall rate charged over the lifetime of the mortgage, including any fees, and gives you a baseline comparison rate.
Mortgages generally offer a lower interest rate for the first two to 10 years then revert to the lender’s standard variable rate (SVR). Every lender has their own SVR and this is typically (but not always) the most expensive rate available.
The APRC uses both of these interest rates to show the real cost over the whole term of the mortgage. This helps you to find out whether the mortgage deal with the lowest initial rate is really the cheapest overall.
As this assumes you’ll keep the same mortgage for the whole term, it’s not always a useful way to compare deals, however. Looking at the total cost over the deal period can be a better way to find the cheapest option, if you're planning to switch mortgages when each deal period ends.
What is a mortgage in principle?
To make the home buying process smoother, you should consider getting a mortgage in principle. This is often known as a decision in principle (DIP) or an agreement in principle (AIP) by lenders.
A mortgage agreement in principle is a theoretical mortgage offer, assuming you are able to meet the full criteria when you go through the full application process.
It's useful when looking at properties, as it gives the impression that you are a serious buyer. It's also a good indicator that you will be approved for a mortgage down the line, so long as the information you provide when you apply for it is as accurate as possible.
Should I get a repayment or an interest only mortgage?
Most residential mortgages are only offered on a repayment basis, so if you're purchasing a home to live in, then you will most likely need to get a repayment mortgage.
This is because interest-only mortgages are much riskier, as you still owe the full loan amount at the end of the term. You need a repayment plan in place and if this doesn't work out, you'll need to sell the property at the end of the term.
However, if you're purchasing a buy-to-let property, interest-only mortgages are commonly available. Most landlords use interest-only mortgages, as it means the monthly mortgage repayments are lower, allowing them increased profit from the rent.
This can be used for property maintenance or saved towards repaying the full loan at the end of the mortgage term. Plus, landlords are usually happier to sell a investment property than residents are to sell their home at the end of the term, if necessary.
A repayment mortgage costs more each month than an interest-only mortgage. However, you will repay more interest overall with an interest-only mortgage, as you’re paying interest on the full capital amount for the entire mortgage term.
For example, if you had a mortgage of £200,000 at 5% over 20 years, the total interest would be around £116,876 if you took out the mortgage on a repayment basis. If you took it out on an interest-only basis, you would end up paying £200,146 in interest and would still owe £200,000 capital at the end.
How much of a mortgage can I afford?
When lenders calculate affordability, they generally take income, and outgoings into account, as they will want to be sure that you can afford the repayments each month.
A mortgage affordability calculator can give you an idea of what you may be able to afford, however, it's important to understand that your version of affordable may not always align with the lender's.
If you spend a large amount of your monthly income you may be seen as a riskier prospect by the lender. Especially if you are using your income to repay lots of other debts.
Before applying for a mortgage it’s a good idea to have a look at your finances and make sure you are budgeting sensibly. Identify areas where you could cut back or debts that you could repay before applying.
Speak to a mortgage broker who can compare current mortgage rates and deals in the UK to find the best rate for you and your circumstances.
*Average savings are based on Mojo Mortgages residential remortgage sales data, compared to the average SVR in January 2024. Actual savings will depend on individual circumstances.
YOUR HOME/PROPERTY MAY BE REPOSSESSED IF YOU DO NOT KEEP UP WITH YOUR MORTGAGE REPAYMENTS.
The FCA does not regulate mortgages on commercial or investment buy-to-let properties.
Uswitch makes introductions to Mojo Mortgages to provide mortgage solutions.
Uswitch and Mojo Mortgages are part of the same group of companies. Uswitch Limited is authorised and regulated by the Financial Conduct Authority (FCA) under firm reference number 312850. You can check this on the Financial Services Register by visiting the FCA website.
Uswitch Limited is registered in England and Wales (Company No 03612689) The Cooperage, 5 Copper Row, London SE1 2LH.
Mojo Mortgages is a trading style of Life's Great Limited which is registered in England and Wales (06246376). Mojo are authorised and regulated by the Financial Conduct Authority and are on the Financial Services Register (478215)
Mojo’s registered office is The Cooperage, 5 Copper Row, London, SE1 2LH, and head office is WeWork No. 1 Spinningfields, Quay Street, Manchester, M3 3JE. To contact Mojo by phone, please call 0333 123 0012.
Page last reviewed by Kellie Steed on 15 February 2024