UK online streaming statistics showcase how the reach of platforms such as Netflix, Amazon Prime, and BBC iPlayer have expanded over the last decade. After steadily growing in popularity throughout the 2010s, there was a substantial surge in subscribers as a result of the Covid-19 lockdowns.
Then, for the first time, streaming services had to contend with falling subscriber numbers as UK households tightened their belts in the face of a cost of living crisis.
With this being such an interesting time in the history of online streaming, we felt it was the ideal opportunity to produce the definitive UK online streaming statistics report for 2024.
Top 10 UK online streaming statistics 2024
Between 2015 and 2023, SVoD (Streaming Video on Demand) penetration in UK households more than tripled, from a fifth (20%) to two-thirds (66%), respectively.
In 2023, two-fifths (42.2%) of all new streaming subscribers joined Amazon Prime Video.
Between 2017 and 2027, the average revenue per user for streaming companies is expected to more than double, increasing from around £56 to £199 per user.
From Q1 2019 to Q3 2023, Netflix’s global revenue increased by more than four-fifths (88%).
In Q1 2022, Netflix’s UK subscriber numbers peaked at 17.3 million.
From Q1 2019 to Q3 2023, the number of Amazon Prime Video members more than doubled (+118%).
Disney Plus increased its subscriber numbers by almost two-fifths (+37.5%) between Q2 2021 and Q2 2022.
Adults aged 75+ spend around twice as much time watching content on screens than children aged 4-15, with more than three-quarters (78%) of screen time for the over 75s coming from TV viewing.
Netflix has the strongest brand awareness of all online streaming services, with 96% of people in the UK having heard of it.
On average, people in the UK spend four times as much time watching live TV as they do streaming services.
UK online streaming industry statistics
Online streaming industry statistics highlight how much the sector has changed in a relatively short period. For example, back in 2014, just 4.2% of the UK population had a Netflix subscription, compared to almost a quarter (24.7%) by the end of 2023.
Similarly, around 1.2 million UK households had an Amazon Prime Video subscription in 2014. By 2023, this figure had jumped to 13 million (an increase of 983% in just nine years).
In terms of the streaming of shorter videos, the number of YouTube users in the United Kingdom grew from 33.4 million in 2017 to 43.9 million as of 2024.
This section delves deeper into how the UK online streaming industry has changed over time, both in terms of subscriber numbers, market size, and average streaming revenue per user.
Growth of subscription video on demand in UK homes
Online video statistics from Ofcom show that between 2015 and 2019, the take-up of subscription video-on-demand (SVoD) services increased by 135% in the space of just four years.
The biggest increase in UK SVoD penetration came in 2020-21, when take-up rose by 12 percentage points, from just over half of all UK households (53%) to almost two-thirds (65%).
A breakdown of SVoD penetration of UK households by provider (2015-23)
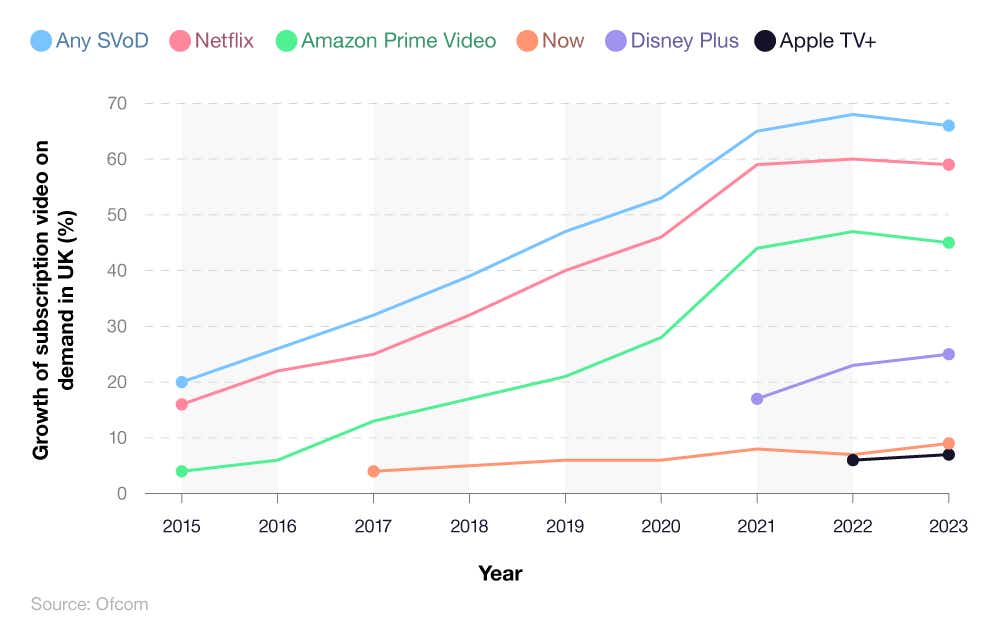
The only year in which SVoD penetration fell was in 2023, when take-up dropped by 2.94%. In the same year, the number of Netflix users also fell, albeit by one percentage point.
Online streaming statistics reveal that Amazon Prime Video had the most impressive growth in subscriber numbers over the last decade. Between 2013 and 2023, the number of Amazon Prime Video subscribers increased more than tenfold (+1,025%). Comparatively, Netflix’s penetration rate in the UK grew by 268%.
Despite only joining the online streaming market in 2021, the number of Disney Plus subscribers has increased from less than a fifth (17%) to a quarter (25%) of UK households by 2023.
In the space of six years, NOW TV has more than doubled its penetration rate from 4% to 9%.
Interested in a NOW TV subscription? Visit our guide on how to watch NOW TV.
On-demand streaming revenue in the UK
Between 2018-23, online streaming revenue in the UK more than doubled, increasing from $1.24 (£0.98) billion to $3.11 (£2.47) billion. Comparatively, the rate of increase is expected to slow over the coming years, rising by 48.6% by 2028.
A breakdown of UK online streaming revenue (2018-28)
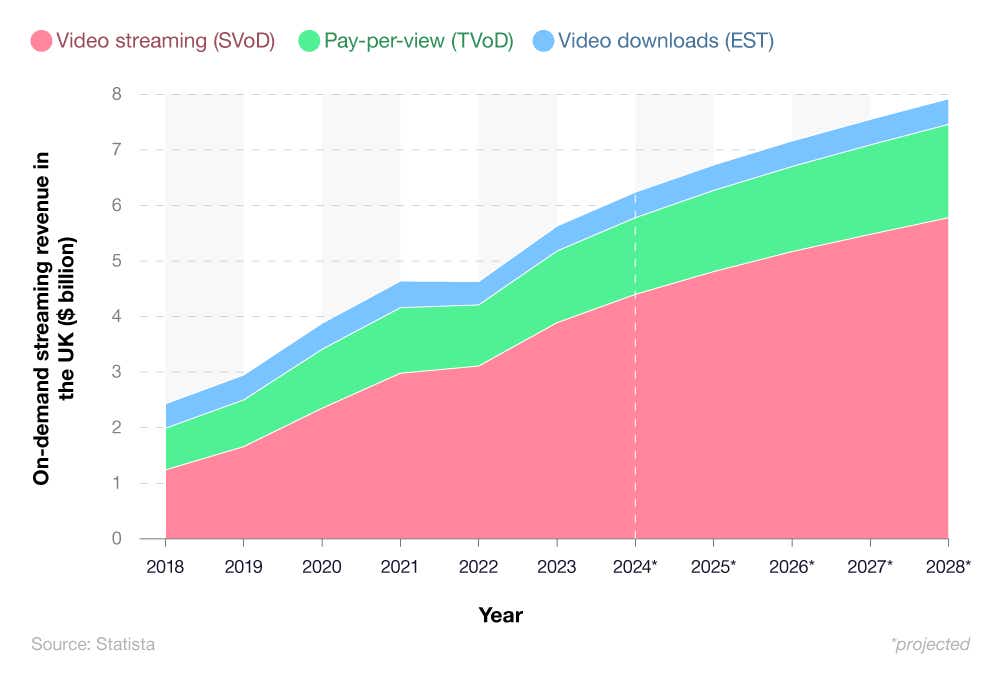
The growth of pay-per-view TV has been far more steady. Between 2018-23, online streaming revenue increased by 75%, from $0.75 (£0.59) billion to $1.29 (£1.02) billion. Forecasts suggest that this growth will slow down by 2028, with pay-per-view TV streaming revenue increasing by less than a third (30%) in the next five years.
The streaming revenue generated by video downloads hardly changed between 2018-23. After a brief decline in 2022, when the value dropped to $0.42 (£0.33) billion, it bounced back just 12 months later to $0.45 (£0.36) billion. Streaming revenue statistics suggest that this figure will flatline at $0.46 (£0.36) billion by 2028.
New online streaming subscriber statistics
Online streaming statistics show that between 2020-23, Amazon Prime Video led the way in terms of the number of new subscribers. With more than two-fifths (42.2%) of all new online streaming subscribers in Q1 2023, this was 33 percentage points ahead of the next highest (Disney Plus).
A breakdown of the share of new streaming subscriber statistics (2020-23)
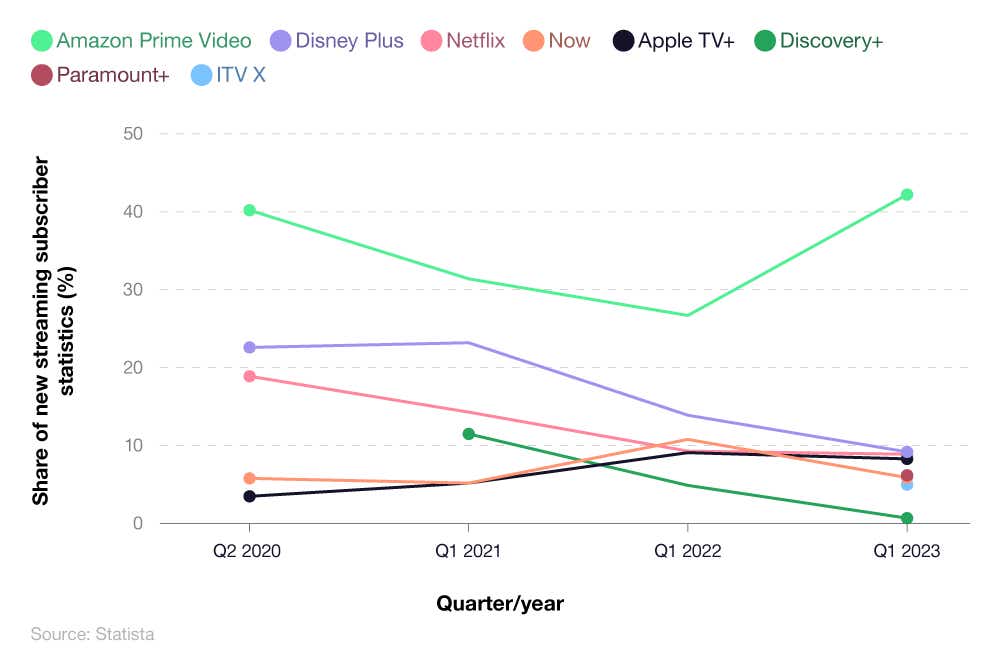
In terms of the percentage of new subscribers, Netflix’s strongest year came in Q2 of 2020, when almost a fifth (18.9%) of new SVoD subscribers were signing up to the online streaming giant. By Q1 2023, this figure had steadily declined, with just under one in 10 (8.9%) new online streaming subscribers opting for Netflix.
Disney Plus entered the market in 2020 and immediately picked up more than a fifth (22.6%) of all new SVoD subscribers for that quarter. Disney Plus performed even stronger in 2021, attracting almost a quarter (23.2%) of all new online streaming subscribers for the year.
UK average streaming service revenue per user
Between 2017-23, the average online streaming revenue per user in the UK practically doubled, increasing by 97% in just six years. The majority of this growth came between 2017 and 2021, when streaming revenue per user increased by around two-thirds (+68.2%).
The largest increase in average streaming revenue per UK user came in 2018-19, with a 15.9% rise in this year alone.
A breakdown of average streaming service revenue per user (2017-27)
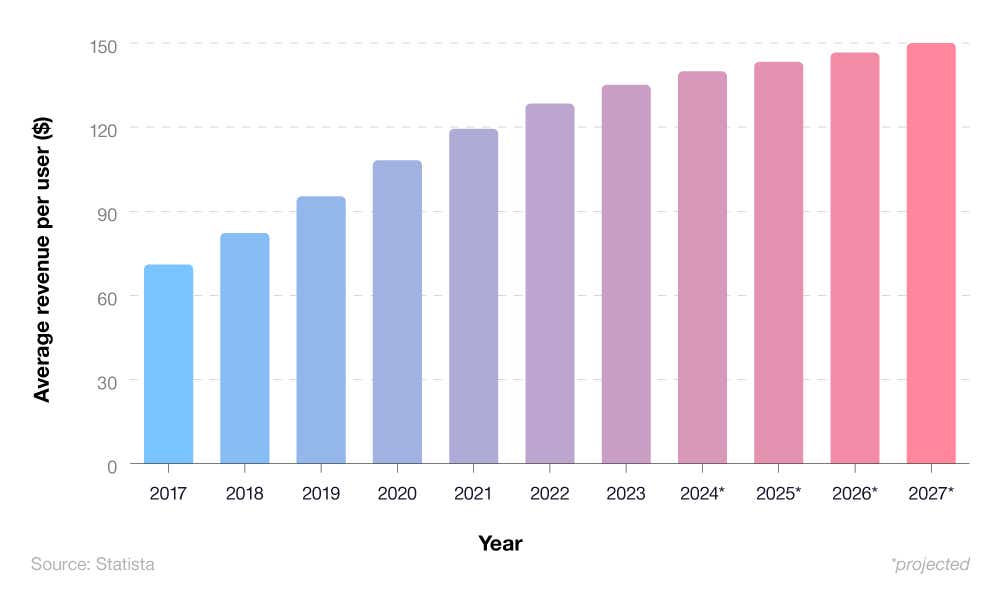
Forecasts suggest the UK average streaming revenue per user will continue to increase by 2027, albeit at a slower rate than in previous years. Projections show an 11.8% rise between 2023-27, with a nominal rise of 4.9% in the latter two years alone.
UK online streaming demographic statistics
UK video streaming statistics by age
Video streaming statistics in the UK tend to be dominated by those aged 45-54, who make up just under a third (29.8%) of the UK streaming population. This is closely followed by the 35-44 age bracket, who occupy just over a quarter (25.6%).
A breakdown of the percentage of people online streaming by age
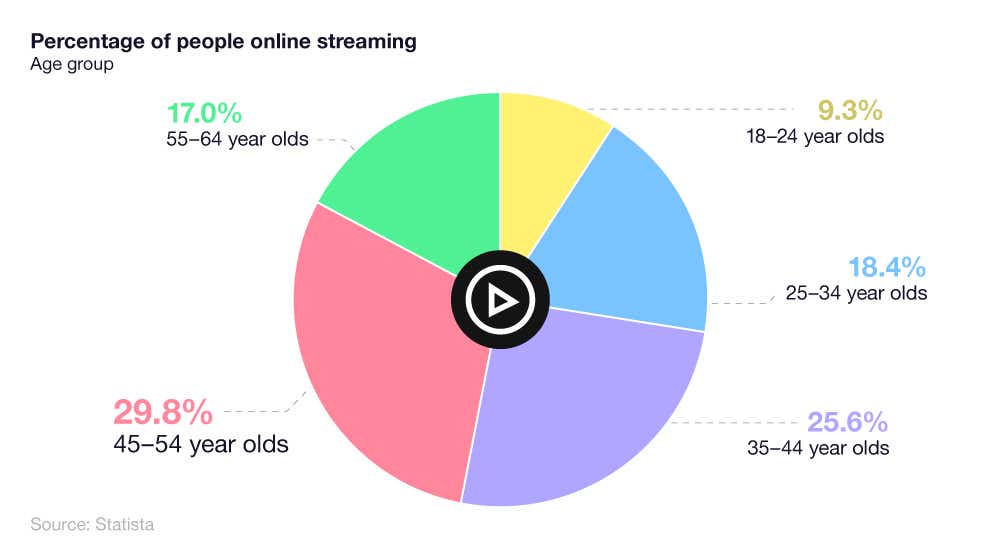
Conversely, those aged 18-24 are the least commonly represented group in the UK streaming population, with less than one in 10 (9.3%) coming from this age category. Less than a fifth (17%) of 55-64-year-olds in the UK stream videos online – almost double the percentage compared to those between 18-24.
UK video streaming statistics by gender
According to video streaming statistics, just over half (53.3%) of the UK streaming population are male.
A breakdown of male vs female video streaming statistics in the UK
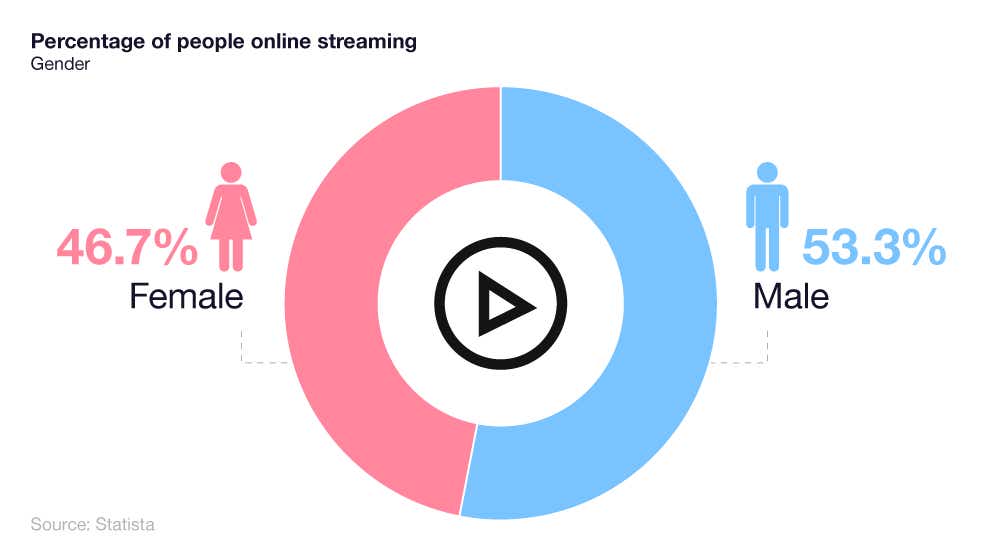
This is contrasted by 46.7% for females, representing a 6.6% difference between the two genders.
UK video streaming statistics by income
Video streaming statistics indicate a slight income disparity when it comes to online streaming. The majority of UK online streamers (36.8%) tend to come from high-income groups, compared to just over a quarter (27.3%) from the lowest.
A breakdown of video streaming statistics in the UK by income group
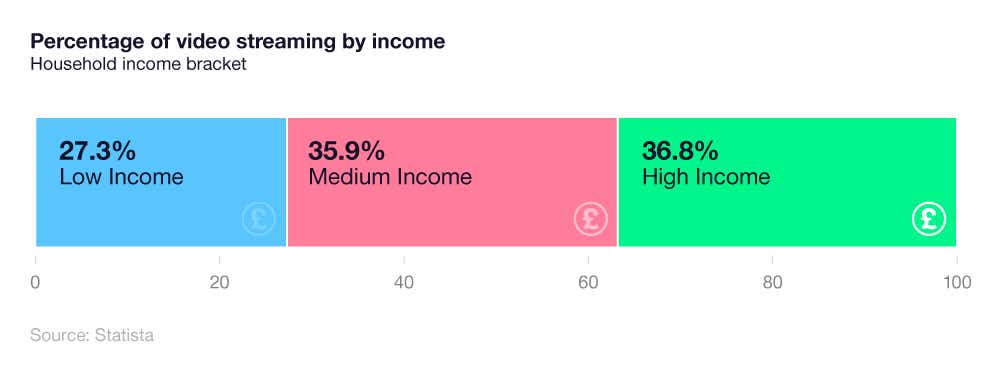
In total, just over a third (35.9%) of UK online streamers are from households with a medium income level.
UK online streaming viewer habits
Which is the most watched streaming service in the UK?
In both May 2022 and May 2023, Netflix was the most watched streaming service in the UK in terms of the number of hours streamed. In May 2023, Netflix was streamed for a quarter (25%) more hours than nearest rivals Amazon Prime Video.
A breakdown of the most watched streaming services in the UK in May 2022 and May 2023
| May 2022 | May 2023 | |
|---|---|---|
| Netflix | 40,524 | 39,201 |
| Amazon Prime Video | 32,849 | 31,266 |
| Discovery+ | 13,618 | 19,726 |
| Now | 21,718 | 19,236 |
| Disney Plus | 14,506 | 17,551 |
| Channel 4 | 15,021 | 17,071 |
| BBC iPlayer | 14,368 | 16,852 |
| Freevee | 8,675 | 16,001 |
| ITV X | 7,059 | 13,236 |
| Pluto TV | 6,490 | 11,191 |
| Britbox | 10,244 | 10,040 |
| Paramount Plus | 6,946 | |
| UKTV Play | 4,207 | 6,740 |
| My5 | 5,577 | 6,594 |
| Rakuten TV | 1,673 | 2,188 |
| Apple TV | 630 | 991 |
(Source: Statista)
The streaming service which enjoyed the biggest burst in numbers between 2022 and 2023 (barring those which were not yet launched) was ITV X. The British-based streaming service increased its viewing numbers from 7,059 to 13,236, representing an 87.5% rise within the previous year. Meanwhile Freevee’s viewing numbers increased by 84% over the same period.
TV viewing habits for online streaming
Statistics on television viewing habits reveal that almost half (45%) of UK streamers don’t mind watching a show whether all the episodes have been released or not.
When broken down by age, older viewers (i.e. those over 55) are the least bothered in regards to whether the show has finished or not before watching it online, with just under half (49%) admitting this.
A breakdown of TV viewing habits and how long people wait to watch series after they appear on streaming services
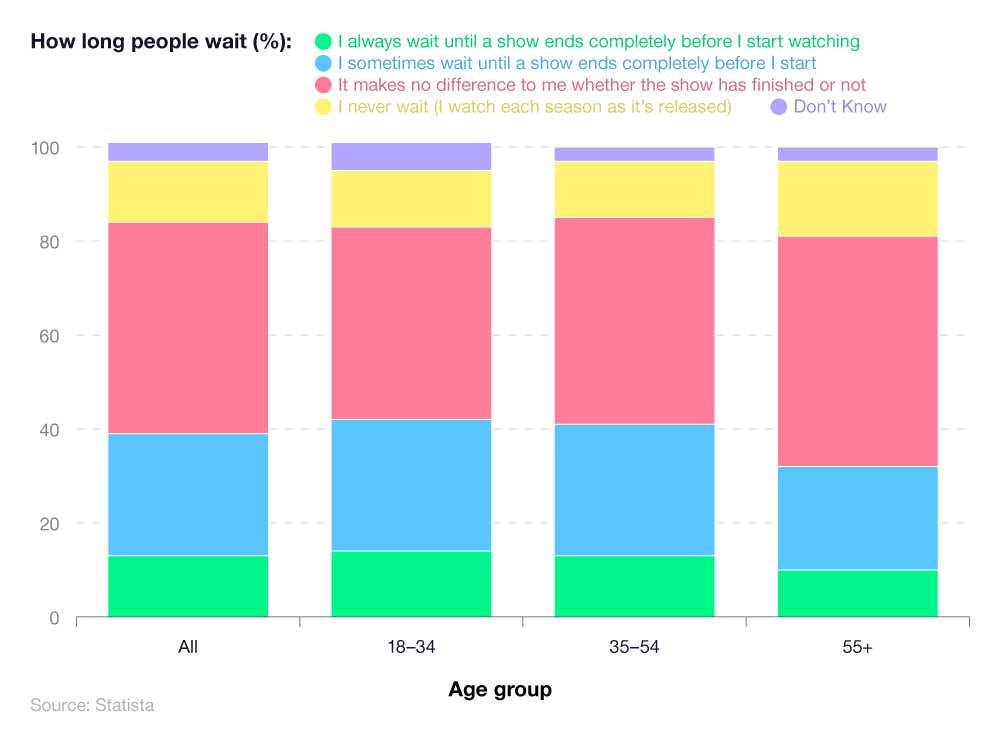
Older viewers are also the most inclined not to wait for a show to finish before they start watching, with 16% saying they like to watch each season as it comes out.
Meanwhile, younger viewers are the most likely to wait for a show to finish before they start watching it. Around one in seven (14%) streamers aged 18-34 always wait for a show to finish before tuning in online.
Fibre broadband statistics reveal that over a quarter (26%) of UK households only watch TV online, with more than two-fifths (44%) subscribing to more than one streaming service.
Brand awareness of online streaming services in the UK
According to online streaming statistics linked to brand awareness, Netflix is the most recognised streaming service in the UK. Based on a 2023 survey, 96% of respondents had heard of Netflix, putting it 2% ahead of Amazon Prime Video and 3% ahead of Disney Plus in third.
A breakdown of the brand awareness of popular streaming services
| Streaming Service | Brand awareness |
|---|---|
| Netflix | 96% |
| Amazon Prime Video | 94% |
| Disney Plus | 93% |
| YouTube | 91% |
| Apple TV+ | 84% |
| Now TV | 83% |
| Discovery+ | 78% |
| BritBox | 74% |
| Sky Go | 67% |
| Rakuten TV | 54% |
| HayU | 51% |
| DAZN | 33% |
| Mubi | 22% |
| I don’t know any of these brands | 1% |
(Source: Statista)
Launched by BBC and ITV in 2017 as a rival to Netflix, BritBox was recognised by almost three-quarters (74%) of respondents from the survey.
At the other end of the scale, Mubi had the lowest brand awareness score from the 2023 survey, with only around a fifth (22%) having heard of this online streaming platform.
Incidentally, just 1% had never heard of any streaming services from the list, indicating that the UK population has a strong awareness of the different types of platforms on offer for online streaming.
As more TVs become smart, there is no need to watch programmes on a small screen anymore. Check out our guide on how to watch Netflix on your TV for more information.
UK screen time statistics
Average daily minutes of screen time in the UK across all devices
UK screen time statistics indicate that the average UK person typically spends more than a sixth (18.6%) of their day on a screen. Of these four hours and 28 minutes of screen time, average TV viewing per day equates to less than half this amount (44%).
A breakdown of UK screen time statistics by purpose
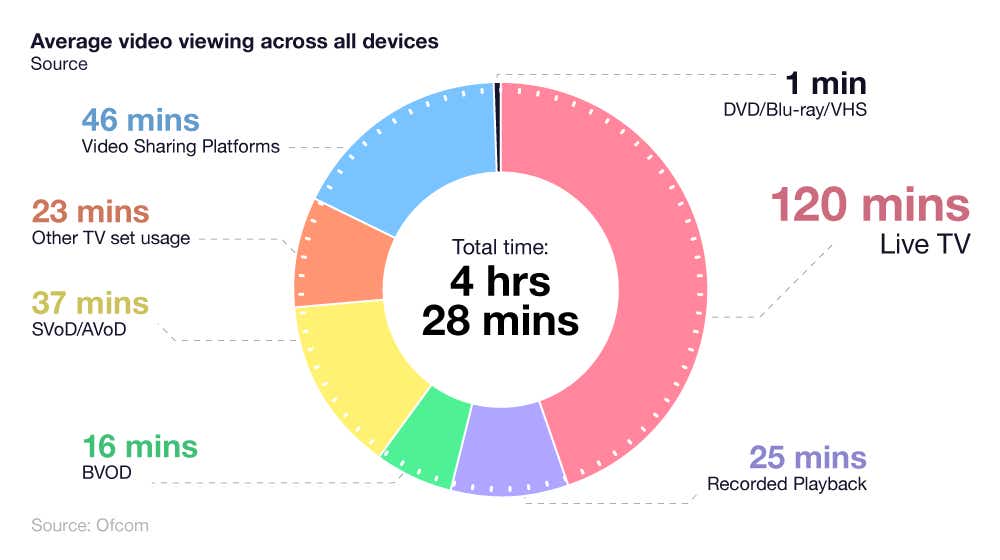
On average, people in the UK spend almost four times as much time watching live TV as they do subscription video-on-demand (SVoD) or advertising video-on-demand (AVoD).
Behind live TV, the second most common reason for screen time is using video-sharing platforms. These sites, such as YouTube, Twitch, and Vimeo, take up almost a fifth (17%) of the average UK person’s daily screen time.
At the other end of the scale, DVD, Blu-Ray, and VHS take up 0.37% of daily UK screen time statistics, indicating how rare these technologies now are in modern society for watching content.
Average daily minutes of screen time in the UK by age
TV viewing statistics from Ofcom indicate that adults over 75 watch considerably more television than younger viewers. In all, around three-quarters (78%) of those aged 75+ will spend their day watching live TV, compared to just 15% for those aged 4-15.
A breakdown of UK screen time statistics by age and type of viewing
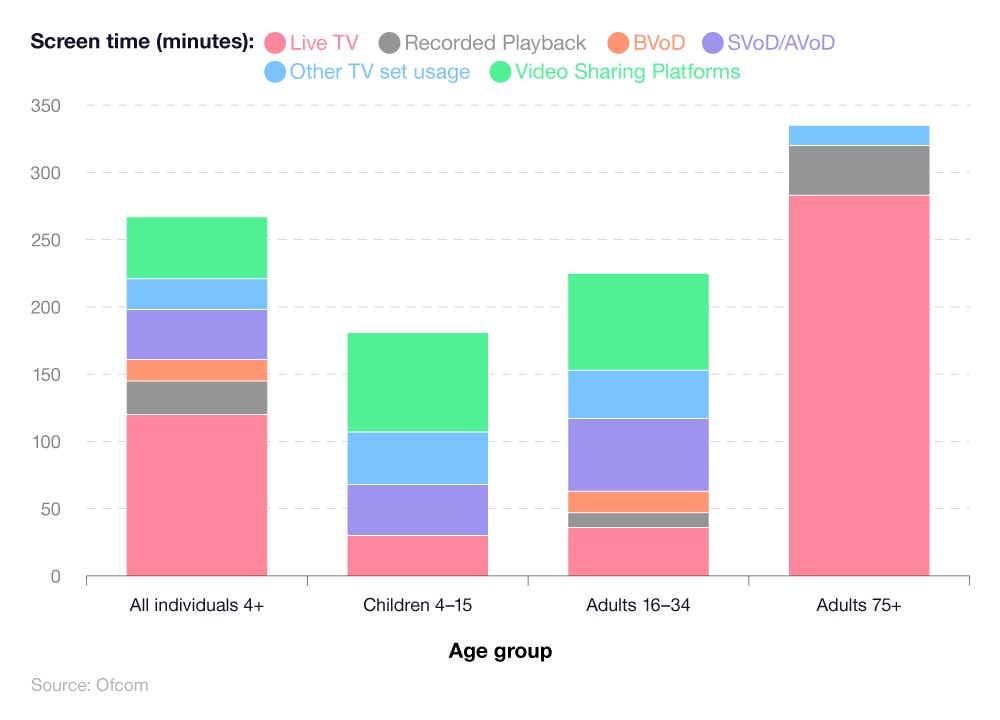
A typical UK adult over 75 watches around 361 minutes of TV per day – almost twice as much as the average child aged 4-15 at 196 minutes.
Almost two-fifths (37.7%) of video watching for children aged 4-15 comes from video-sharing platforms, compared to about 2% for those aged 75 and above
Netflix statistics
Founded in 1997 as a DVD rental service, Netflix transitioned into an online streaming platform in 2007 and has dominated the online streaming industry ever since.
At the start of 2014, Netflix had fewer than three million subscribers (or roughly 4.2% of the UK population). By 2023, this figure had risen more than fivefold, to 16.7 million users. This meant almost one in four (24.7%) UK households had a Netflix subscription at the start of 2024.
How many UK Netflix subscribers are there?
As of Q3 of 2023, Netflix subscriber numbers stood at 16.7 million (an increase of 46% from Q1 2019).
After a steady rise of 7.7% throughout 2019, the number of Netflix subscribers jumped by more than a third (35%) by the end of 2021 – largely as a result of Covid-19 lockdown restrictions meaning more people were forced to stay indoors.
A breakdown of UK Netflix subscriber numbers between 2019 to 2023
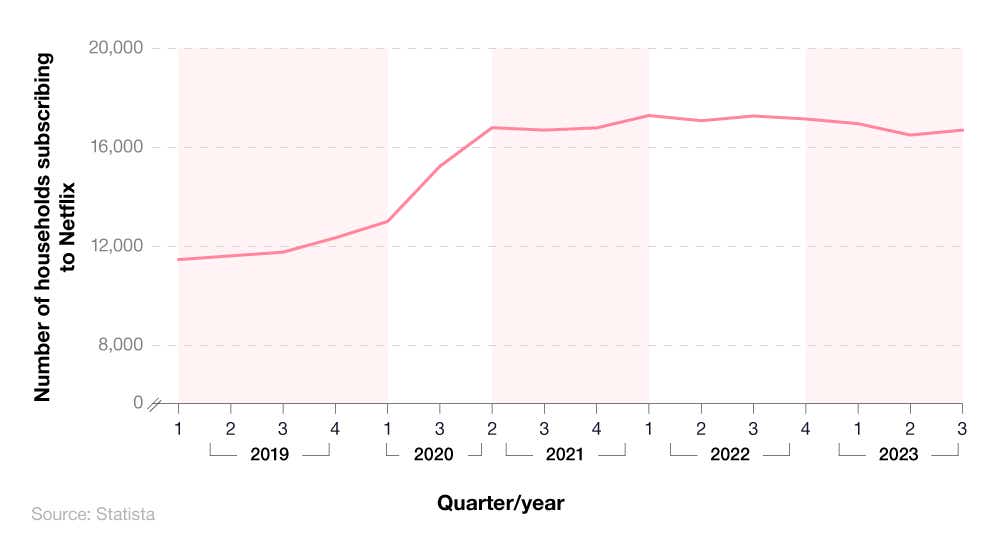
Netflix statistics show that Q2 2022 saw a slight dip in subscriber numbers, losing 120,000 users (or roughly 1% of its subscriber population) by the end of the year.
In Q1 2023, Netflix subscriber numbers dropped below 17 million for the first time since 2021, losing around 2.7% of its user base by the end of Q2.
If you’re one of the many streamers who are wrestling with the cost of living crisis, but are unsure how to cut short your contract, check out our how to save money on your streaming services page.
Netflix revenue statistics
According to Netflix revenue statistics, the amount of money generated globally by the streaming service increased by 88% between Q1 2019 and Q3 2023, from $4.52 billion to $8.54 billion, respectively.
A breakdown of Netflix revenue statistics between 2019-23
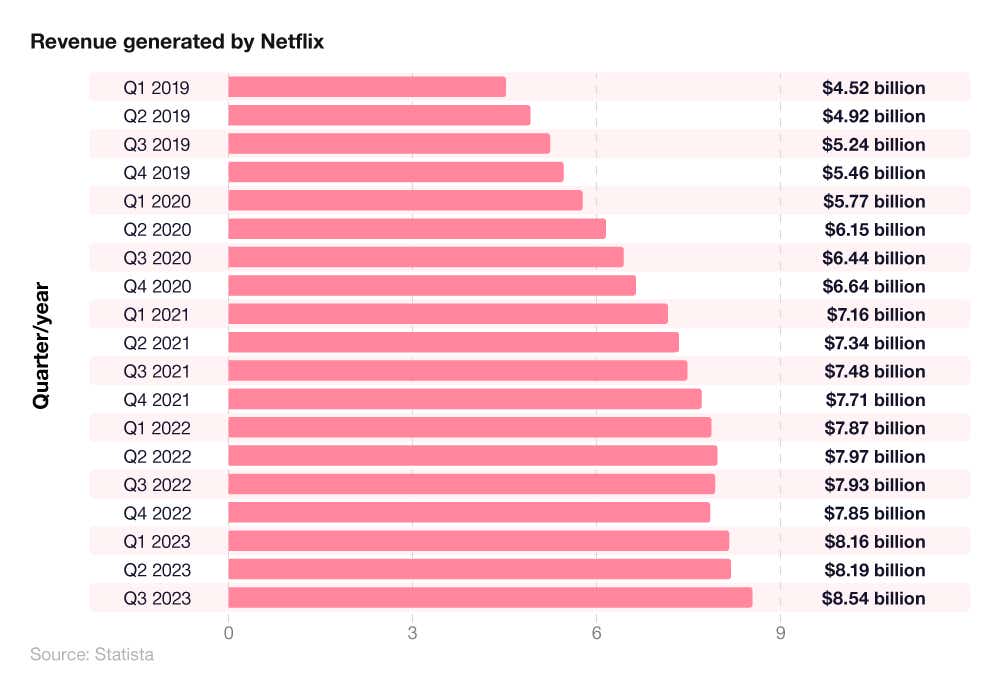
Netflix revenue grew steadily throughout 2019, by an average of 6.4% per quarter. The beginning of the Covid-19 pandemic in 2020 had a positive impact on Netflix's annual revenue figures, exceeding $7 billion by Q1 2021.
However, 2022 saw two consecutive quarters where revenue decreased, dropping by 0.5% in Q2 and a further 1% in Q3.
By 2023, the streaming service bounced back, recording a growth rate of +3.9% on 2022 figures.
Amazon Prime Video statistics
The Amazon Prime streaming service has changed multiple times since its inception in 2006. Originally launched as Amazon Unbox in the U.S., the online streaming platform adopted the Amazon Prime Video feature in 2012, meaning users now have access to a library containing over 31,000 titles.
How many Amazon Prime Video users are there in the UK?
According to Amazon Prime statistics, there were around 13 million Amazon Prime members in the UK as of Q3 2023. This figure is almost double (+118%) the amount from 2019, when respective membership numbers stood at 5.96 million.
It’s worth noting that calculating exactly how many Amazon Prime Video users there are is difficult, as those who subscribe to Amazon Prime may do so for delivery of online shopping and not to stream programmes/films.
A breakdown of the number of Amazon Prime users (2019-23)
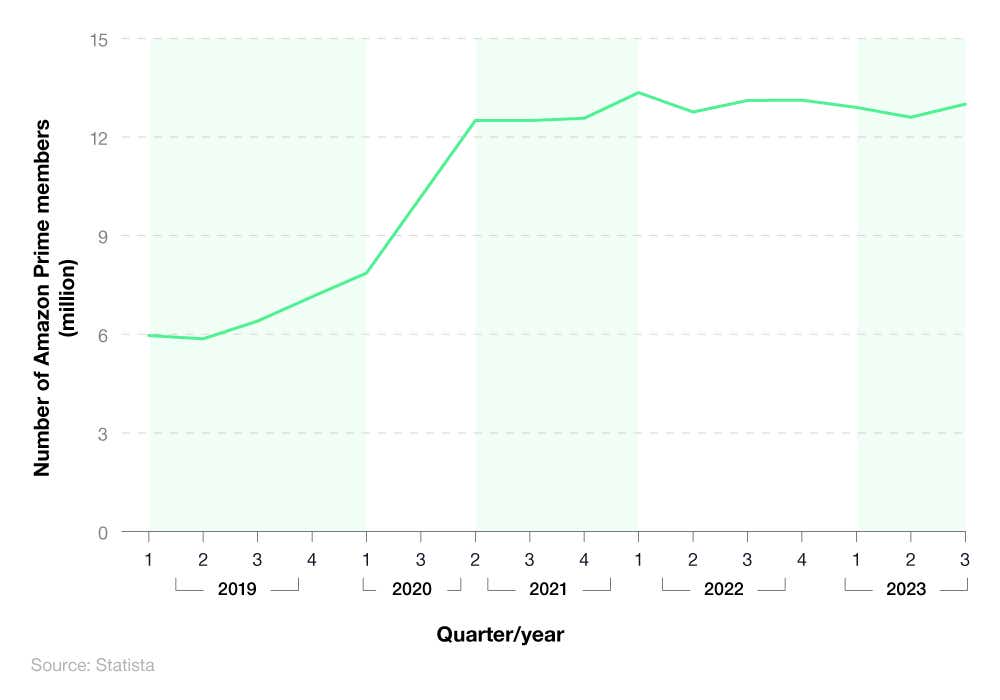
Q3 2020 saw the number of Amazon Prime users exceed 10 million for the first time – a rise of almost a third (29%) in just six months. By Q2 2021, this figure had further increased by more than a fifth (+22%).
A notable decline in UK Amazon Prime user figures came in Q2 2022, when numbers dropped from a peak of 13.35 million to 12.76 million (a fall of 4.4% in just three months).
Between Q2 and Q3 2023, a rise of 400,000 subscribers saw Amazon Prime users reach 13 million for the first time since early 2022.
Disney Plus statistics
Disney Plus was launched in November 2019 and rapidly grew to over 100 million global subscribers by 2021. It now boasts an extensive library from the likes of Pixar, Marvel, and Star Wars franchises.
How many Disney Plus subscribers are there in the UK?
As of Q3 2023, around 7.6 million UK households had a Disney Plus subscription. This represents a 58% increase from Q2 2021 figures.
A breakdown of the number of UK Disney Plus users
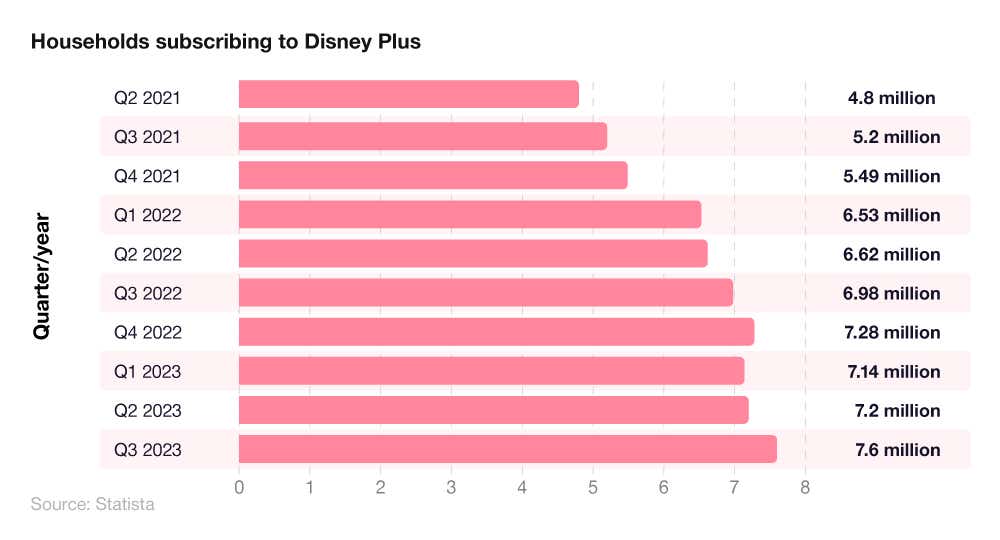
Since 2021, the number of Disney Plus users in the UK has generally increased quarter-on-quarter. In Q2 2021, around 4.8 million UK households had a Disney Plus subscription. Within a year, this had risen by almost two-fifths (+37.5%) to 6.62 million, and a further 9.9% by the end of 2022.
However, a small drop at the start of 2023 saw Disney Plus user figures decrease by around 140,000 members (-1.9%), before bouncing back in Q2 and Q3 of that year.
If you’re keen to be one of the 7.6 million households subscribing to Disney Plus but aren’t sure how to get a subscription, visit our how to watch Disney Plus in the UK guide.
YouTube statistics
YouTube statistics reveal that it has rapidly become the world’s leading online video platform, boasting over two billion logged-in monthly users in 2024. Launched in 2005, YouTube now contains a library of more than 800 million videos (and growing), with more than 500 hours of content uploaded to the site every minute.
What is the average time spent on YouTube per day?
According to Ofcom, the average time spent on YouTube per day in the UK is 23 minutes. However, YouTube video statistics from the Ofcom 2023 Media Nations report suggest a disparity in average viewing time between age groups.
The UK age group that typically spends the longest each day on YouTube are those aged 15-24. On average, those between 15-24 will spend more than three-quarters of an hour (48 minutes) each day browsing YouTube and watching videos.
A breakdown of the average time spent on YouTube per day by different UK age groups
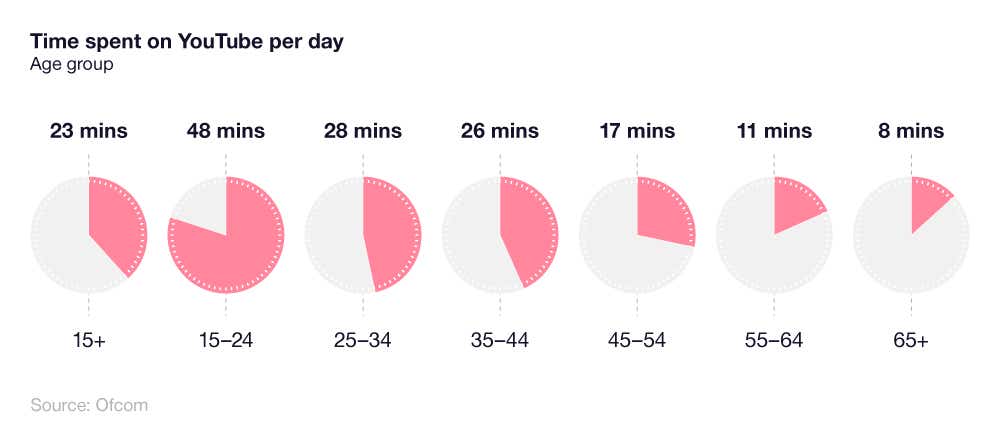
Those between 15-24 watch 52% more YouTube content than their slightly older counterparts (25-34-year-olds) – the next longest average time spent on YouTube per day. Typically, those in this age bracket spend just under half an hour each day (28 minutes) streaming and watching videos on the platform.
The shortest average time spent on YouTube per day is typically those aged 65 and above. On average, those in the oldest age category will spend 8 minutes a day on the platform – six times less than those aged 15-24.
YouTube user statistics
According to YouTube user statistics from Ofcom’s Media Nations report, the most common type of content viewed on YouTube is generally videos up to 15 minutes in length. More than half (53%) of YouTube users watch this type of content – around 8% more popular than videos longer than 15 minutes and 17% more than YouTube Shorts (i.e. those that are 60 seconds or less).
A breakdown of UK YouTube usage statistics by type of content viewed across age groups
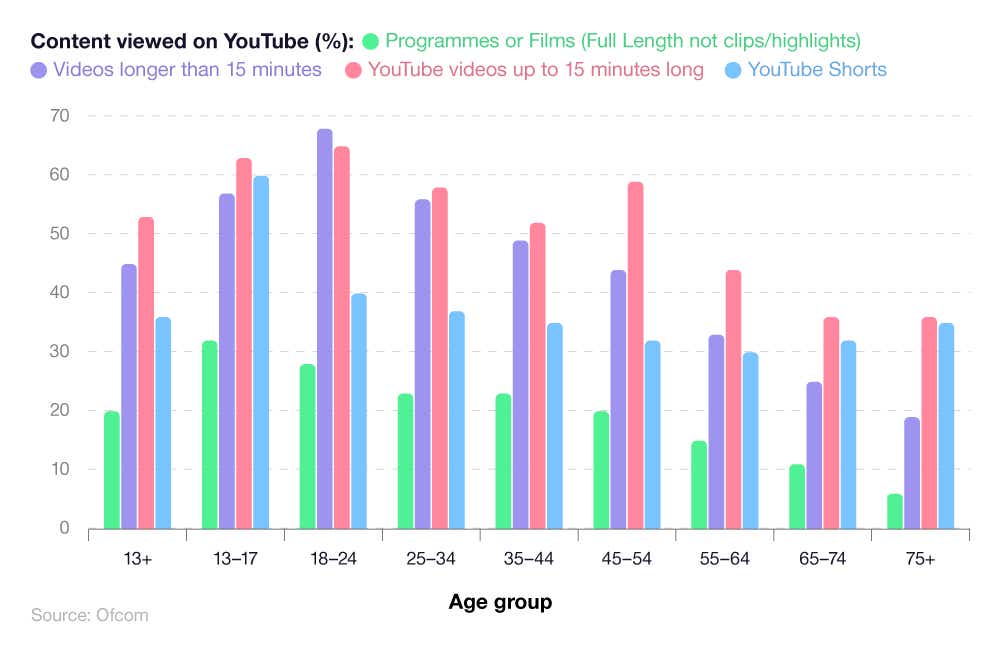
By contrast, the least common types of YouTube content viewed by UK users are programmes or films. Close to a third (32%) of those aged 13-17 watch these types of YouTube content – the highest recorded percentage across all UK age groups. However, the figure gradually decreases with age, down to just 5% of those aged 75+ who turn to YouTube to watch this type of content.
Those aged 18-24 are the only group from the study where videos longer than 15 minutes are the most commonly viewed types of YouTube content. More than two-thirds (68%) of this age group opt for videos longer than 15 minutes, compared to almost two thirds (65%) who prefer watching videos that are between 1-15 minutes in length.
Most common types of YouTube content - short videos
The most popular type of short video content on YouTube is ‘how-to’ videos. According to YouTube usage statistics, ‘how-to- videos are watched monthly by almost two-thirds (64%) of the UK population – just 1% more popular than news-related videos.
A breakdown of the genres viewed at least once a month
| Video Type | Percentage |
|---|---|
| ‘How to’ | 64% |
| News | 63% |
| Videos uploaded by the general public | 59% |
| Videos uploaded by friends/family | 54% |
| Music | 54% |
| Videos/Vlogs uploaded by social media followers | 48% |
| Videos from comedy programmes | 45% |
| Videos from entertainment programmes | 41% |
| Videos/vlogs uploaded by companies followed | 39% |
| Sports including interviews | 37% |
| Videos from chat shows | 36% |
| Videos from drama programmes | 30% |
| Clips from video games | 28% |
(Source: Ofcom)
YouTube user statistics show that short videos are the least popular type of content watched on YouTube. These tend to be clips from video games, with just over a quarter (28%) opting to view these, followed by less than a third (30%) who tend to watch videos from drama programmes.
Most common types of videos viewed on YouTube by 3-12-year-olds
UK child screen time statistics from Ofcom show that the most popular type of YouTube videos viewed by 3-12-year-olds are funny clips. Just under half (49%) of children from the study admitted to watching this type of content – a sevenfold increase from just 12 months earlier. This was followed by more than two-fifths (44%) of 3-12-year-olds who prefer to watch videos by YouTubers.
A breakdown of UK child screen time statistics based on the most common type of content
| Type of Video | Percentage |
|---|---|
| Funny Clips | 49% |
| YouTubers | 44% |
| Music Videos | 36% |
| Gamers | 28% |
| Episodes | 26% |
| Unboxing | 15% |
| Movie trailers | 15% |
| Tutorials | 14% |
| Education | 9% |
| Sports Clips | 8% |
| Nursery rhymes | 7% |
| YouTube Live | 6% |
| Challenge videos | 6% |
| Vlogs | 5% |
| Don’t Watch | 4% |
| 360 videos | 2% |
(Source: Ofcom)
The least popular type of YouTube content for those aged 3-12 were 360 videos and those categorised as “Don’t Watch”, with just 2% and 4% of respective children stating they watched this type of video on YouTube.
Twitch statistics
Founded in 2011 originally as a spin-off for Justin.tv, Twitch is a live streaming online platform that primarily focuses on video games.
Twitch streaming statistics indicate that, as of 2024, the UK is home to some 13.4 million Twitch users, accounting for 5.23% of the global Twitch population. Each week, an average of 2.6 million people tune into Twitch from around the world to stream content and play games across some 107,000 channels on offer.
Average Twitch viewing statistics
According to Twitch viewing statistics, there were an average of 2.6 million concurrent viewers using the platform in 2024. This is around 180,000 less than the peak of 2.78 million recorded in 2021.
A breakdown of average Twitch viewing statistics by year
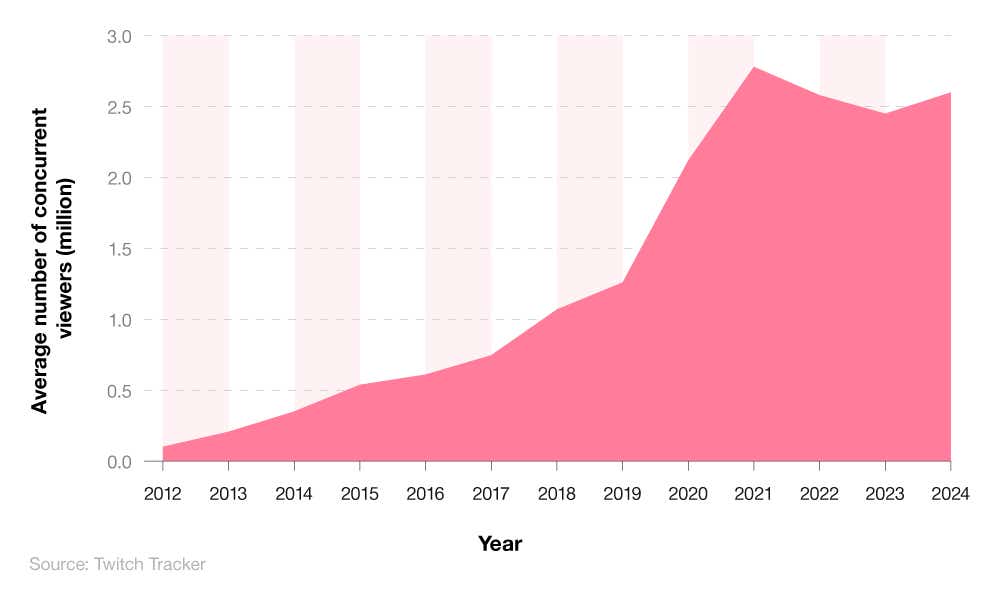
Between 2012-21, the average number of concurrent Twitch users experienced year-on-year growth, from 102,000 to 2.78 million. Since then, viewership figures have fluctuated, dipping by 330,000 between 2021-23, before rising again in 2024 by 150,000 users.
Distribution of Twitch users by age
According to a Twitch statistics 2021 survey, the vast majority of Twitch users are aged 25-34, with almost two-fifths (39%) of those surveyed falling into this category.
A breakdown of the UK Twitch population by age group
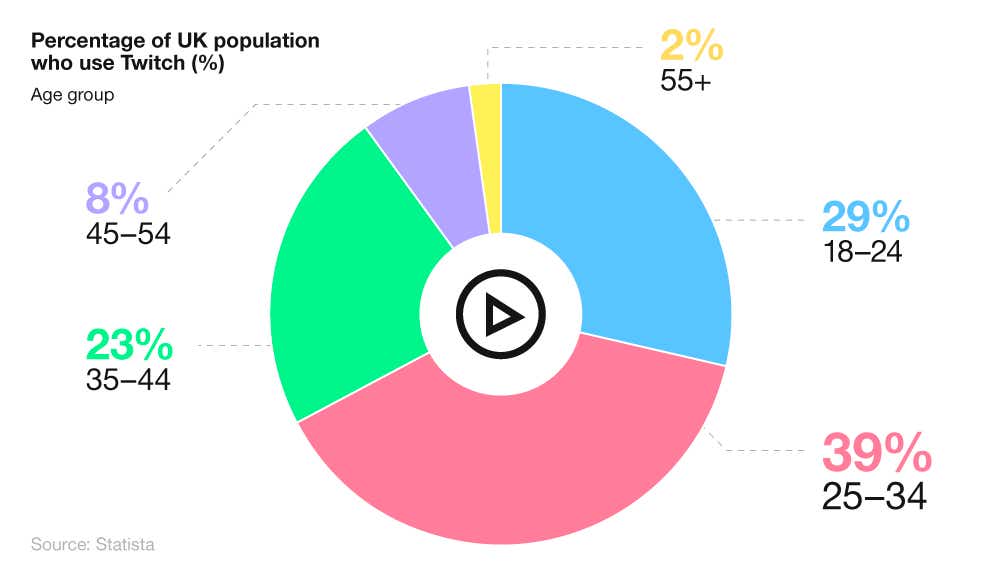
This was followed by the youngest age group (18-24), which accounted for just under a third (29%) of the total UK Twitch population. In all, this means that more than two-thirds (68%) of UK Twitch users are typically under 34.
Average number of Twitch concurrent channels
As of 2024, there were an average of 107,000 concurrent Twitch channels in existence – the highest recorded number in the platform's history.
A breakdown of the average number of Twitch channels by year
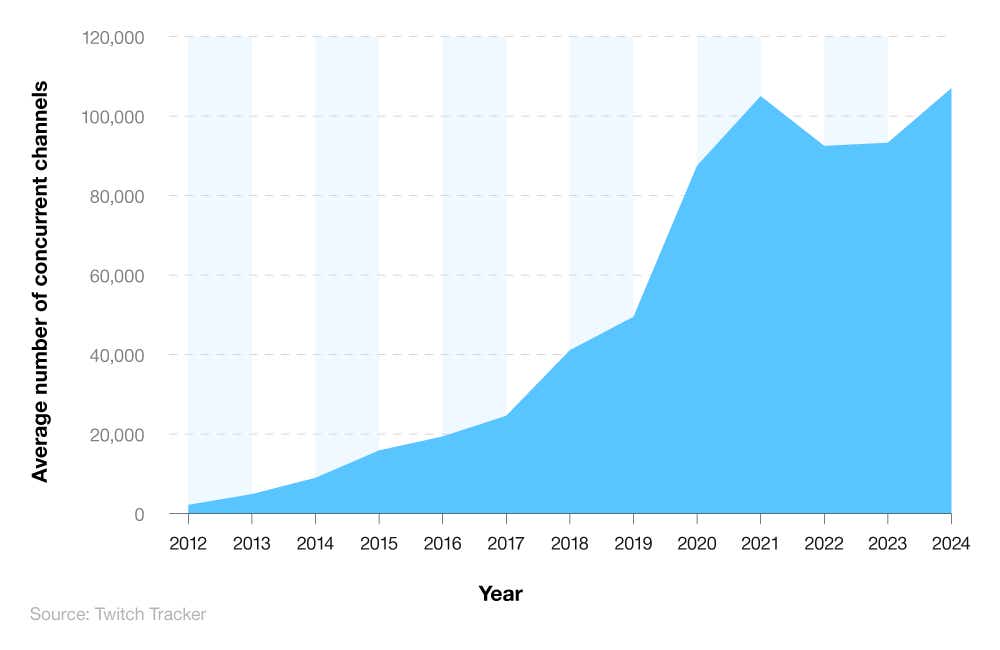
In 2012, just 2,200 concurrent channels existed on average for the year, which gradually rose year-on-year to 105,000 by 2021. These figures fluctuated between 2021-24, dipping by 12,500 in 2022-23, before rising again by 13,700 in 2024.
Average number of Twitch monthly broadcasters
Twitch streaming statistics indicate that, as of 2023, an average of 7.3 million people were broadcasting on Twitch each month – around 1.16 million less than the peak of 2021.
After its inception in 2011, some 300,000 people were broadcasting on average each month in 2012. This trebled the following year before breaking the one million mark in 2014 for the first time.
A breakdown of the average number of monthly Twitch broadcasters over time
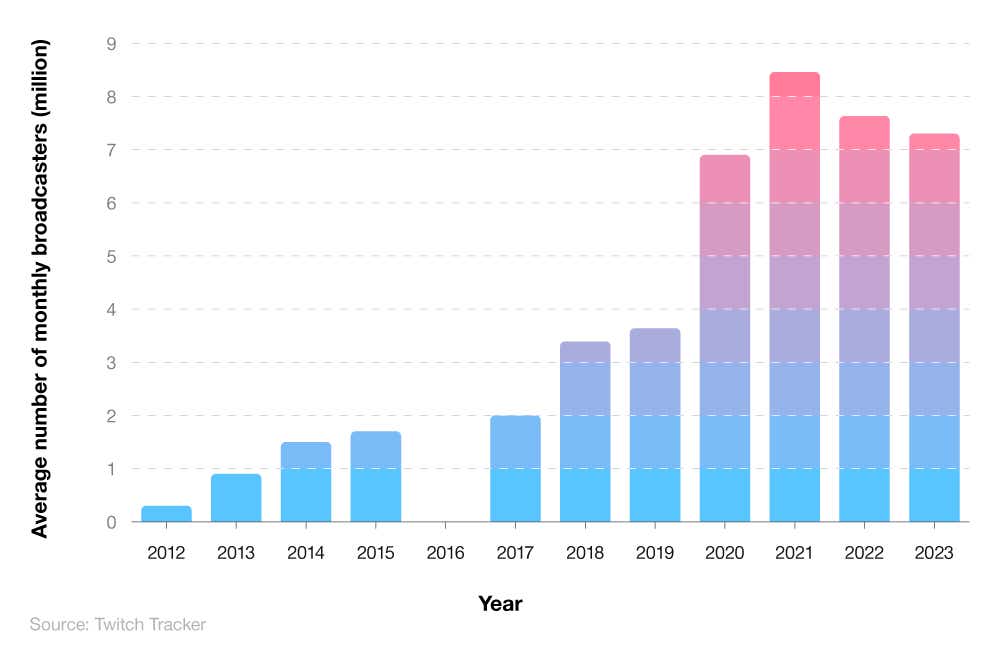
Subsequent years saw year-on-year growth in the number of Twitch broadcasters (apart from 2016, when unfortunately, no data was collected). The Covid-19 pandemic years were also significant for Twitch when the broadcast population almost doubled between 2019-20 up to 6.9 million people.
Music streaming statistics 2024
Very few technological innovations have impacted the global media and entertainment industry more than the introduction of music streaming.
By 2022, the number of people streaming music worldwide exceeded 616.2 million, with less than a third (30.5%) subscribing to Spotify – almost double the market share of Apple Music.
Music streaming industry market revenue
The global music streaming market is expected to be worth £26.64 billion in 2024. With an anticipated compound annual growth rate (CAGR) of 5.02%, this means its market revenue could reach £34.04 billion by 2028.
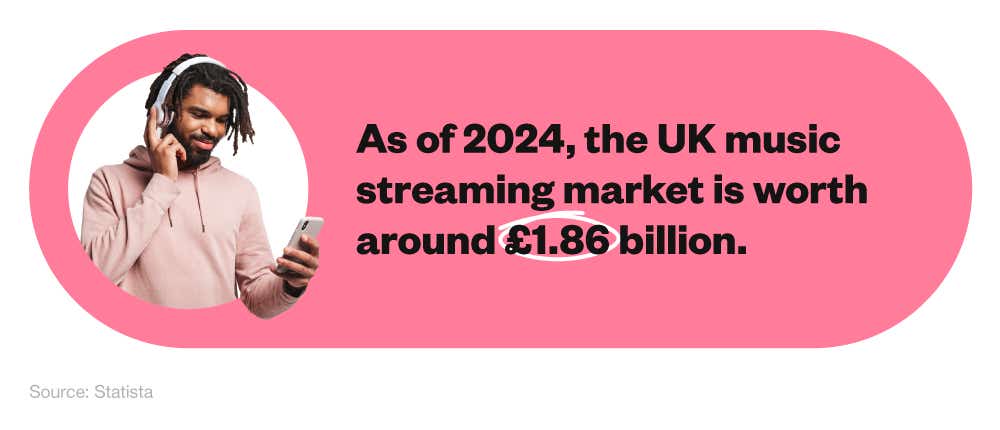
The UK music streaming market accounts for roughly 7% of total global music revenue, and is projected to be worth £1.86 billion by the end of 2024. With a forecast CAGR of 4.09%, this would result in a market value of £2.1 billion by 2028.
As of 2024, around two-fifths (38.2%) of the UK population stream music online in some capacity, equating to some 25.8 million people. By 2027, this figure is predicted to reach 29.4 million (or 42.1% of the population).
As a number of industry services have shifted, consumers are now turning to streaming in favour of downloading music, with the former now accounting for 94.3% of total music industry revenue in the UK.
How much money does Spotify make in a year?
Spotify’s annual revenue for 2023 stood at approximately $14.337 billion – a 16% increase from 2022 figures.
UK music sales statistics
Since the Covid-19 pandemic, the UK entertainment industry has flourished in terms of revenue from sales, rising by almost 50% between 2019-23.
In 2023, the UK entertainment industry recorded sales figures of £23.75 billion, with the majority (50%) coming from home entertainment. Music sales contributed the smallest percentage at 9.3%.
A breakdown of UK entertainment sales statistics over time
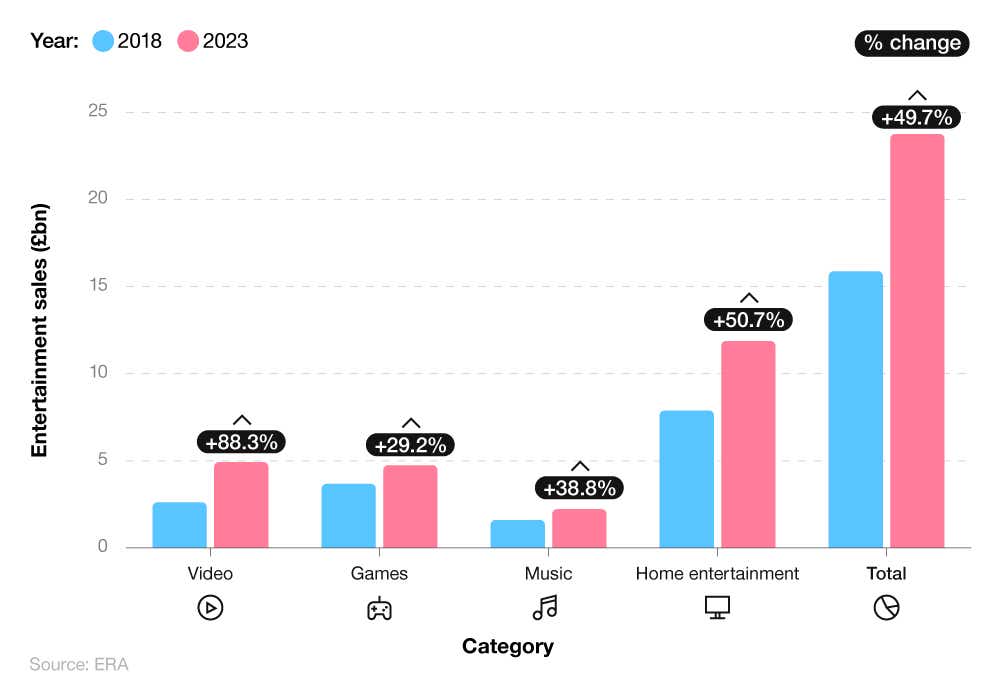
In all, music sales figures in the UK increased by almost two-fifths (38.8%) across this four-year period.
A breakdown of UK music sales statistics by category
| Type | 2,022 | 2023 | % change |
|---|---|---|---|
| Physical | £280.4mn | £311.0mn | 0.109 |
| Downloads | £45.4mn | £42.7mn | -5.90% |
| Streaming | £1.70bn | £1.87bn | 0.098 |
| Total | £2.04bn | £2.24bn | 0.098 |
(Source: ERA)
Total UK music sales for 2023 equated to around £2.24 billion – about 9.8% greater than 2022 figures.
Music streaming stats show that more than four-fifths (83.5%) of this came from people listening to music online, to the tune of £1.87 billion. This represented a rise of £170 million in revenue generated from online streaming in 2022.
Cost of streaming music per platform
Payouts from streaming platforms may vary according to a number of factors, such as the contract an artist has with their record label, as well as listener location and the type of subscription they have to that particular streaming service.
As of 2023, artists on Tidal received the highest average payout per stream at £0.01. This is around one-and-a-half times more than the typical artist on Apple Music, who receives an average of £0.0025 per stream.
A breakdown of average payout per stream across different music platforms
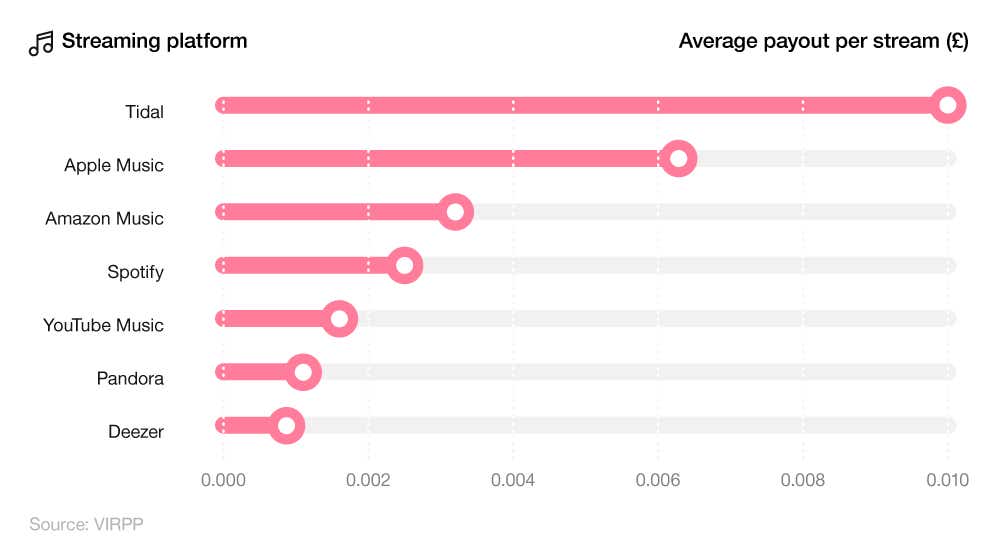
By contrast, the average artist on Deezer receives the least income across the UK’s seven main music streaming platforms. At £0.00087 per stream, this is around 11 times less than a typical artist streaming via Tidal.
To put this into context, if your track was streamed a million times on Tidal, you could expect to earn something in the region of £10,000. By comparison, the average artist on Spotify would earn around £2,500, compared to just £870 for the typical musician on Deezer.
Cost of music streaming services in the UK
As of 2024, BBC Sounds offers the cheapest cost of music streaming in the UK to those platforms that require a subscription. BBC Sounds members can access its library free by signing up to their music streaming service, offering a variety of programmes, podcasts, audiobooks, and music mixes.
A breakdown of the cost of music streaming services in the UK across different platforms
| Platform | Cheapest paid subscription per month (as of 2024) |
|---|---|
| BBC Sounds | £0.00 |
| SoundCloud Go | £5.99 |
| Amazon Music (for Prime members) | £9.99 |
| SoundCloud Go+ | £9.99 |
| Amazon Prime (for non-Prime members) | £10.99 |
| Apple Music | £10.99 |
| Deezer | £11.99 |
| Spotify | £10.99 |
| Tidal | £10.99 |
| YouTube Music | £10.99 |
| Qobuz | £12.99 |
(Source: Save The Student)
The average cost of music streaming services in the UK tends to range between £9.99 and £10.99 a month.
SoundCloud Go subscribers can access a basic service for £5.99 per month, but will need to pay almost double that amount for the SoundCloud Go+ membership.
Most streamed songs on Spotify
As of February 2024, “Blinding Lights” by The Weeknd was the most streamed song on Spotify, having been listened to more than four billion times since its release in November 2019.
A breakdown of the 10 most streamed songs on Spotify of all time
| Rank | Song | Artist | Streams (billions) | Release date |
|---|---|---|---|---|
| 1 | Blinding Lights | The Weeknd | 4.075 | 29 Nov 2019 |
| 2 | Shape of You | Ed Sheeran | 3.788 | 6 Jan 2017 |
| 3 | Someone You Loved | Lewis Capaldi | 3.223 | 8 Nov 2018 |
| 4 | Sunflower | Post Malone and Swae Lee | 3.166 | 18 Oct 2018 |
| 5 | Starboy | The Weeknd ft. Daft Punk | 3.047 | 21 Sep 2016 |
| 6 | As It Was | Harry Styles | 3.03 | 1 Apr 2022 |
| 7 | One Dance | Drake ft. Wizkid and Kyla | 3 | 5 April 2016 |
| 8 | Dance Monkey | Tones and I | 2.995 | 10 May 2019 |
| 9 | Stay | The Kid LAROI and Justin Bieber | 2.957 | 9 Jul 2021 |
| 10 | Rockstar | Post Malone ft. 21 Savage | 2.88 | 15 Sep 2017 |
(Source: Chartmasters)
This puts the Canadian artist around 287 million streams ahead of Ed Sheeran in second place and more than 850 million ahead of Lewis Capaldi in third.
Incidentally, ‘As It Was’ by Harry Styles was only released on 1 April 2022. With more than three billion streams in just 18 months, this propelled the former One Direction star to sixth in the world Spotify rankings of most streamed songs.
UK music streaming population
As of 2023, just under half of the UK population (47%) stream music online. According to music streaming stats from Ofcom’s Media Nations Report 2023, this figure represents an increase of 16 percentage points from 2018, when just under a third (31%) of UK adults would regularly stream music each week.
A breakdown of the weekly reach of streamed music by age group in the UK over time
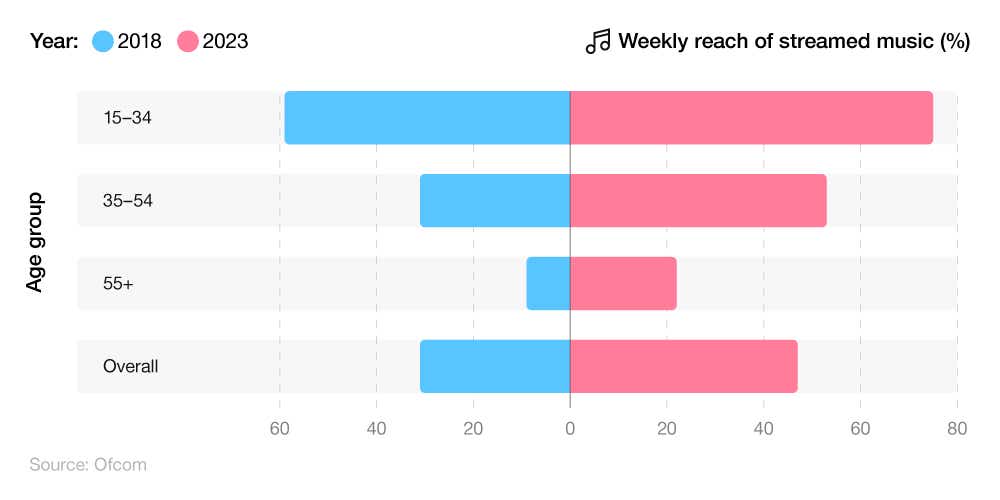
When broken down by age groups, those between 15-34 are the most common streamers of music, with three-quarters (75%) doing so on a weekly basis. This is around three-and-a-half times more than those aged 55+, where just over a fifth (22%) listen to music online each week.
Compared to 2018 figures, the percentage of people aged 55 and over who stream music weekly has more than doubled, from 9% to 22%. Likewise, just under three-fifths (59%) of 15-34-year-olds streamed music online in 2018, which jumped by almost a quarter by 2023.
Most common music streaming platforms in the UK
According to music streaming stats from Ofcom, around three-fifths (61%) of UK adults spend their time streaming music via the Spotify Premium service, making it the most popular music streaming platform in the UK as of 2023.
A breakdown of the popularity of different music streaming platforms in the UK
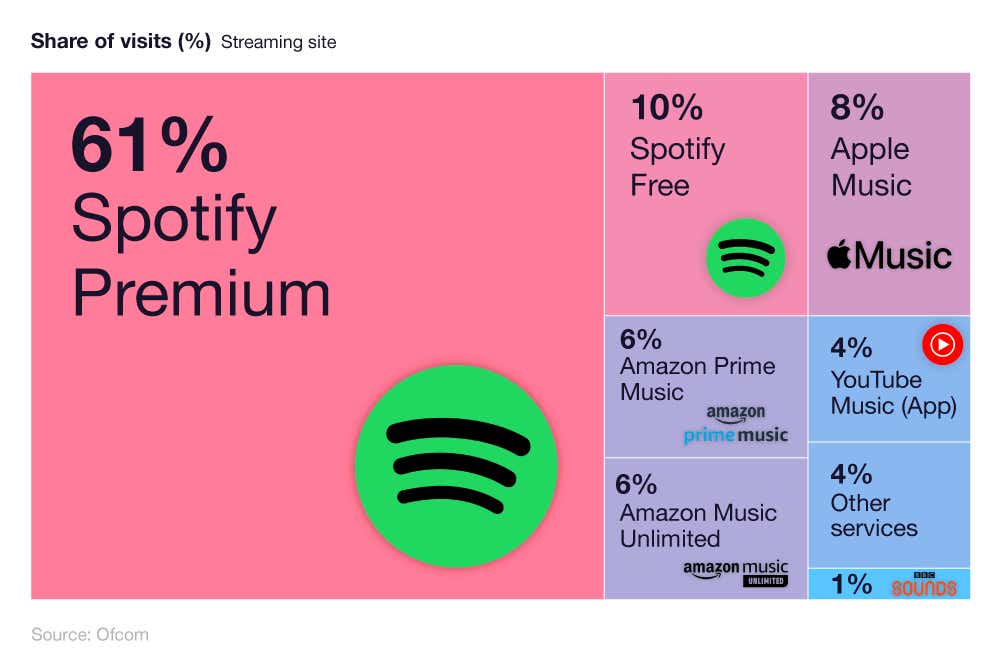
Spotify Premium is around six times more popular than its Spotify Free counterpart. Combined, this means for every 10 minutes spent by UK adults streaming music, seven of those are typically via Spotify (in some capacity).
UK podcast population statistics
As of 2023, just under a fifth (19.6%) of UK adults listen to podcasts on a weekly basis. This figure has almost doubled from 2018, when just over 10% were streaming podcasts weekly.
A breakdown of the weekly reach of podcasts in the UK by age group over time
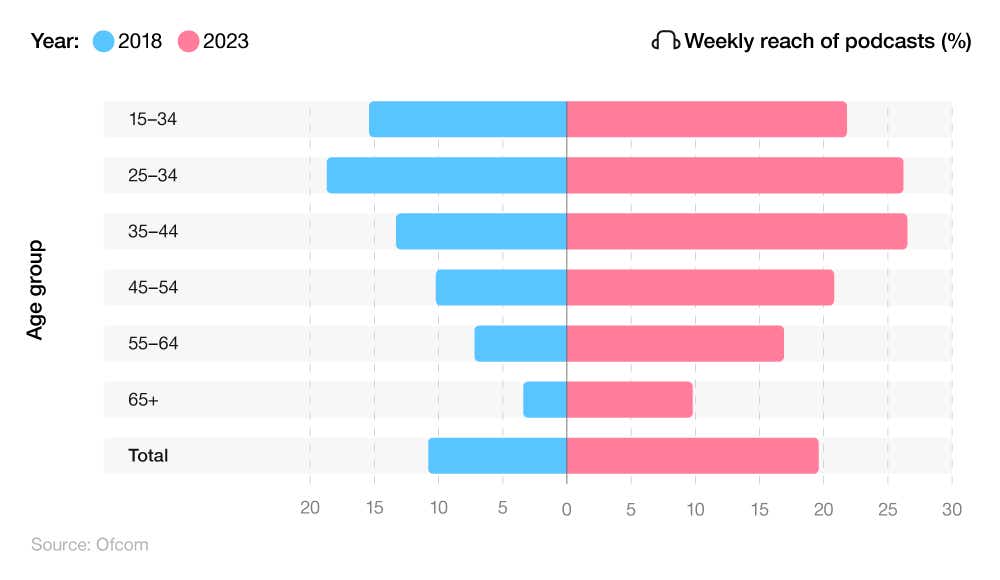
When broken down by age group, podcast streaming stats reveal just over a quarter of those aged 25-34 and 35-44 are listening to podcasts each week in the UK (26.2% vs 26.5%, respectively. This makes up more than half (52.7%) of the UK podcast population.
Back in 2018, around half the number of 35-44-year-olds were streaming podcasts each week in the UK, making them only the third most likely age group to do so. However, by 2023, they are typically the most common age group to listen to podcasts (albeit just 0.3% more than those between 25 and 34).
Online sports streaming statistics
Online sports streaming refers to the broadcasting of sports matches and events in real-time via a digital device that is connected to the internet.
According to global sport streaming statistics from YouGov, around two-thirds (67%) of the global population regularly stream and watch sports online. This equates to an online sport streaming population of around 5.43 billion people worldwide.
A survey by Grabyo found that 80% of UK sports fans prefer watching sport exclusively on streaming platforms. Their study also found that:
Two in five (40%) UK sports fans regularly use online streaming platforms to watch sport – making it the most common medium for doing so across the country.
The number of fans using pay-TV networks for viewing sports has dropped by more than a quarter (27%) since 2021.
The number of people using smartphones to view sporting content online has increased by 47% between 2021-22.
Online sports streaming industry market
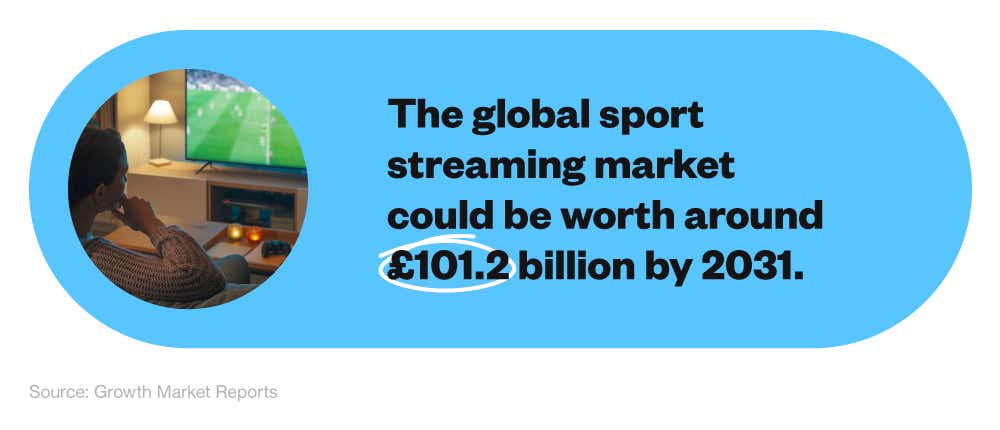
The global sport streaming market was valued at $27 billion in 2022. With a compound annual growth rate (CAGR) of 24.8%, this is expected to reach $101.2 billion by 2031.
Most popular sports streamed online
As of 2023, football (soccer) is the most watched sport in the world, viewed by just over half (53%) of those surveyed by GWI.
A breakdown of the most watched sports in 2023
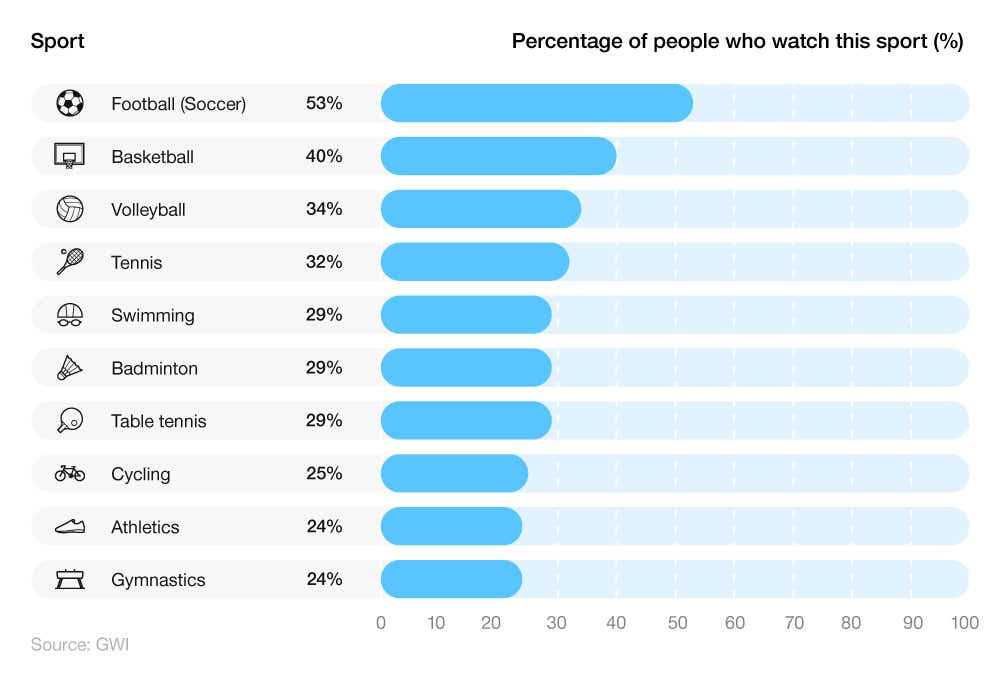
Around two-fifths (40%) of people watch basketball, making it the second-most viewed sport in the world in 2023, followed by just over a third (34%) who tune in for volleyball.
Most popular sporting events streamed online
According to average viewing figures from 888sport, the Tour De France is widely regarded as the most-watched sporting event in the world, as of 2024, with 3.5 billion viewers. This equates to around two-fifths (43.2%) of the global population who tune in to watch one of the world’s most iconic cycling events.
A breakdown of the most watched sports events of all time
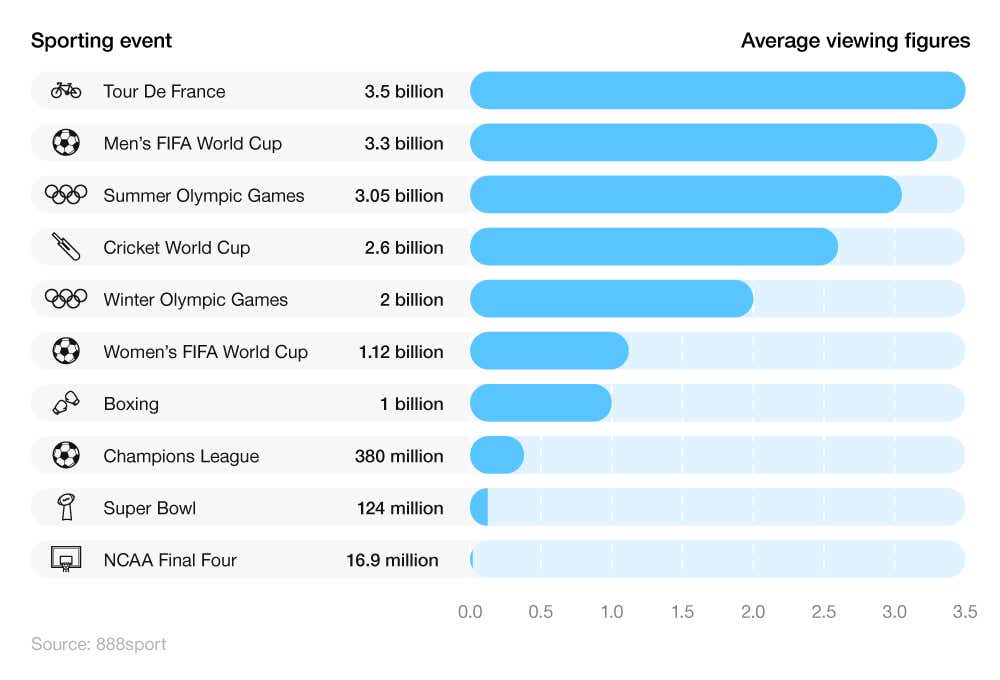
Knowing exactly how many people watch a particular sporting event is difficult to calculate as there is no standardised metric for doing this across all platforms, events, and countries.
That said, closely behind the Tour De France is the Men’s FIFA World Cup. Hosted every four years, viewing figures for the tournament typically reach around 3.3 billion globally.
The only other sporting event to register more than three billion viewers on average is the Summer Olympic Games, with around 250 million fewer viewers than the Men’s FIFA World Cup.
A breakdown of the most watched televised sports events in the UK of all time
| Rank | Event | Average TV audience (millions) | Date |
|---|---|---|---|
| 1 | 1966 Men’s FIFA World Cup final: England vs West Germany | 32.3 | 30 July 1966 |
| 2 | Men’s UEFA Euro 2020 final: Italy vs England | 29.85 | 11 July 2021 |
| 3 | Men’s 1970 FA Cup Final: Chelsea vs Leeds United | 28.49 | 29 April 1970 |
| 4 | Fight of the Century (Ali vs Frazier) | 27.5 | 8 March 1971 |
| 5 | Rumble in the Jungle (Ali vs Foreman) | 26 | 30 October 1974 |
(Source: Various broadcast figures via Wikipedia)
As each country reports and records its average TV viewership statistics differently, it’s difficult to judge exactly what are the most watched television sports events across the world.
However, average TV viewing statistics suggest that the Men’s 1966 FIFA World Cup final was the most-watched sporting event in the UK of all time. With an average audience of 32.3 million, this even surpasses the funeral of Diana, Princess of Wales in 1997 by 200,000 viewers to also make it the most-watched special event in all of UK TV history.
The top three are completed with two more football events: the Men’s 2021 Euro Final between Italy and England attracted around 1.36 million viewers more, on average, compared to the Men’s 1970 FA Cup Final between Chelsea and Leeds.
Two fights involving Muhammed Ali make up fourth and fifth in the UK’s most-watched sporting events of all time, both receiving at least 26 million viewers per contest.
Sport streaming statistics by age and gender
Global sport streaming statistics from YouGov suggest that almost three-quarters (74%) of those aged 18-24 regularly engage with online sport streaming, making them the most common age group to do so.
A breakdown of global sport streaming statistics by age and gender
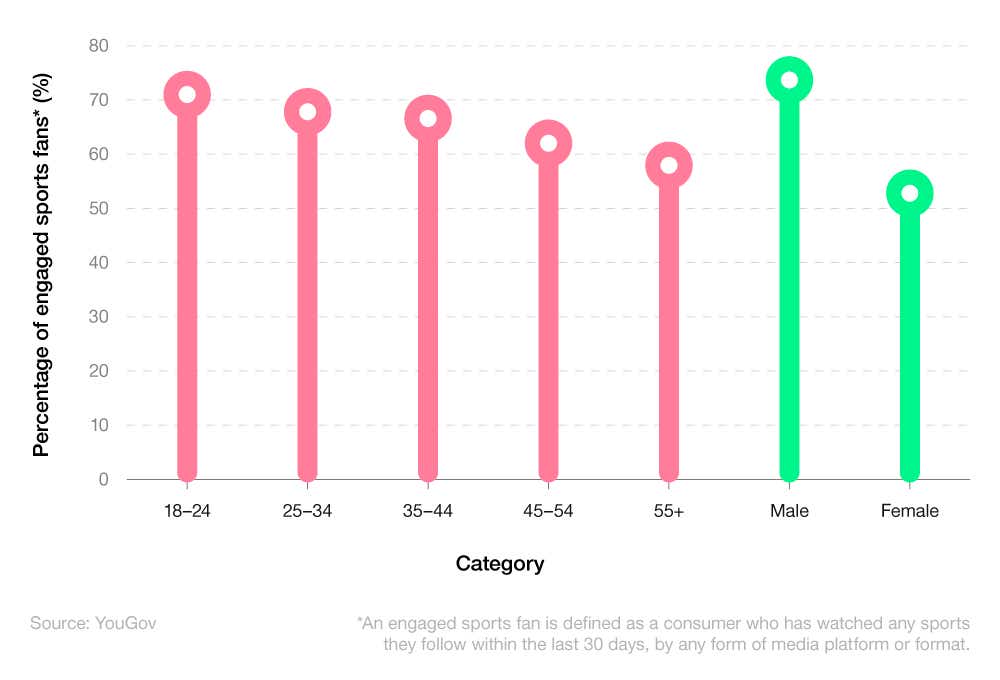
Generally speaking, as people get older, they engage slightly less with streaming sports online, falling to around three-fifths (61%) of those aged 55 and above.
When broken down by gender, more than three-quarters (77%) of males regularly watch sports online, compared to just over half of females (56%).
Most popular methods of engaging with sport content online
For engaged fans, watching live sports on TV is the most popular way to watch sports, with more than half (51%) admitting they use this form of media.
A breakdown of global sport streaming statistics by method of watching sports online
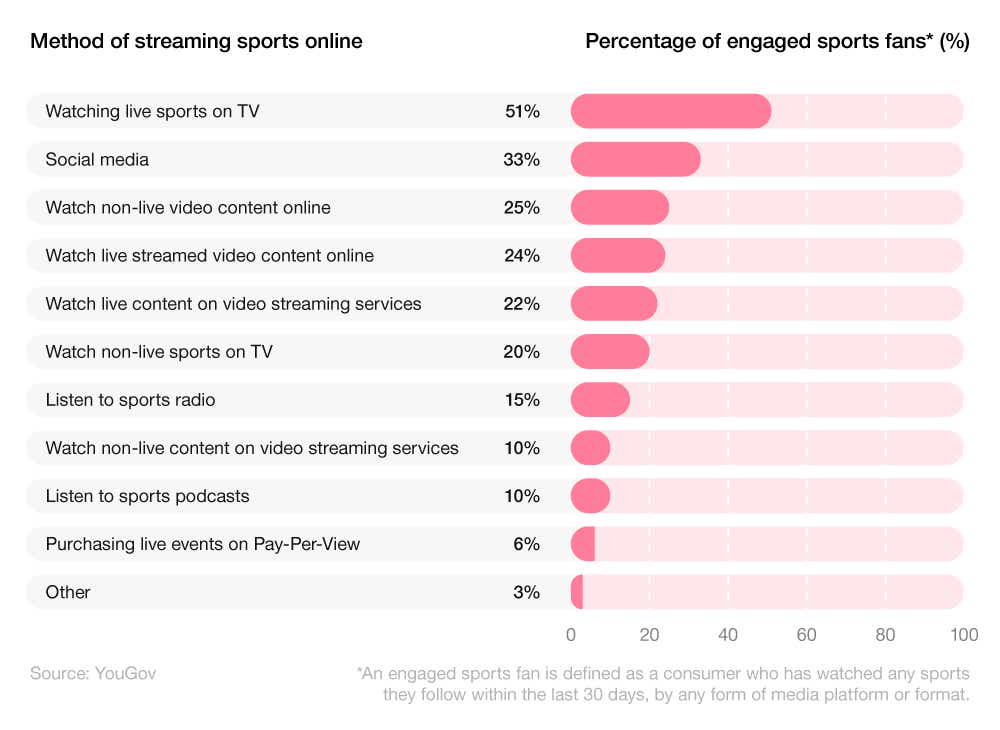
A third (33%) of those who regularly stream sports will turn to social media, followed by a quarter (25%) who watch non-live video content online. A roughly equal number (24%) also regularly engage with live streaming as a method of watching sport.
Esports statistics
According to online gaming statistics, as of February 2024, there were 50,448 Esports competitions and events taking place around the world, across 140 different online games.
In total, this involved some 238,657 matches between 40,342 teams and 61,557 Esports players.
Esports market statistics
The global Esports market is expected to generate a revenue of £3.41 billion in 2024. With a compound annual growth rate (CAGR) of 7.1%, this figure is forecast to reach £4.52bn by 2028.
As of 2024, around 11.7% of the world’s population is estimated to participate in the Esports market, equating to almost 948 million people worldwide.
Esports growth statistics suggest that this figure could reach 13.7% of the global population by 2028.
A breakdown of Esports market statistics by source of income
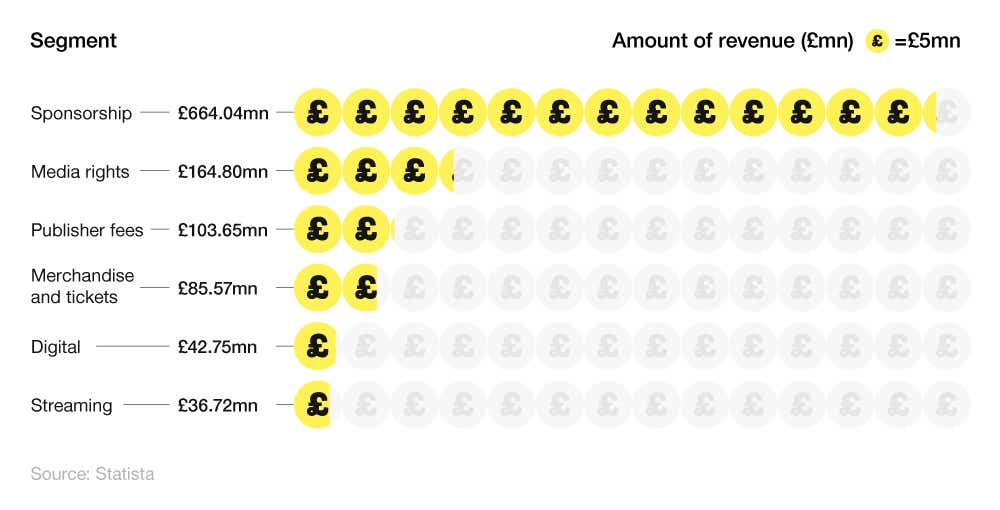
As of 2022, the Esports industry generated almost £1.1 billion in global revenue. Three-fifths (60.5%) of this came from sponsorship deals – the most common source of income for the Esports industry in 2022.
Streaming makes up the smallest proportion of revenue within the Esports industry, accounting for just 3.3% of the global total.
Esports viewership statistics
As of 2022, there were around 532.1 million Esports viewers in the world. Just under half of these (49%) were ESport enthusiasts, with the remaining 51% made up of occasional viewers.
A breakdown of Esports viewership statistics over time
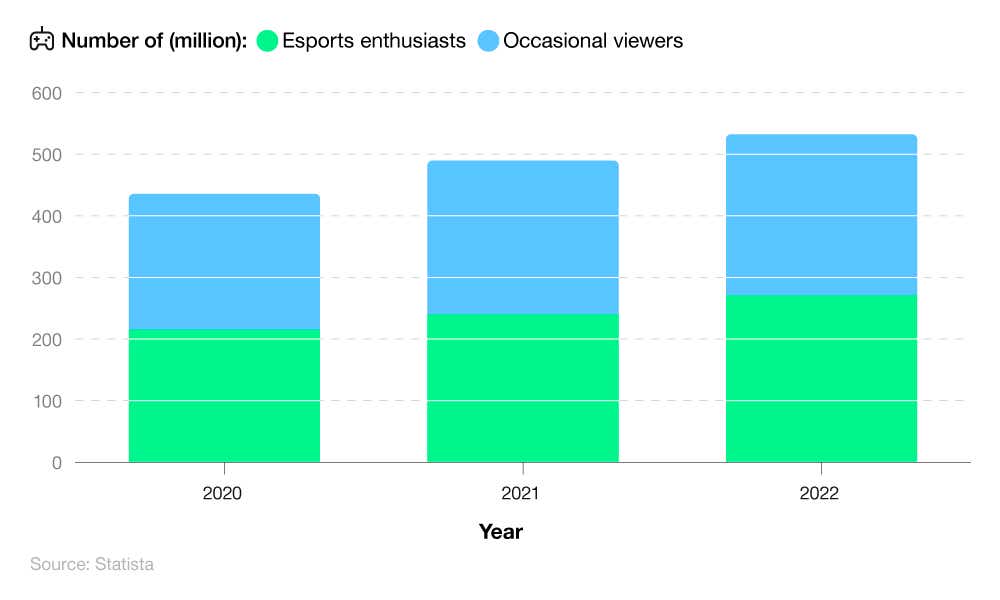
Since 2020, the number of Esport viewers has increased by more than a fifth (22%).
By 2025, it’s predicted that this figure could increase further to 640.8 million Esports watchers worldwide – a fifth (20%) more than 2022 figures.
Top Esports players of all time
As of February 2024, the highest-earning Esports player in the world is NOtail (a.k.a. Johan Sundstein) of Denmark, who has earned nearly $7.2 million to date. This is around $700,000 more than JerAx (Jesse Vainikka) of Finland, as the second highest earning Esports player of 2024. Of the top 10, all of them play Dota 2. Launched in 2013, Dota 2 is the highest paying game, with a prize pool of $111.7 million.
A breakdown of the top 10 Esports players of all time by total winnings
| Rank | Player | Favoured game | Age | Total winnings ($) | Peak viewers | Total matches | Total tournaments |
|---|---|---|---|---|---|---|---|
| 1 | NOtail (Johan Sundstein) | Dota 2 | 30 | $7,184,163 | 1,965,328 | 323 | 65 |
| 2 | JerAx (Jesse Vainikka) | Dota 2 | 31 | $6,486,623 | 1,965,328 | 262 | 54 |
| 3 | Ceb (Sebastian Felix Albert Debs) | Dota 2 | 31 | $5,891,342 | 1,965,328 | 313 | 64 |
| 4 | Topson (Topias Miikka Taavitsainen) | Dota 2 | 25 | $5,722,674 | 1,965,328 | 276 | 53 |
| 5 | Miposhka (Yaroslav Naidenov) | Dota 2 | 26 | $5,635,952 | 2,741,514 | 472 | 76 |
| 6 | Yatoro (Illya Mulyarchuk) | Dota 2 | 20 | $5,407,553 | 2,741,514 | 320 | 45 |
| 7 | Collapse (Magomed Khalilov) | Dota 2 | 21 | $5,403,791 | 2,741,514 | 325 | 47 |
| 8 | Mira (Miroslaw Kolpakov) | Dota 2 | 24 | $5,389,579 | 2,741,514 | 288 | 40 |
| 9 | KuroKy (Kuro Salehi Takhasomi) | Dota 2 | 31 | $5,291,422 | 1,965,328 | 486 | 84 |
| 10 | Miracle (Amer Al-Barkawi) | Dota 2 | 26 | $4,889,085 | 1,965,328 | 435 | 75 |
However, when averaged out per match, JerAx has a slightly better return the Sundstein ($24,758 vs $22,242). That said, the Dane has higher Esports earnings per match than his Scandinavian counterpart, at $110,526 vs $99,794, respectively.
UK online streaming FAQs
Is Netflix the biggest streaming service?
Netflix is one of the largest and most popular streaming services globally, known for its extensive library of films, television shows and original content. In the UK, Netflix leads the way in terms of the number of subscribers, and globally it makes more revenue than the other streaming services. However, it faces stiff competition from the likes of Amazon Prime, Disney Plus and HBO Max.
Do people still watch TV?
Yes, although the watching of live TV is in decline. It remains a significant component of media consumption in the UK and overall is watched more than streaming services, particularly by older people. Younger audiences, particularly those under 35, are watching considerably less television now than previous generations. Despite this, live major ceremonies, sports events and breaking news stories still hold an exceptionally strong appeal. It’s also worth remembering that live TV can be watched online, something that can disrupt viewing figures.
How many people in the UK use Twitch?
As of 2024, Twitch has a substantial user base in the United Kingdom, with approximately 13.4 million users. This figure represents about 5.23% of the total number of Twitch users worldwide. The platform's popularity can be attributed to its diverse content, including video game streaming, music broadcasts, talk shows, and artwork, making it appealing to a wide range of audiences.
Which streaming service has the most original content?
As of 2024, Netflix has the most original content among streaming platforms. It leads the pack by a significant margin, having 1.7 times more original content than any other major paid streaming services combined. This large volume of original titles is a key factor in Netflix's continued popularity and success in the streaming industry market.
That said, our global streaming index states that Amazon Prime Video is the service that offers UK streamers the best value for money.
Check out our TV and film streaming service guide to get a better idea of what service is right for you.
How many people use streaming services in the UK?
Approximately 19.2 million homes in the UK were subscribed to at least one streaming service, which represented about two-thirds (67%) of all UK households. This was a slight decline from the past when numbers had hit 68%, with this being put down to the rising cost of living affecting household budgets.
Which broadband speed do I need for streaming?
Knowing which broadband speed you need for streaming can be a complicated matter. The broadband speed you need for streaming depends on the resolution you wish to stream in. Standard definition, a minimum of 3 Mbps is recommended for streaming in standard definition. For high definition, you’ll need between 5-8 Mbps, whilst for 4K, you’ll need at least 25 Mbps.
This is easier to ascertain in some parts of the country than others, our UK mobile network speed statistics show that in Great Yarmouth, the average speed is just 18.88 Mbps.
Something that can ensure a better quality streaming experience is getting the best media streaming device you can find.
UK online streaming glossary
BVoD (Broadcaster Video on Demand)
BVoD, or Broadcaster Video on Demand, refers to a digital service offered by traditional TV broadcasters, allowing viewers to watch previously aired content online at their convenience. Unlike subscription-based models like SVoD, BVoD is typically free and ad-supported, featuring content from a specific broadcaster’s library. These are the platforms to visit if you are not sure how to watch catch-up TV online. Examples include BBC iPlayer and ITVX.
Recorded playback
Recorded playback is a feature that allows viewers to record live TV broadcasts to watch later at their convenience. This service, often included in digital TV packages or available through digital video recorders (DVRs), enables users to schedule recordings of shows, series or movies. Recorded playback offers the flexibility to pause, rewind and fast-forward through recorded content.
SVoD (Subscription Video on Demand)
SVoD, or Subscription Video on Demand, is a digital model where users pay a recurring fee for unlimited access to a diverse range of video content, such as Netflix and Disney Plus. This convenient model offers extensive programs and movies on multiple devices with personalised viewing and no ads.
Methodology and sources
https://www.ofcom.org.uk/__data/assets/pdf_file/0029/265376/media-nations-report-2023.pdf
https://www.statista.com/statistics/456058/digital-video-revenue-category-digital-market-outlook-uk/
https://www.statista.com/statistics/440229/svod-revenue-in-the-united-kingdom/
https://www.statista.com/statistics/1402007/bvod-svod-viewer-number-uk/
https://www.statista.com/statistics/529734/netflix-households-in-the-uk/
https://www.statista.com/statistics/273883/netflixs-quarterly-revenue/
https://www.statista.com/statistics/529740/svod-services-by-penetration/
https://www.statista.com/statistics/1109418/disney-plus-subscribers-uk/
https://www.statista.com/statistics/1306719/uk-tv-streaming-websites-visits/
https://www.statista.com/statistics/1382358/stream-original-shows-preference-uk-by-age/
https://www.statista.com/statistics/1341106/most-well-known-video-on-demand-brands-in-the-uk/
https://www.uswitch.com/mobiles/screentime-report/ https://worldpopulationreview.com/country-rankings/twitch-users-by-country
https://twitchtracker.com/statistics
https://www.statista.com/statistics/1308226/uk-distribution-twitch-users-by-age/
https://www.statista.com/topics/6408/music-streaming/
https://www.statista.com/statistics/653926/music-streaming-service-subscriber-share/
https://www.statista.com/outlook/dmo/digital-media/digital-music/music-streaming/united-kingdom
https://eraltd.org/news-events/press-releases/2024/uk-entertainment-sales-grow-7-to-119bn/
https://virpp.com/hello/music-streaming-payouts-comparison-a-guide-for-musicians/
https://www.savethestudent.org/shopping/best-music-streaming-services.html
https://www.macrotrends.net/stocks/charts/SPOT/spotify-technology/revenue
https://chartmasters.org/most-streamed-tracks-on-spotify/
https://strivesponsorship.com/wp-content/uploads/2023/08/The-Global-Sports-Media-Report.pdf
https://iccopr.com/wp-content/uploads/2019/03/Sports-Around-the-World-report.pdf
https://about.grabyo.com/2022-uk-sports-video-trends/
https://blog.gwi.com/chart-of-the-day/worlds-most-popular-sports/
https://www.888sport.com/blog/all-sports/10-most-viewed-sports-events-of-all-time
https://en.wikipedia.org/wiki/List_of_most_watched_television_broadcasts_in_the_United_Kingdom
https://www.statista.com/outlook/amo/esports/worldwide
https://www.statista.com/statistics/490358/esports-revenue-worldwide-by-segment/
https://www.statista.com/statistics/490480/global-esports-audience-size-viewer-type/ https://www.statista.com/statistics/807889/dota-2-tournament-prize-pool/#:~:text=Annual%20Dota%202%20global%20tournaments%20prize%20pool%202014%2D2023&text=In%202023%2C%20the%20estimated%20cumulative,million%20U.S.%20dollars%20in%202021.


